
Data from the European Union’s Statistics on Income and Living Conditions (EU-SILC) provides insights into how individuals gauge their experience of life. Respondents are asked to rate their overall life satisfaction on a scale from 0 (very dissatisfied) to 10 (very satisfied).
This table maps out the data by country and by where respondents are in the income distribution.
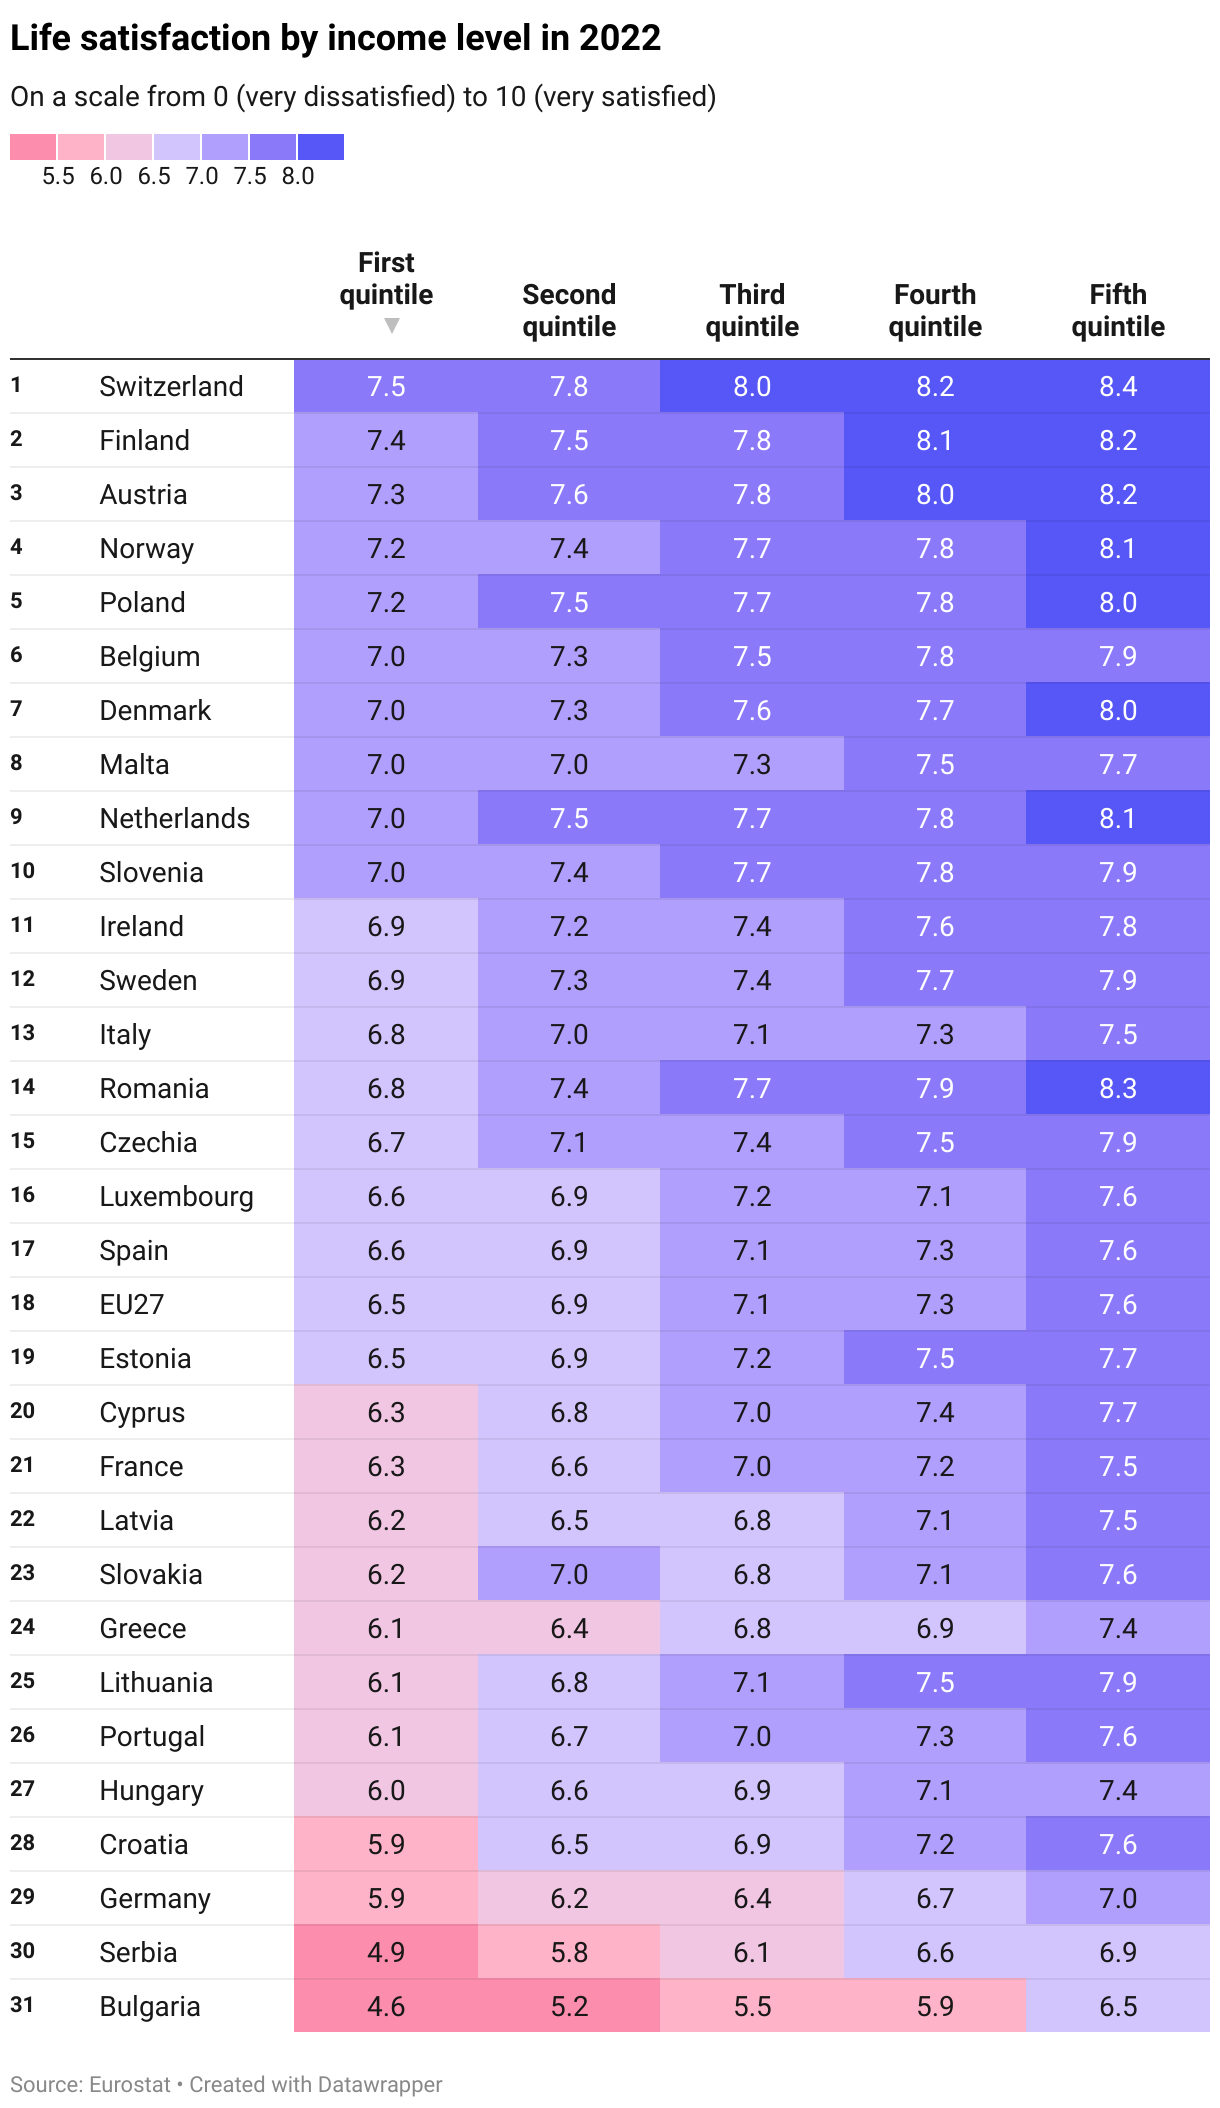
In 2022, the EU27 average for the first quintile (bottom 20% of earners) was a score of 6.5, while in the fifth quintile it was 7.6 (top 20% of earners). People with high income tended to be more satisfied with life across all countries covered.
In countries with generally lower life satisfaction, the gap between people at the bottom and top can be quite large. For example, in Serbia and Bulgaria where it is around 2 points.
In countries with higher overall life satisfaction, the gap tends to be smaller. In Switzerland, people in the first quintile gave a score of 7.5, compared to 8.4 for the fifth quintile.
Notably, 1st quintile scores in the highest satisfaction countries can match 5th quintile scores in some lower satisfaction countries. For example in Germany, the fifth quintile (top 20%) gave a score of 7.0 in 2022. 10 countries had a similar or higher score in their first quintile (bottom 20% of earners) in 2022, including Slovenia, Netherlands, Denmark, Poland, Austria, and Finland.
Another observation is that with the scale going from 0 to 10, a score of higher than 5 can be interpreted as people being more satisfied than dissatisfied. Across all the countries with data for 2022, no country had an overall score of less than 5, with Bulgaria at 5.5 the lowest. When considering the grouping by income, even the first quintile is above 5 or close to 5 in all countries covered.
Read more:
- Data is from Eurostat. Country data by income level can be found in this table.
- If you find this interesting, we have just published a longer article on the Eurostat data, exploring variations in life satisfaction by age, urbanisation and household type.