
Assessing the well-being of a population extends beyond mere economic metrics. A more nuanced understanding often emerges from individuals’ own perceptions of their quality of life.
The European Union’s Statistics on Income and Living Conditions (EU-SILC) provides valuable insights into this aspect by collecting data on individuals’ overall life satisfaction. Respondents across European countries, including both EU and non-EU members, are asked to rate their satisfaction with life on a scale from 0 (very dissatisfied) to 10 (very satisfied).
This data tracker looks closer at the latest data from 2023 to see how life satisfaction varies not just between countries, but also by age, education level and income as well as household size.
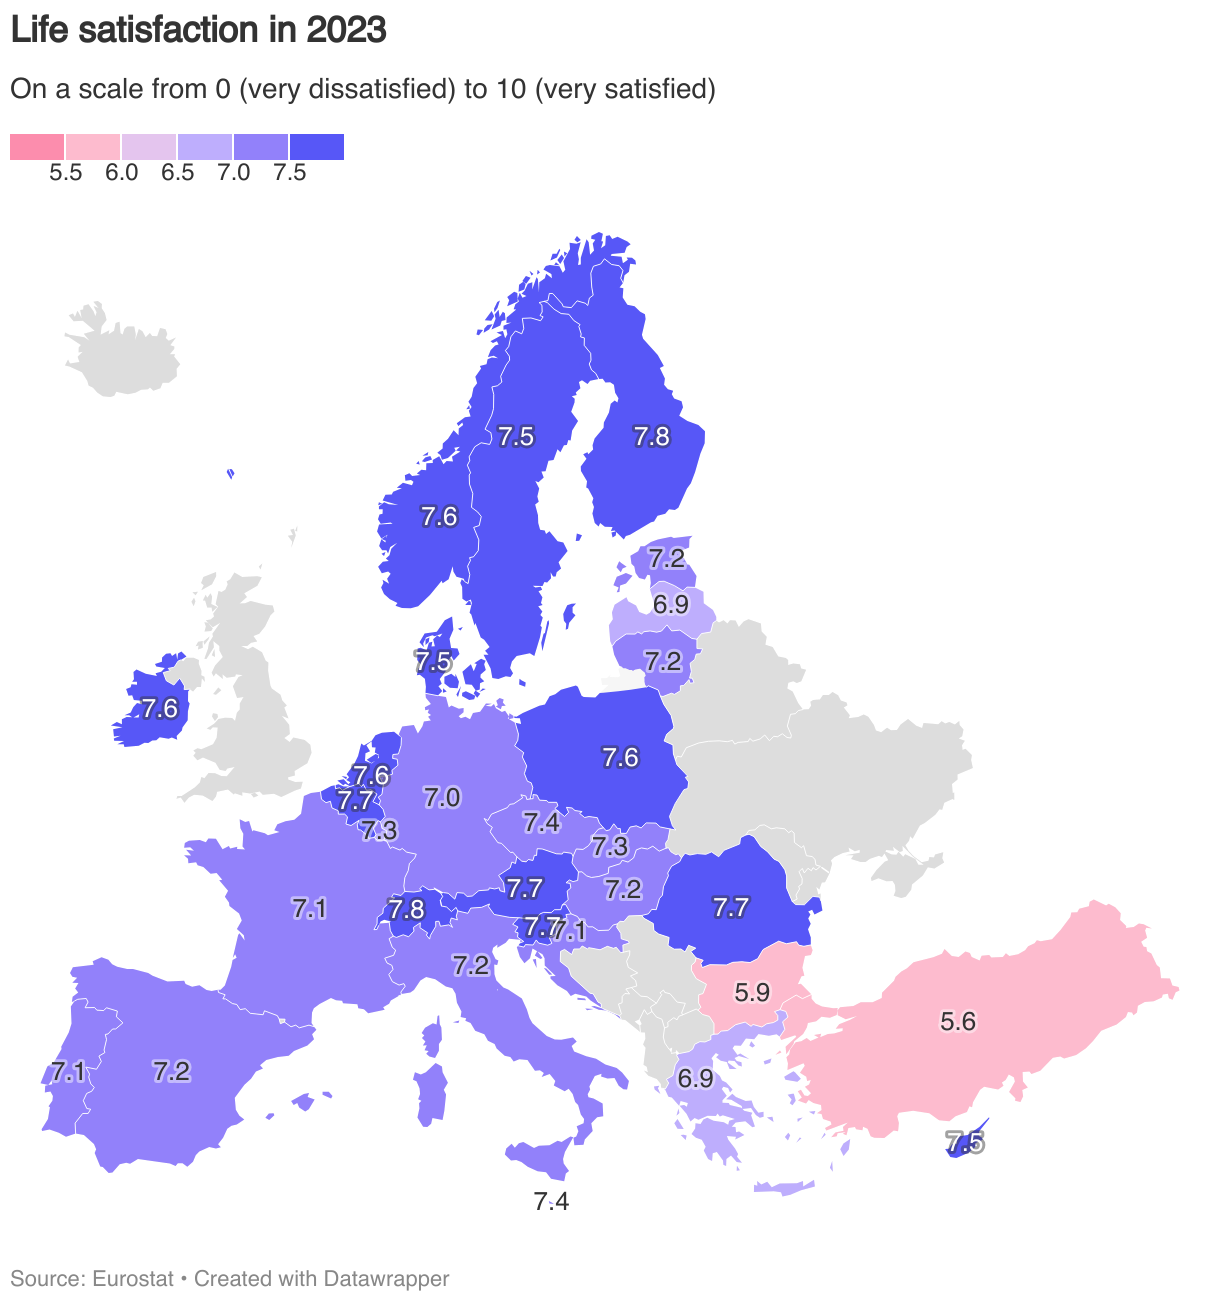
Finland and Switzerland lead in life satisfaction in 2023
In 2023, Switzerland and Finland had the highest overall life satisfaction with an average life satisfaction score of 7.8 out of 10. Austria, Belgium, Romania and Slovenia followed closely, all with an average score of 7.7. Turkey recorded the lowest level of life satisfaction with a mean score of 5.6 followed by Bulgaria at 5.9. An average score across all countries of above 7, indicates that Europeans are generally satisfied with life.
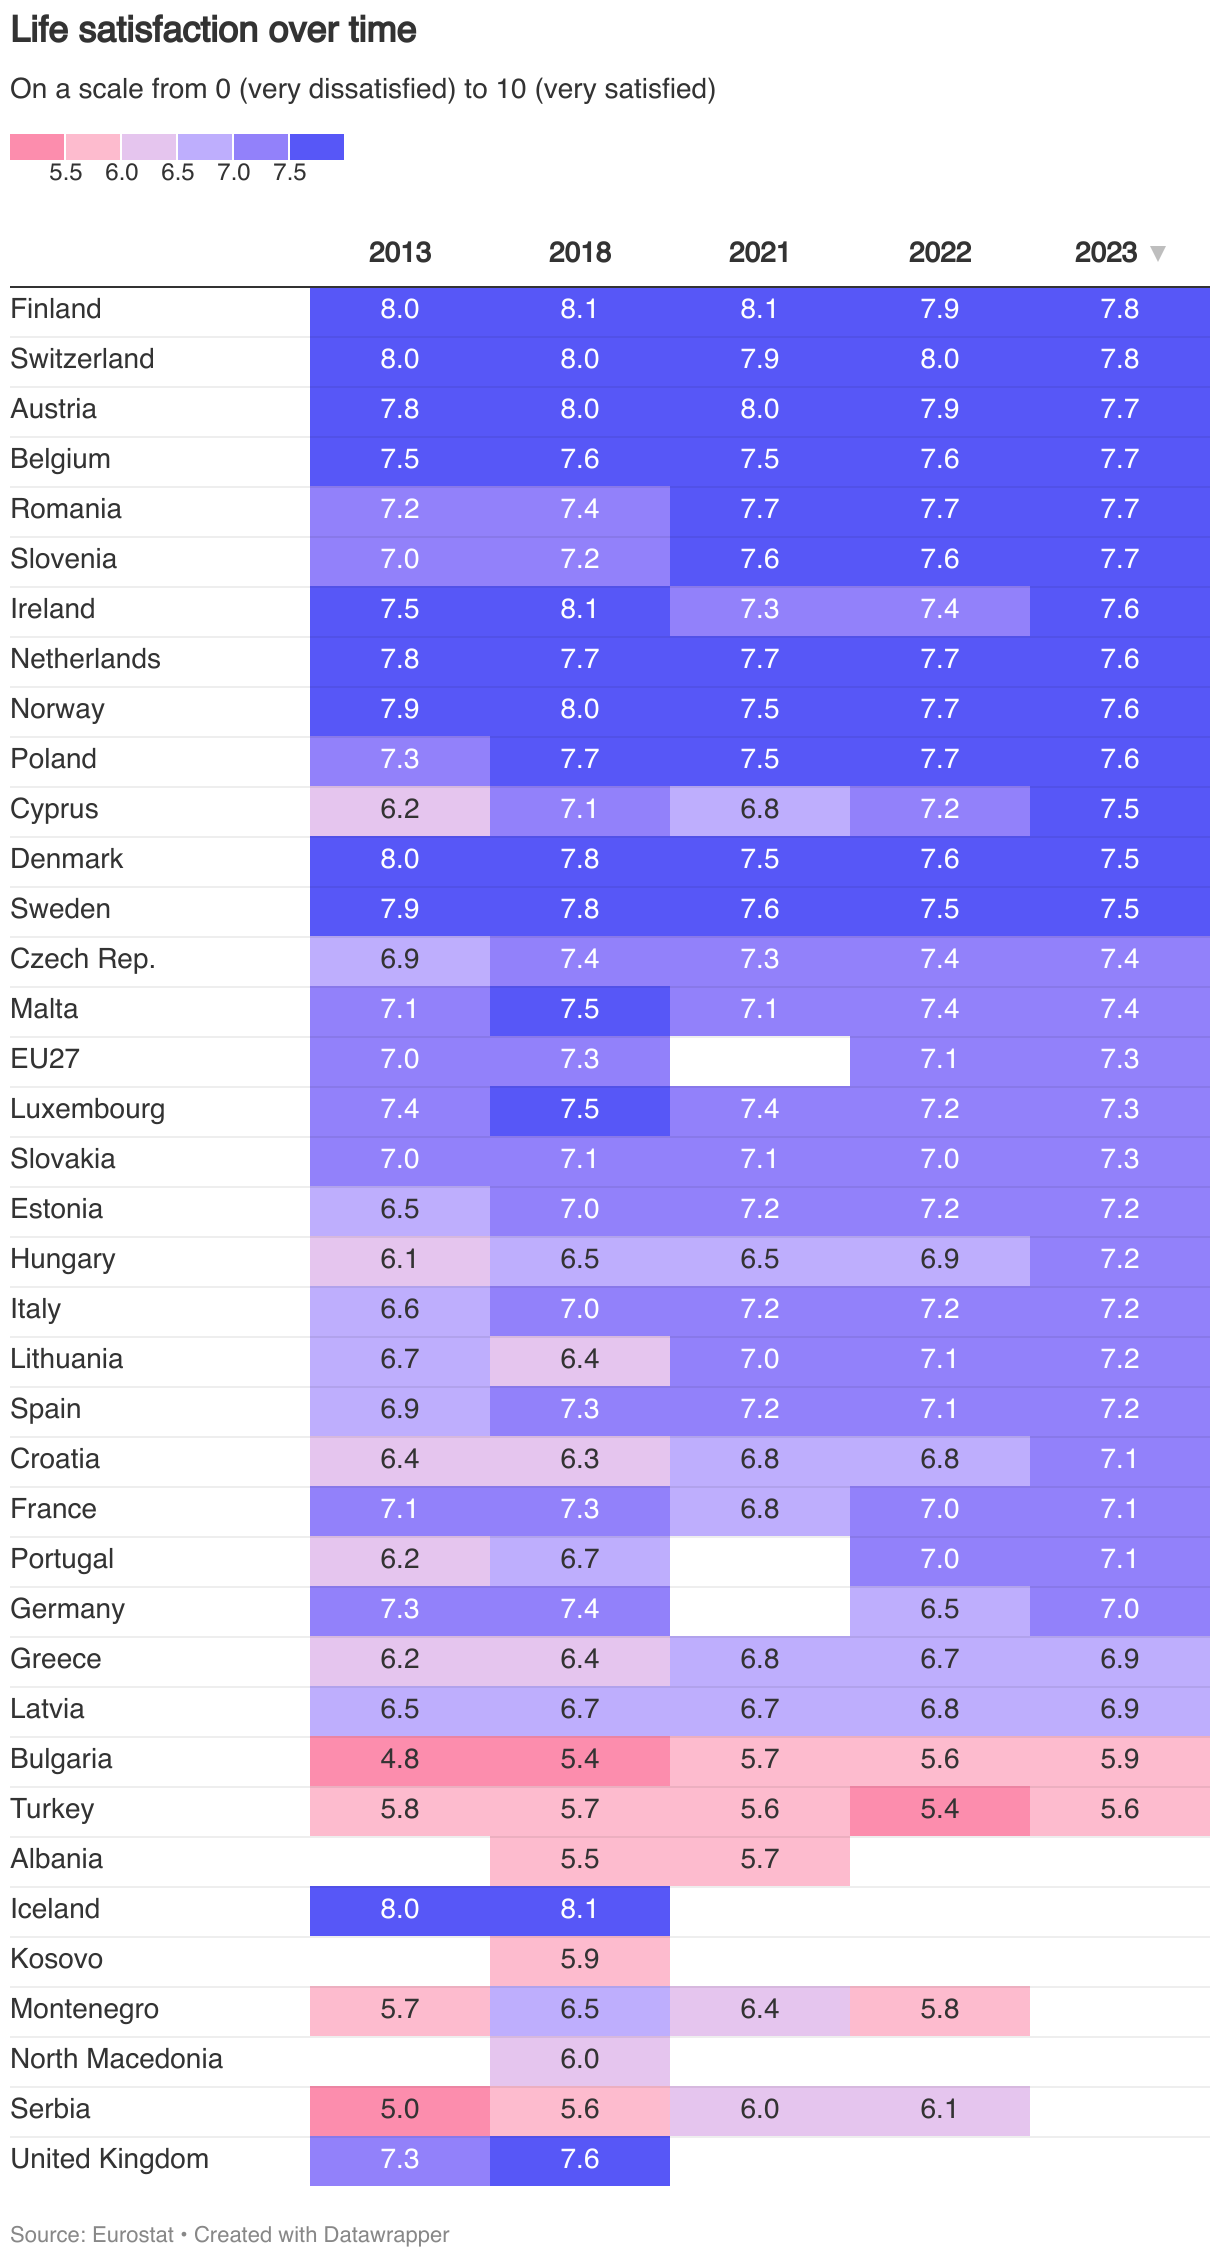
The EU-SILC data covers five key years: 2013 (the earliest year available), 2018, 2021, 2022, and 2023. The table below presents the average life satisfaction scores for each country during these years, offering a longitudinal perspective on well-being trends across the continent. Please note that data is not available for all countries across the five years.
While these trends provide valuable insights, it is important to interpret comparisons over time with caution. For certain countries, the reliability of the data or breaks in the time series may affect the accuracy of trend analysis. Specifically, for the 2023 data, this includes Finland, Slovenia and Croatia (due to breaks in the time series), and Poland, Hungary, France, Portugal, and Germany (due to low reliability). For a more detailed examination, please consult the Eurostat source data.
That being said, from 2013 to 2023, countries such as Finland, Switzerland, and Austria have consistently maintained high scores of self-reported life satisfaction at or close to 8.0. Bulgaria, Cyprus, Hungary, Portugal are among the countries that have made marked improvements since 2013.
Life satisfaction by age
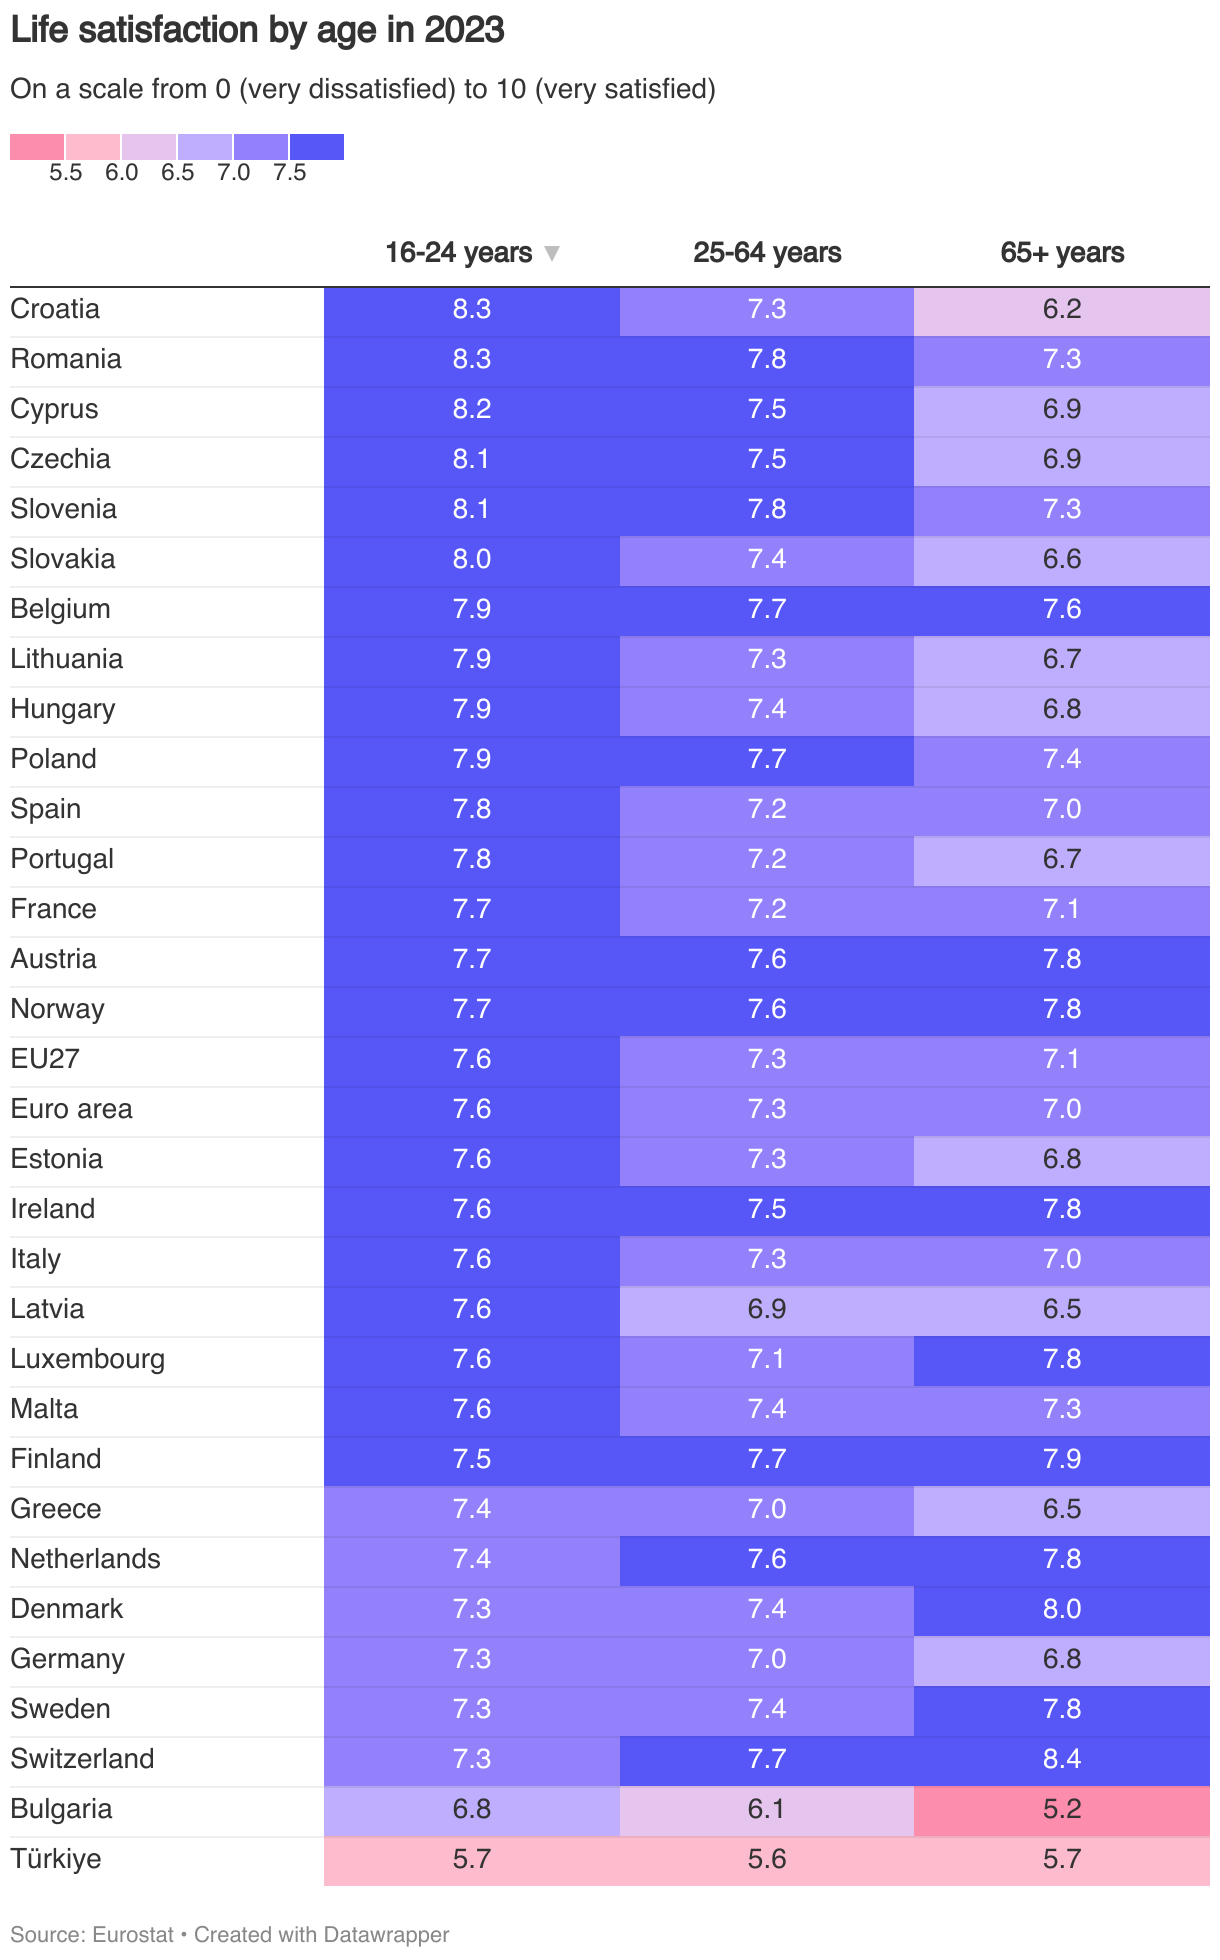
Life satisfaction can vary significantly across different age groups. The EU-SILC data for 2023 provides insights into how life satisfaction scores differ among three key age categories: 16-24 years, 25-64 years, and 65 years or over.
Overall across all countries, the 2023 data indicates that young people generally tend to be more satisfied with life than the elderly. Among young people (16-24 years), several countries score above 8.0, including Croatia, Romania, Cyprus, Czechia, Slovenia and Slovakia. Notably, these countries ranked lower when we looked at the population as a whole above.
In a few countries, the elderly report significantly higher life satisfaction than the young, such as in Switzerland, Denmark, the Netherlands and Sweden.
Life satisfaction by sex
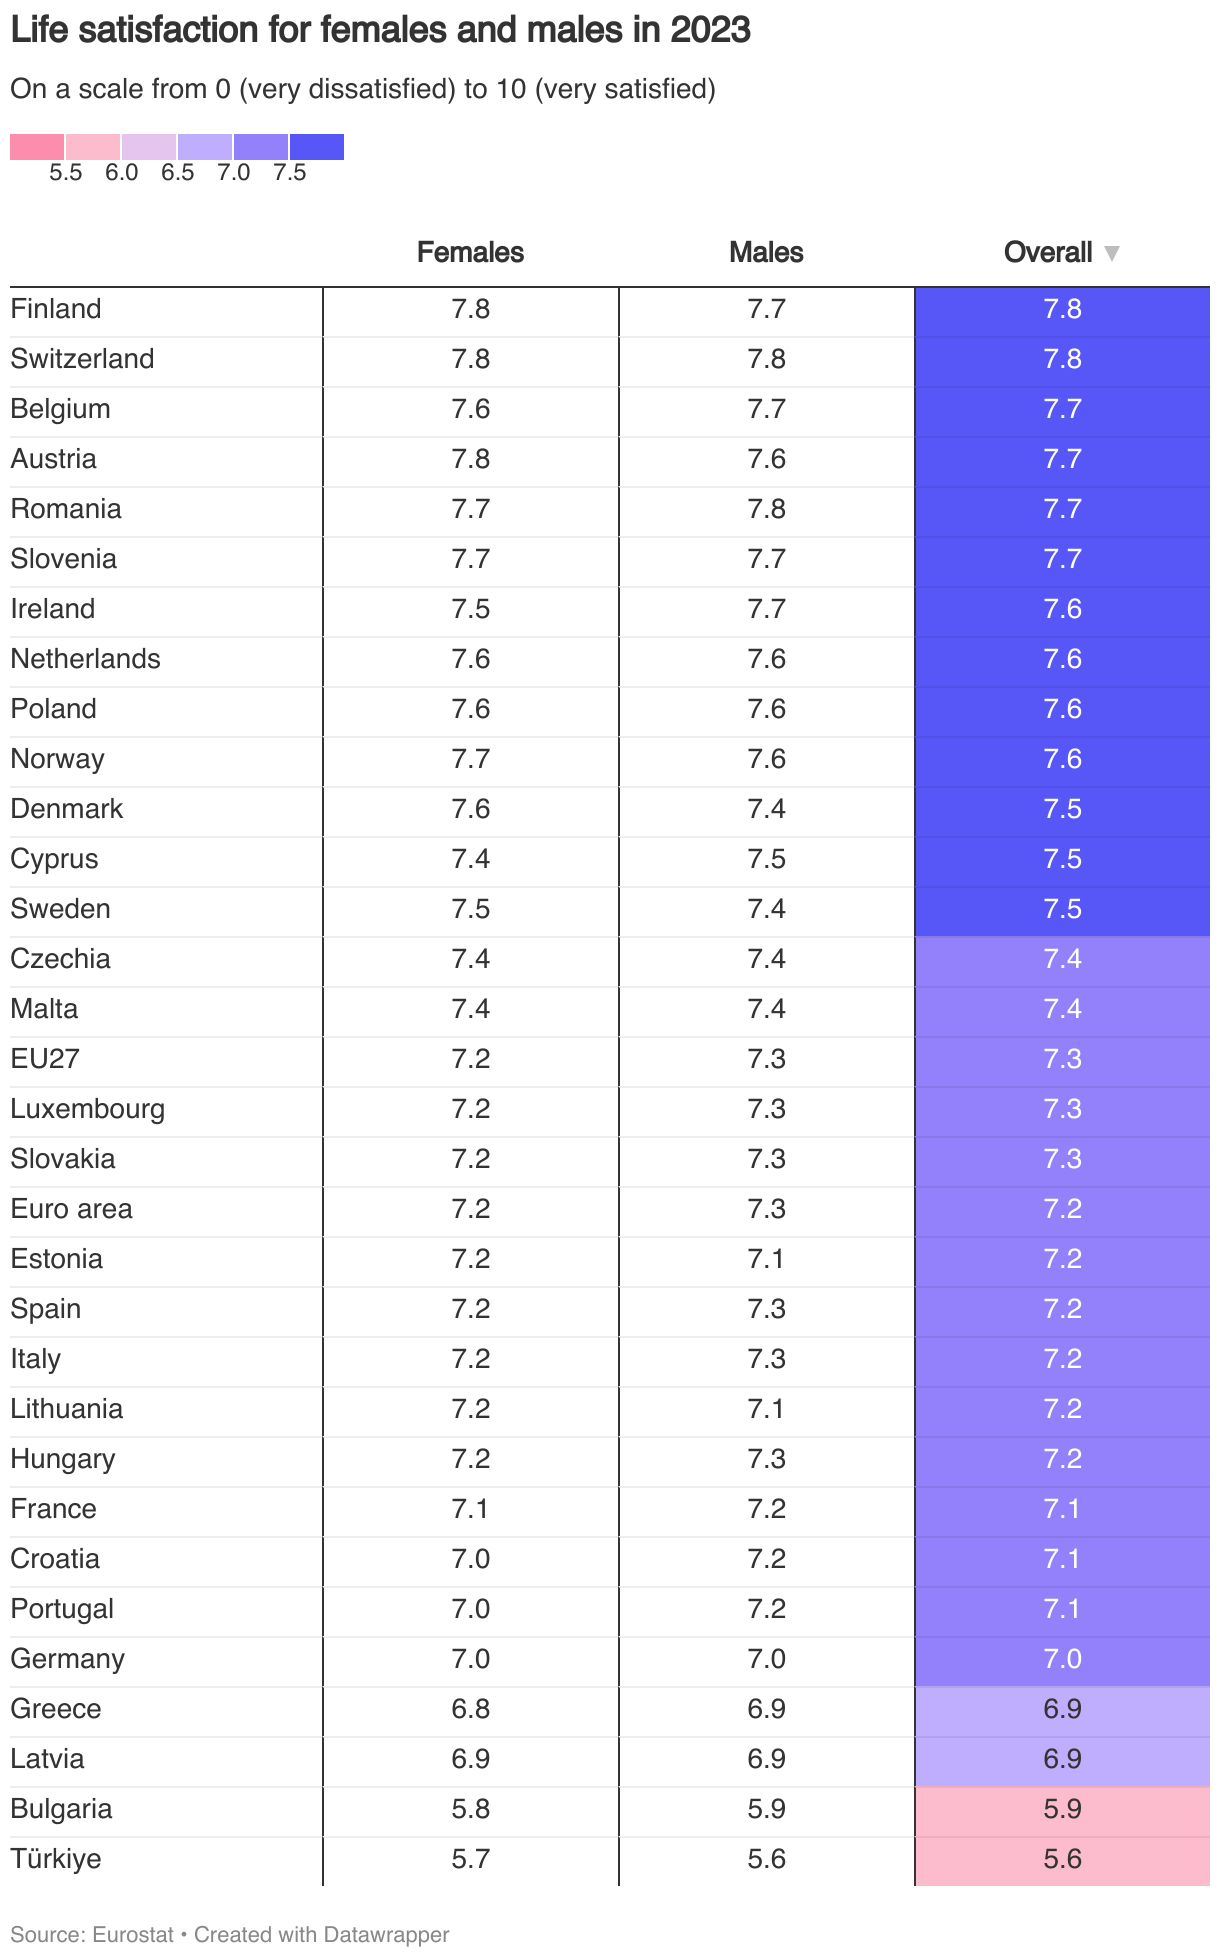
There are only minor differences between females and males in self-reported life satisfaction. This finding is consistent across the countries that have reported data in the 2023 study. In Denmark and Austria, females report slightly higher life satisfaction than males (+0.2), while in Ireland, Croatia, and Portugal, males report slightly higher life satisfaction than females (0.2+).
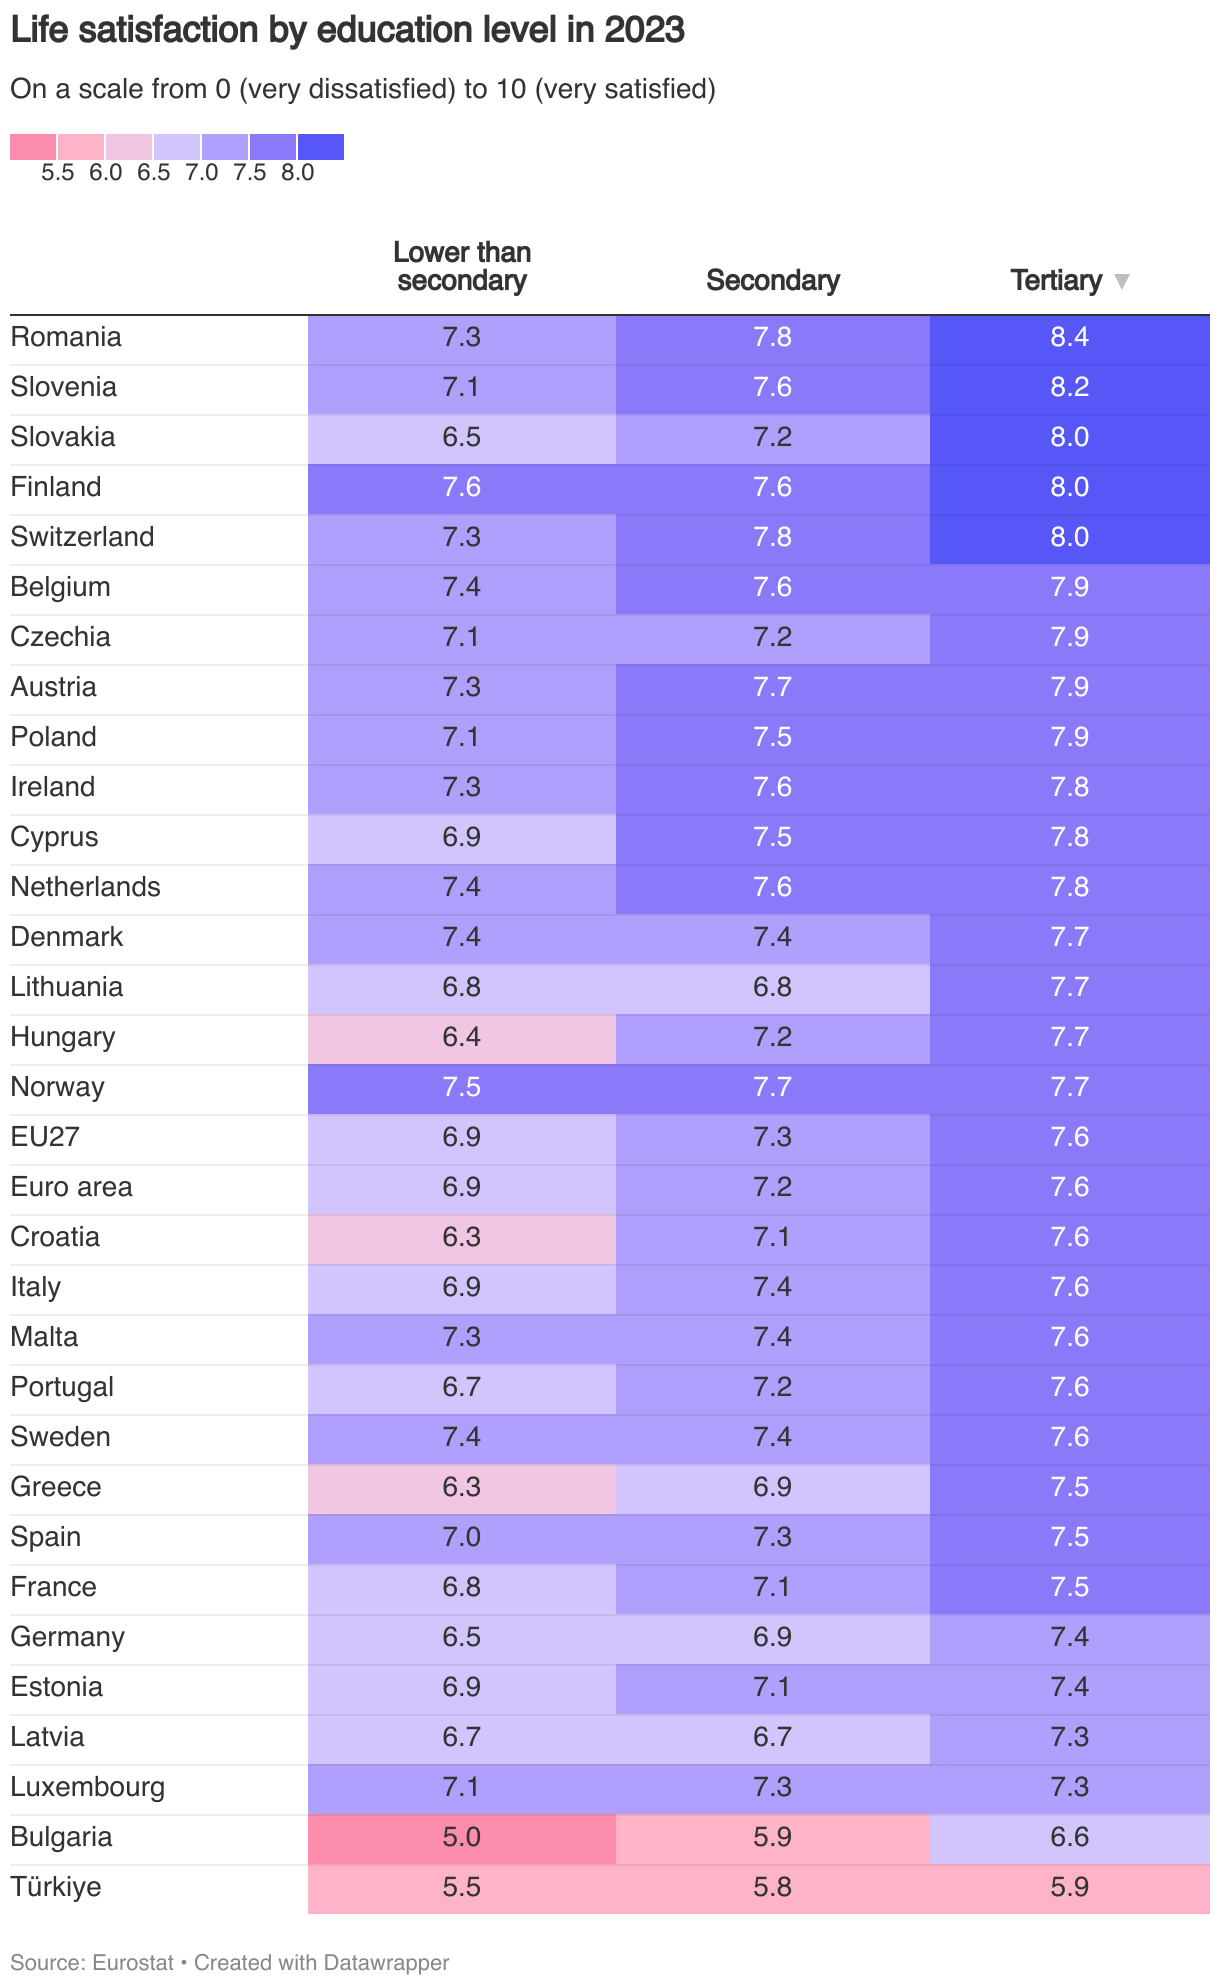
Life satisfaction by education level
A closer look at life satisfaction by education level in shows that higher education levels are associated with greater life satisfaction across all countries surveyed. Romania leads among those with tertiary education as their highest education level with a score of 8.4, while among those with lower than secondary education Finland has the highest score of 7.6.
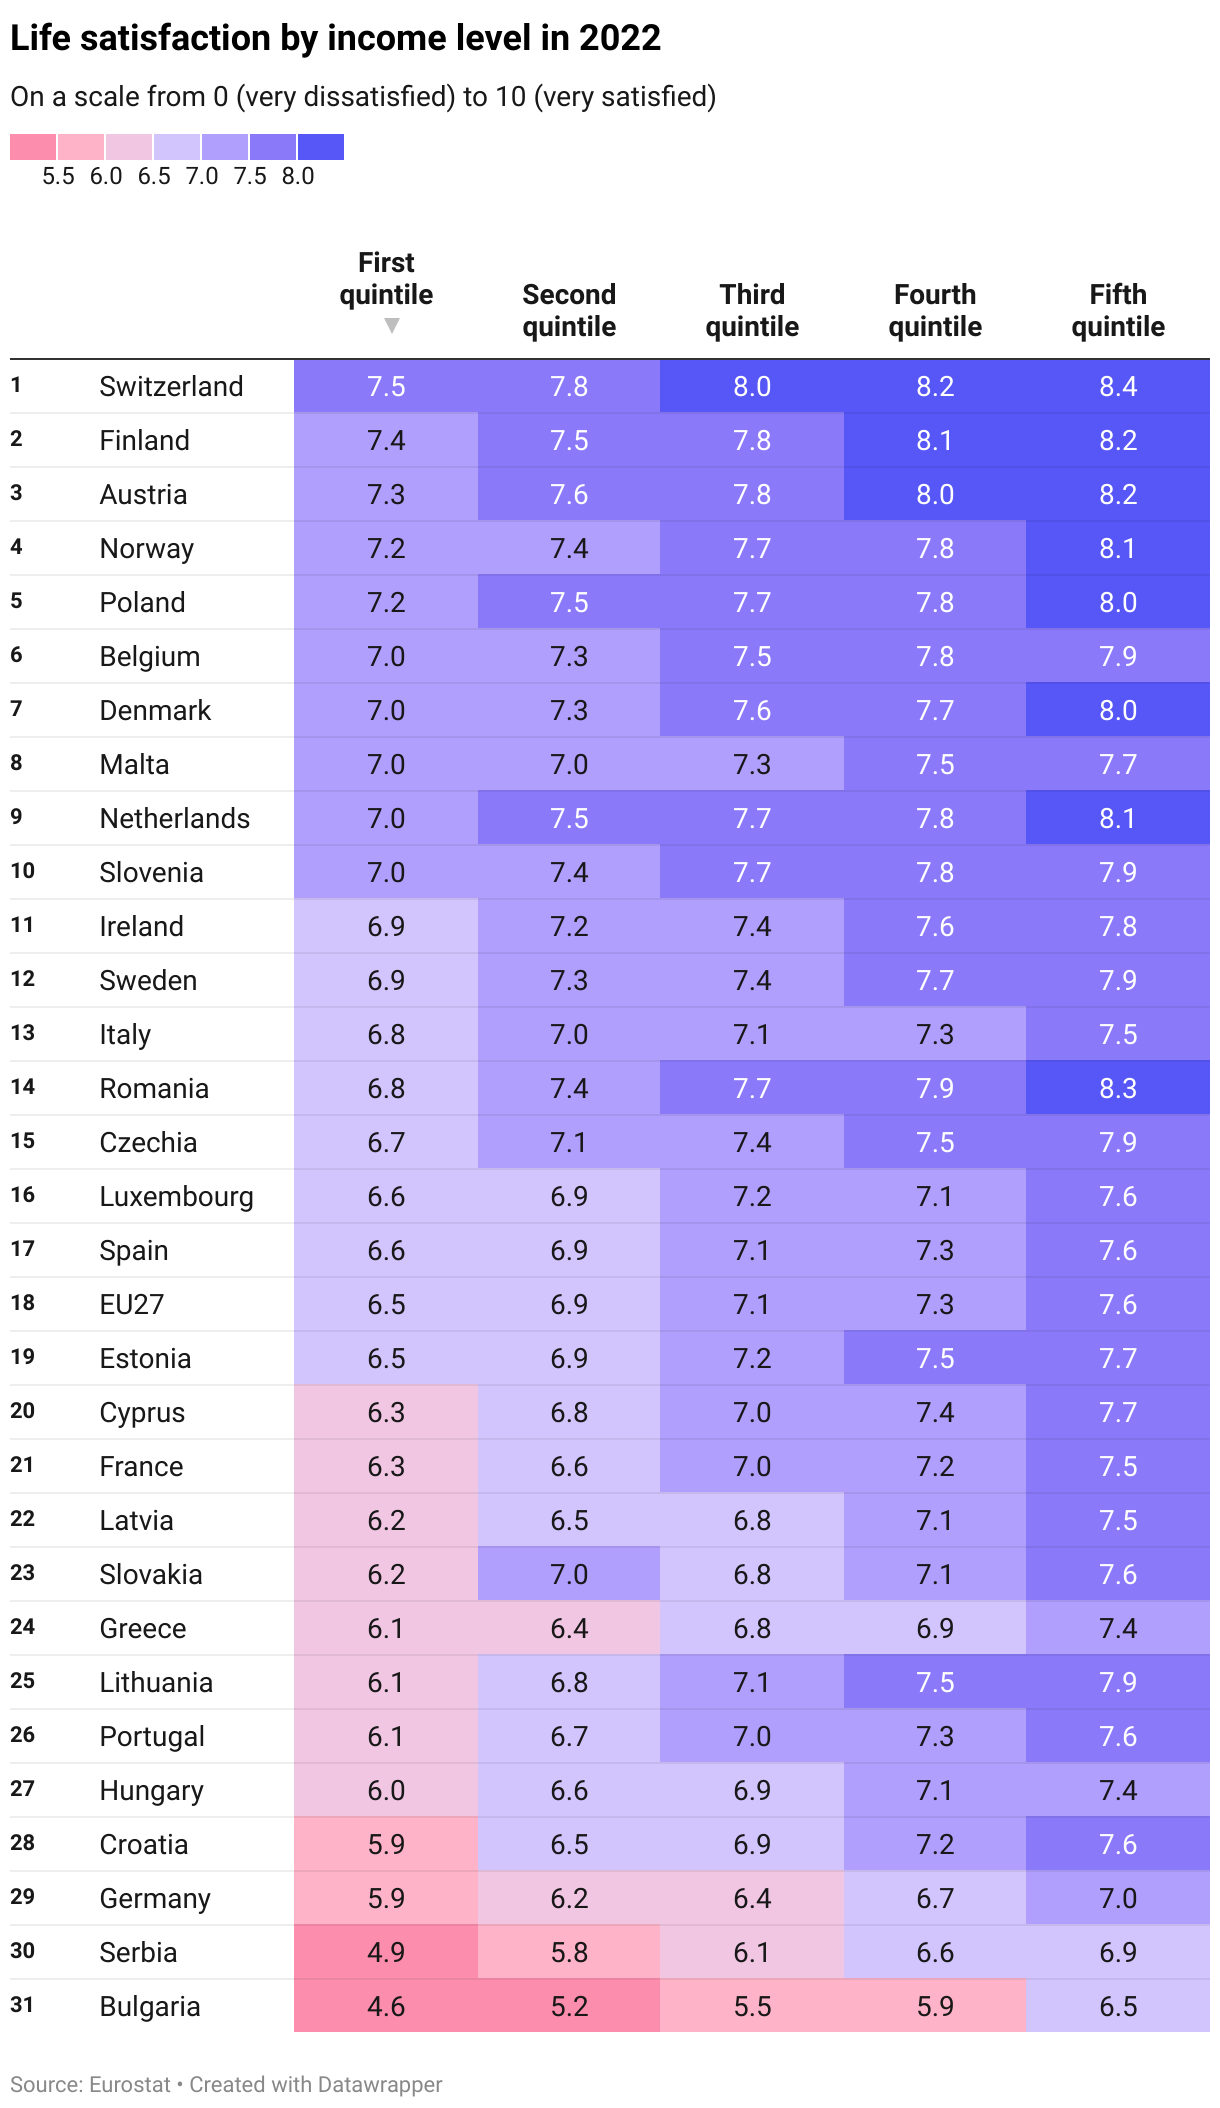
Life satisfaction by income level
When examining life satisfaction based on income, individuals with higher incomes report a higher degree of life satisfaction. The table below categorises the population into five quintiles based on their income levels. Individuals in the top 20 percent (fifth quintile) of the income distribution consistently report the highest life satisfaction across all countries. Conversely, those in the bottom 20 percent (first quintile) have the lowest life satisfaction scores across all nations.
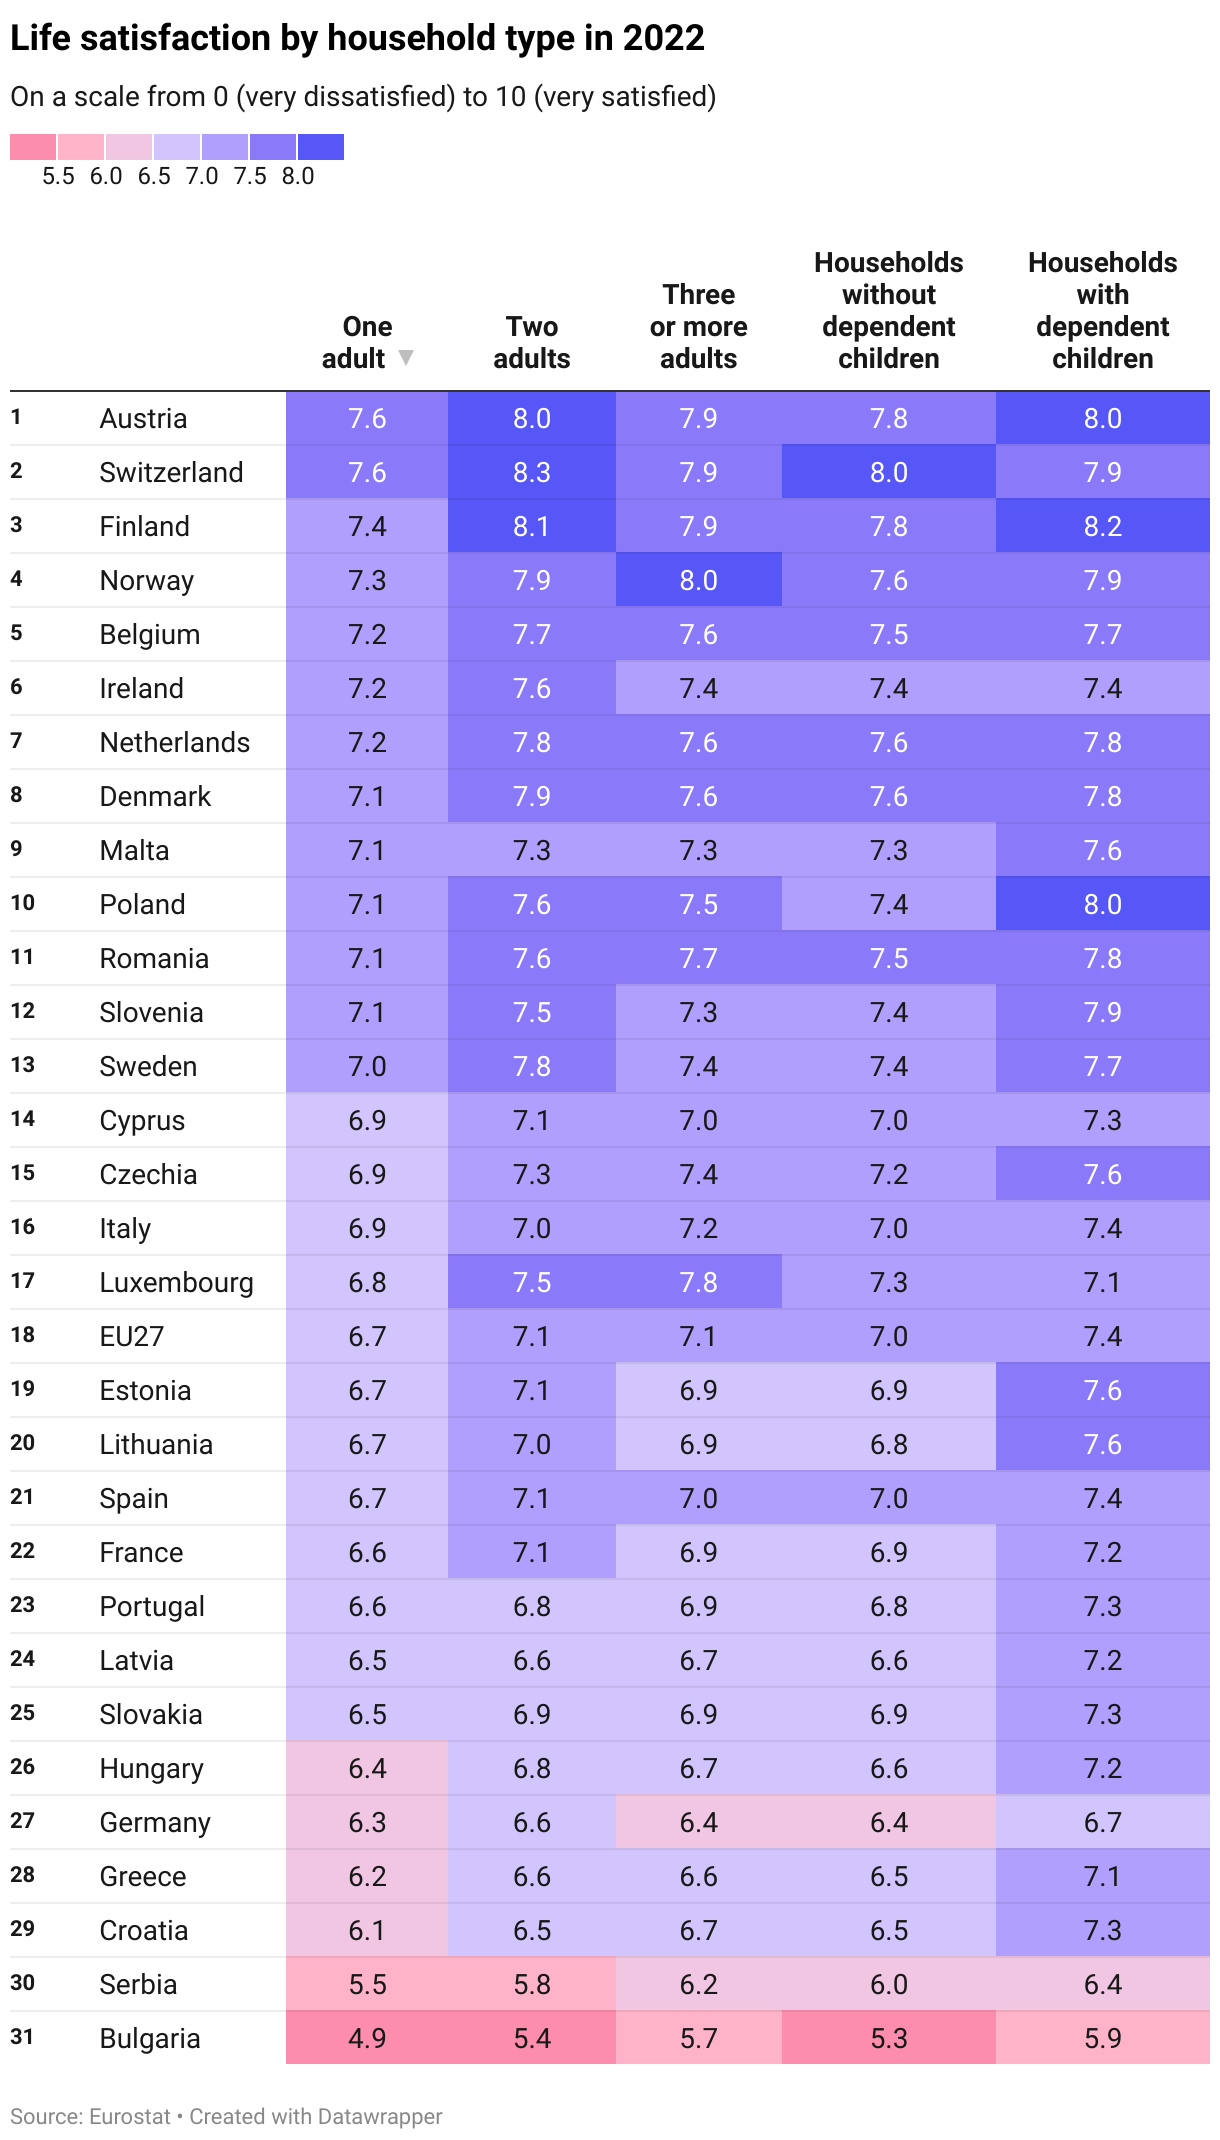
Life satisfaction by household type
The Eurostat data categorises households into five types: one adult, two adults, three or more adults, households with dependent children, and households without dependent children.
One adult households report the lowest level of life satisfaction across the countries surveyed. Households with dependent children tend to report the highest levels life satisfaction. Considering all household types, Switerland reported the highest level of life satisatifaction at 8.2 for a two adult household, while Bulgaria reported the lowest level of life satisfaction at 5.3 for a one adult household.
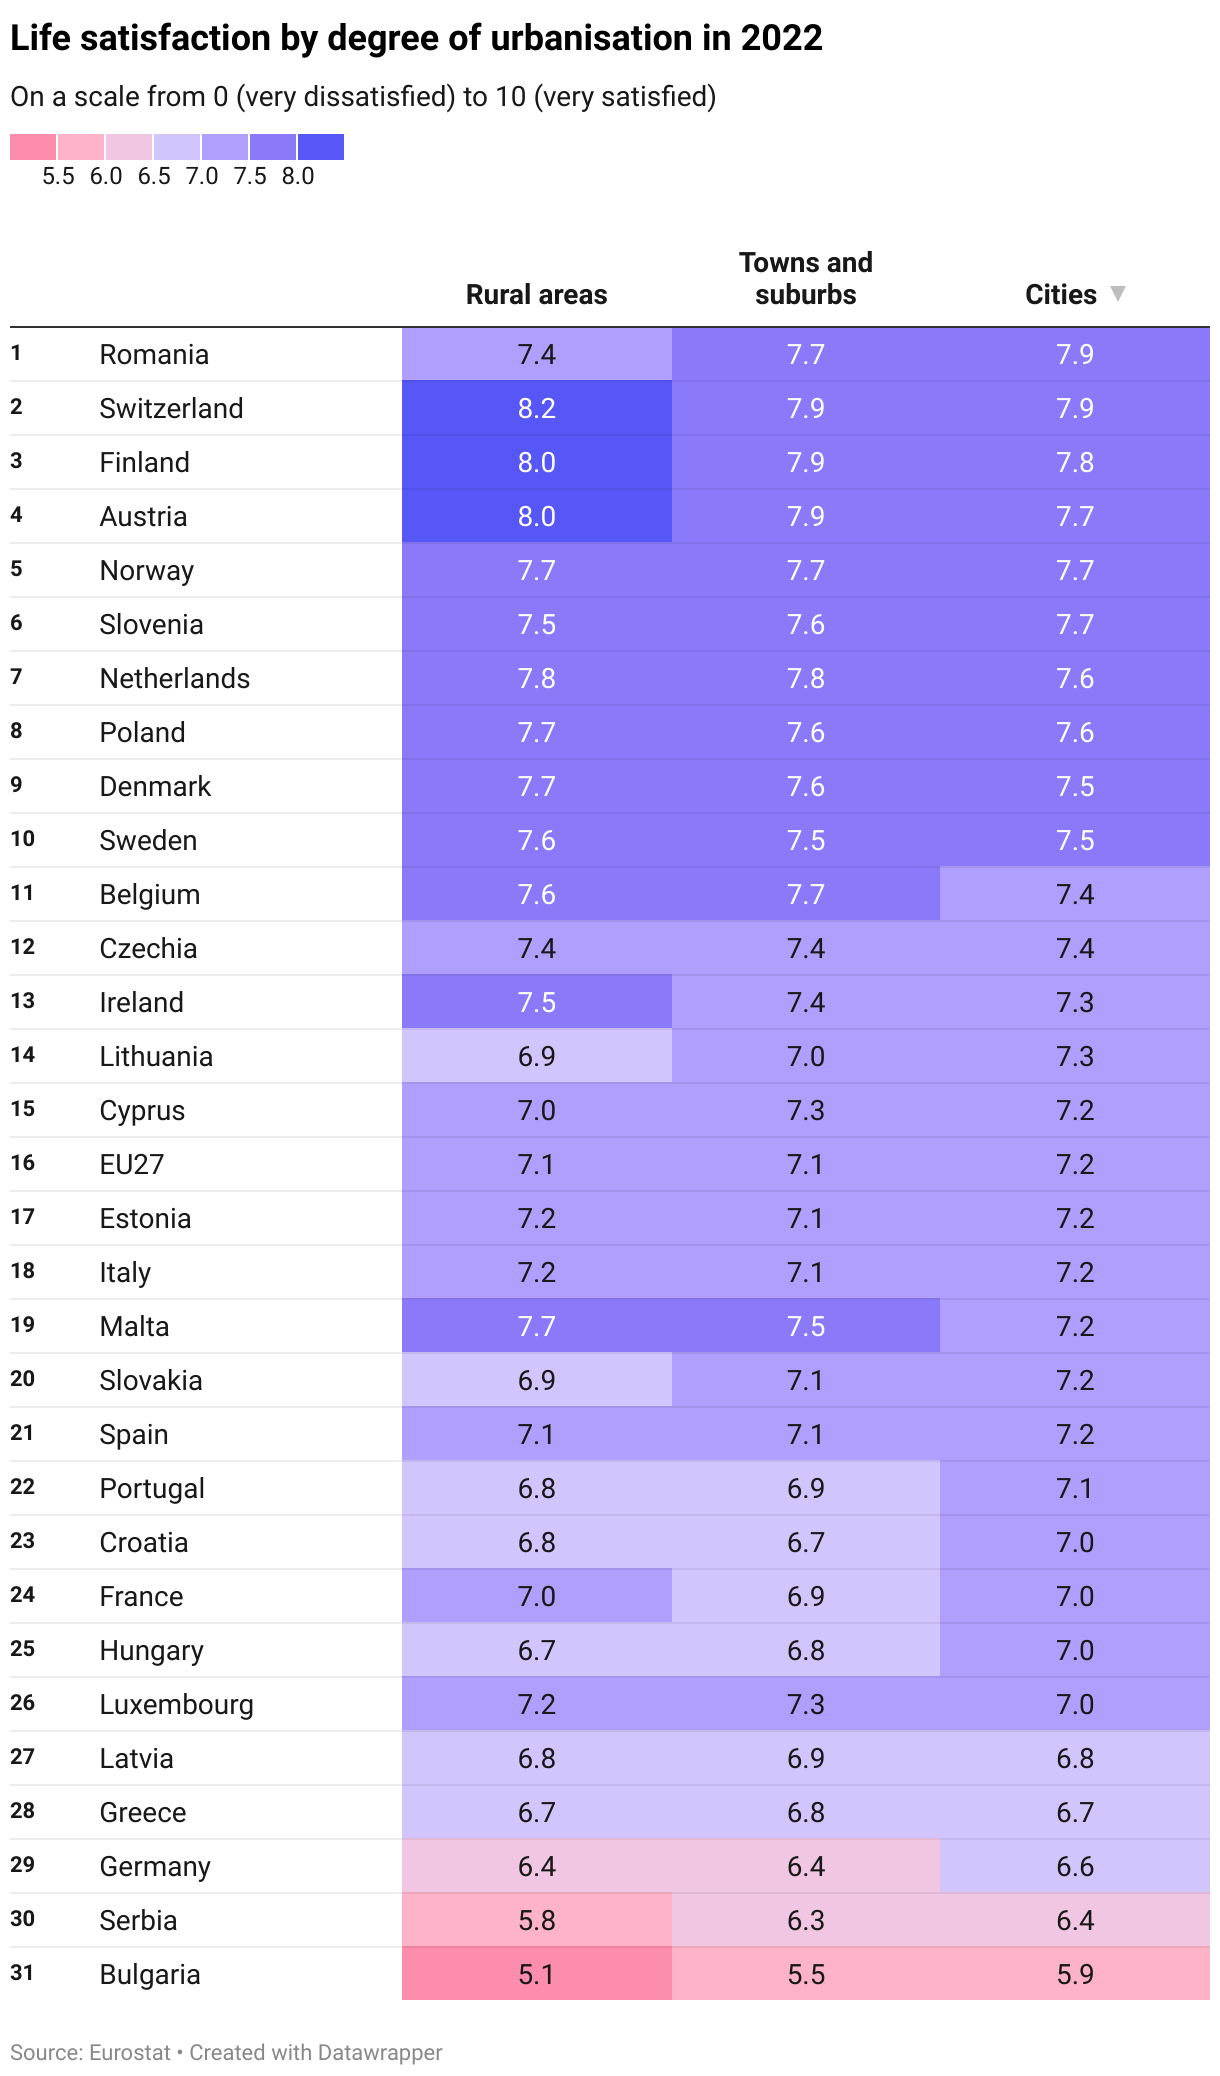
Life satisfaction by degree of urbanisation
Life satisfaction does not follow a uniform pattern across urbanisation levels in Europe. In countries with generally high life satisfaction, such as Austria, Belgium, Denmark, Finland, and Switzerland, individuals living in rural areas report slightly higher life satisfaction than those residing in cities. Conversely, in nations with lower overall satisfaction like Bulgaria and Serbia urban residents tend to have higher satisfaction scores compared to their rural counterparts.
About the data
The data used on this page is from Eurostat. Data for overall life satisfaction by age, sex and education level is from this table, while data by income, degree of urbanisation and household type is from this table.
Changelog
- Updated in March 2025 with additional 2023 data released by Eurostat.
- Updated in October 2024 with new 2023 data released by Eurostat.
- Updated in May 2024 to reflect new data for 2022 released by Eurostat.
- Initial release February 2024 covering Eurostat data up to 2022.