
U.S. trade data for 2023 shows that the trade deficit was $773 billion in 2023. This was $178 billion less than in 2022, and the largest annual decline since 2008 to 2009, according to data released by the U.S. Bureau of Economic Analysis and the U.S. Census Bureau this week.
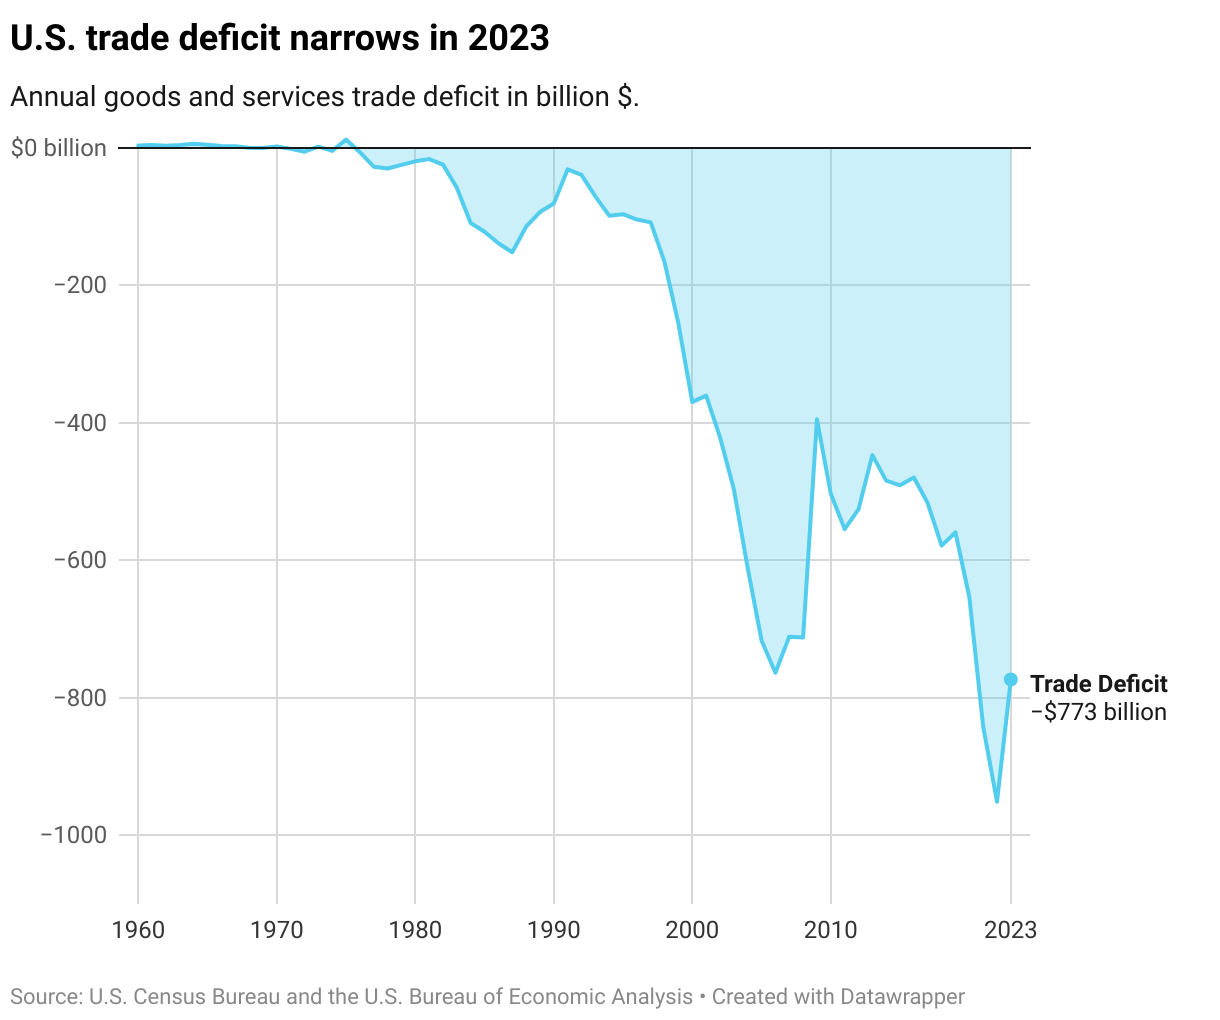
The trade deficit refers to the difference between a country’s exports and imports. If a country imports more goods and services than it exports, it has a trade deficit. Conversely, if a country exports more than it imports, it has a trade surplus. In 2023, U.S exports stood at $3,054 while imports stood at $3,827. Compared to 2022, exports were up by $35 billion while imports were down by $143 billion.
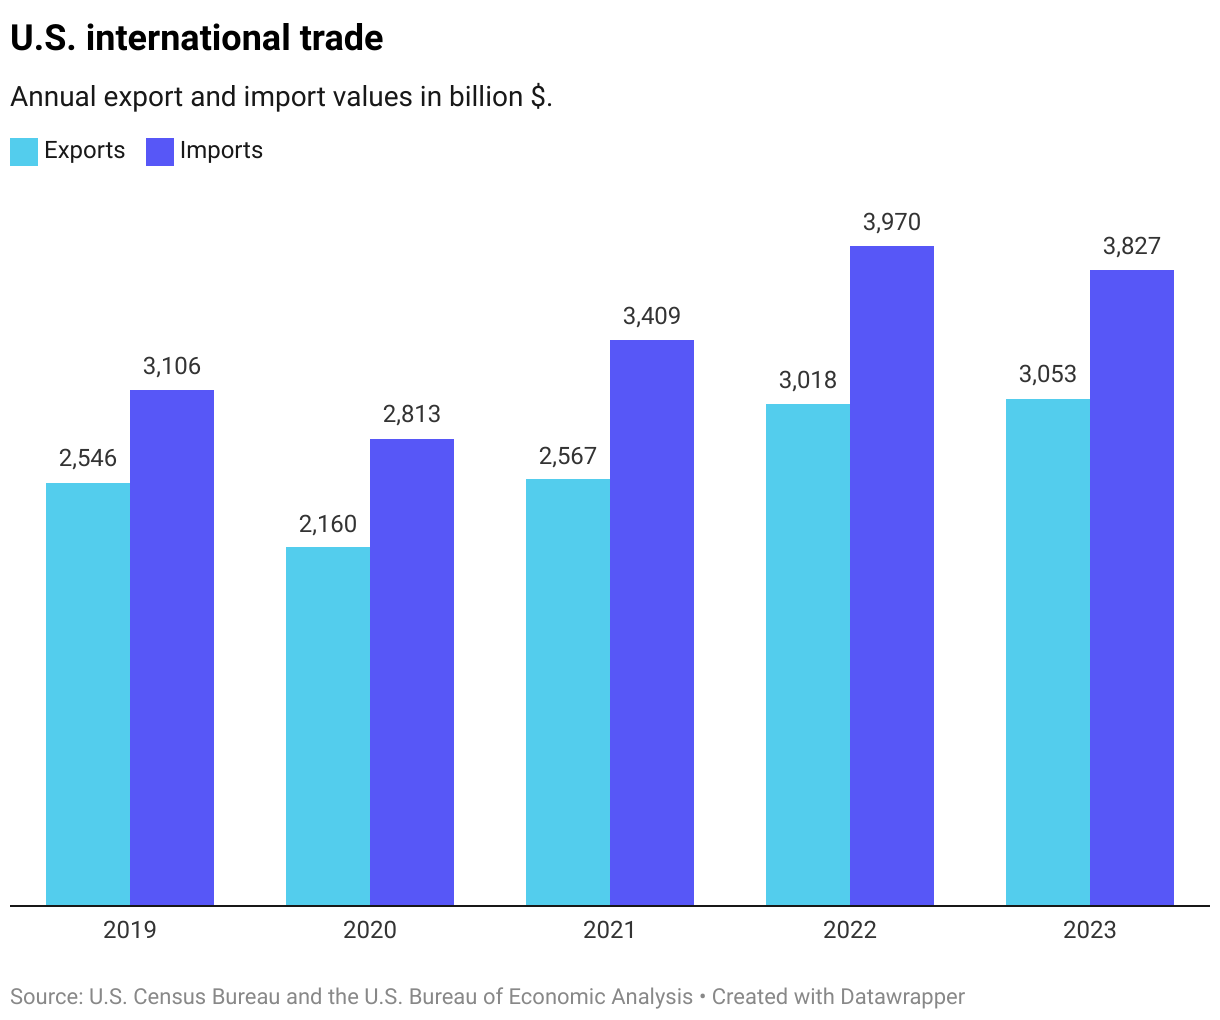
This improvement in the trade deficit from 2022 was driven by a significant reduction in goods imports, particularly in industrial supplies and consumer goods, alongside a robust increase in services exports, such as in travel and financial services.
A closer look at exports:
In 2023, U.S exports stood at $3,054B, up $35B from 2022.
Goods exports decreased by $39.2B to $2,051B:
- Industrial supplies and materials -$102.8B
- Foods, feeds, and beverages -$17.4B
- Capital goods +$28.5B
- Automotive vehicles, parts, and engines +$19.3B
- Consumer goods +$14.7B
Services exports increased by $74.2B to $1,003B:
- Travel +$38.3B
- Financial services +$7.4B
- Transport +$7.3B
- Telecom, computer and information services +$7.1B
A closer look at imports:
In 2023, U.S imports stood at $3,827B, down $142.7B from 2022.
Goods imports decreased by $160.5B to $3,112B:
- Industrial supplies and materials -$130.8B
- Consumer goods -$80.7B
- Automotive vehicles, parts, and engines +$59.5B
Services imports increased by $17.8B to $714.5B:
- Travel +$34.5B
- Transport -$14.7B
Read more:
- U.S. Census Bureau and the U.S. Bureau of Economic Analysis, U.S. International Trade in Goods and Services, December and Annual 2023