
The U.S. Census Bureau last week released new data from their experimental Household Pulse Survey, a 20-minute online survey conducted between January 9 – February 5, 2024.
The survey measures how emergent issues are impacting U.S. households from a social and economic perspective. In its current iteration (4.0), the survey covers topics such as food security, health, housing, natural disasters, social isolation, inflation and spending. Approximately 68,000 respondents answered the online questionnaire.
National Averages
Here are some of the key national averages across 10 of the 13 topics covered by the January to February 2024 survey:
- Food scarcity: 10.7% of adults live in households where there was either sometimes or often not enough food to eat in the last 7 days (+/- 0.4% margin of error)
- Food Assistance for Children: 43.0% of adults live in households where children currently receive food assistance (+/- 1.2%)
- Long COVID-19 Symptoms: 30.3% of adults who previously had COVID-19, with symptoms lasting 3 months or longer (+/- 0.8%)
- Unable to Pay Energy Bill: 23.2% of adults live in households that were unable to pay an energy bill in full in the last 12 months (+/- 0.5%)
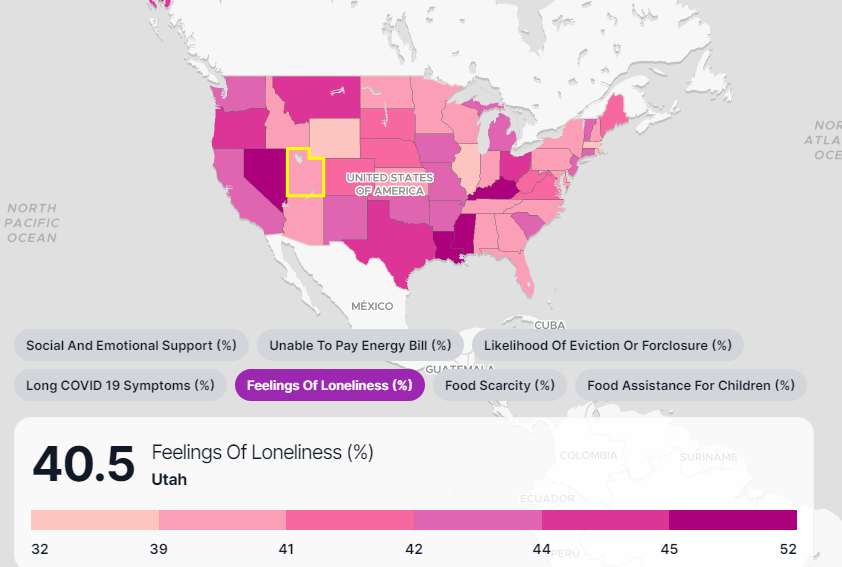
- Feelings of Loneliness: 41.7% of adults reported feeling lonely sometimes, usually, or always (+/- 0.6%)
- Social and Emotional Support: 80.4% adults reported getting social and emotional support they need sometimes, usually, or always (+/- 0.5%).
- Concerned About Price Increases In the Future: 77.7% of adults are somewhat or very concerned that prices will increase in the next six months (+/- 0.4%)
- Difficulty Paying for Usual Household Expenses: 36.0% of adults live in households where it has been somewhat or very difficult to pay for usual household expenses in the last 7 days (+/- 0.6%)
- Impact of Cost of Gas on Driving Behavior: 48.7% of adults changed driving behavior in the last 7 days due to the cost of gas (+/- 0.7%)
- Price Increases for Goods and Services: 81.2% of adults think prices have increased in the area where they live and shop in the last two months (+/- 0.5%)
Margin of error: when added/subtracted from the estimate, it forms the 90% confidence interval for that estimate.
State-level results
This Mapstack map shows state-level results for 7 out of the 13 indicators on housing, food security, health, and social isolation. Click on the map to explore the data on Mapstack.
This Mapstack map shows state-level results for the remaining 6 indicators on spending, inflation and natural disasters. Click on the map to explore the data on Mapstack.

Read more:
- U.S. Census Bureau, Household Pulse Survey