
Global Overview
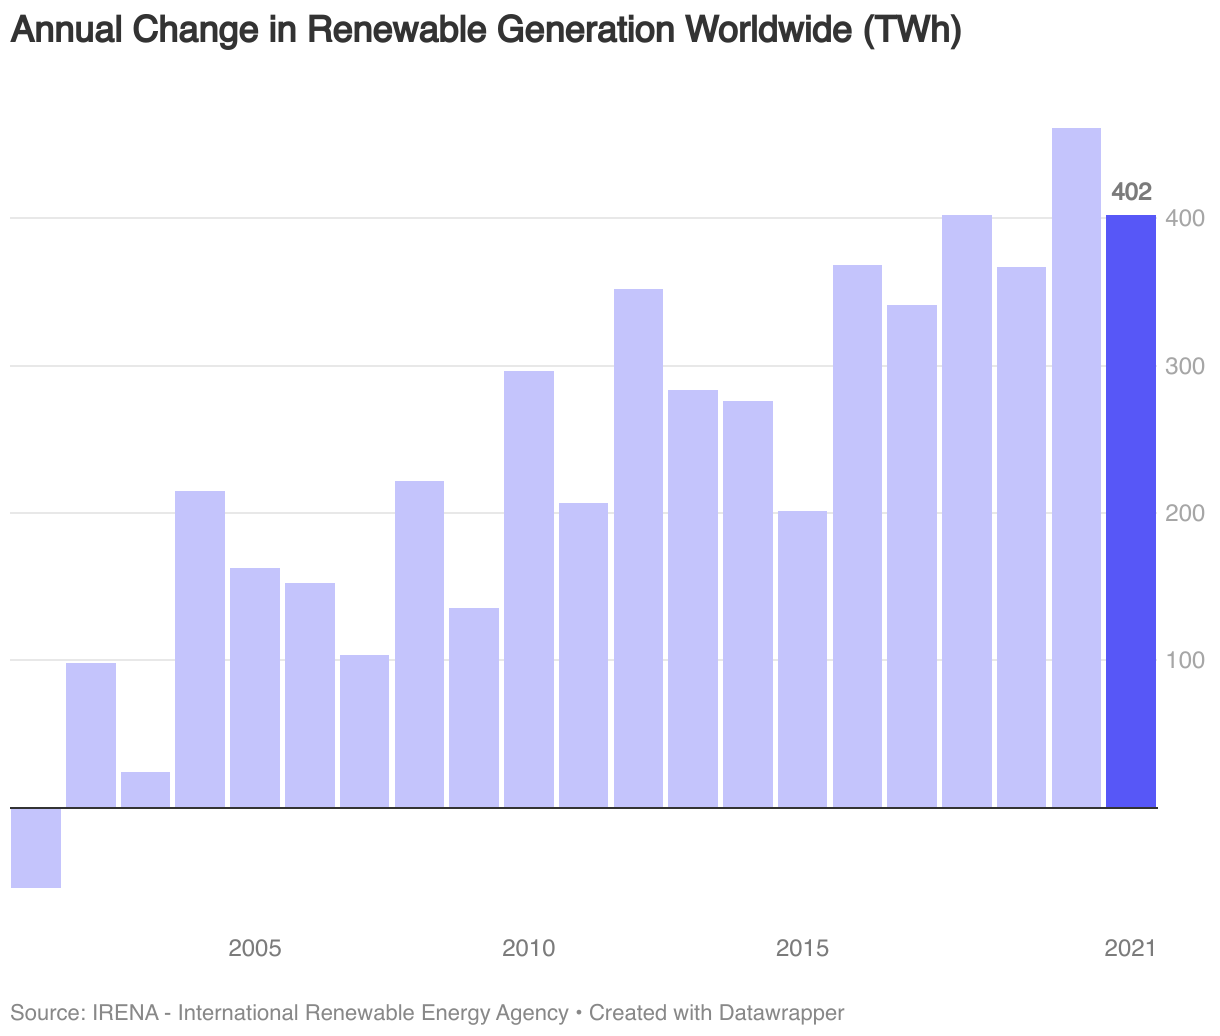
According to data from the International Renewable Energy Agency (IRENA), 2021 was a record year for renewable energy generation. Globally, renewable sources generated 7,858 terrawatt-hours (TWh), an increase of 402 TWh from the previous year. This consistent growth in renewable energy generation showcases the world’s accelerating shift towards cleaner and more sustainable energy alternatives, moving away from traditional fossil fuels.

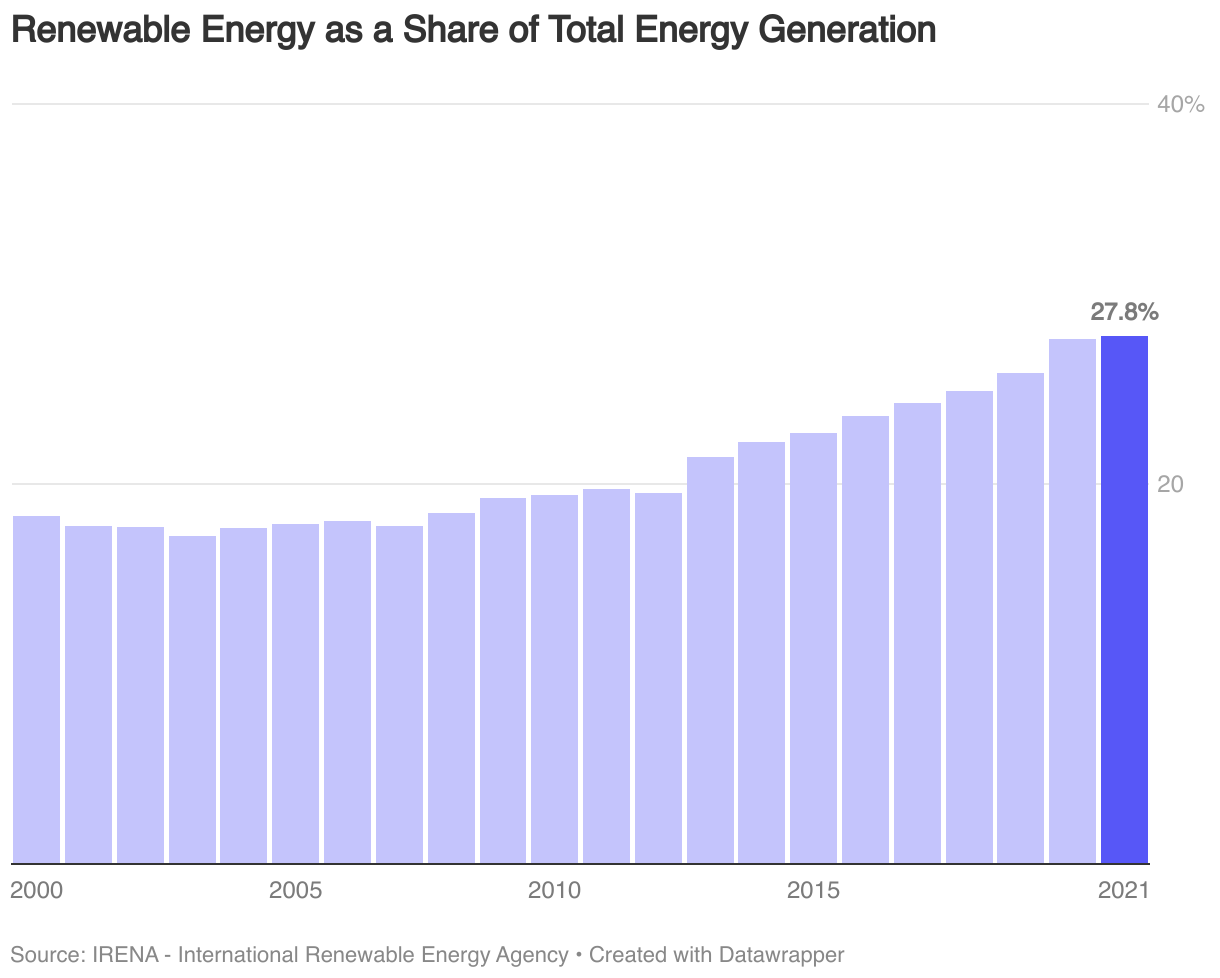
In 2021, renewables constituted 27.8% of global power generation. While this is only a modest increase from 27.7% in 2020, it represents a substantial rise from approximately 20% a decade earlier.
Main Technologies
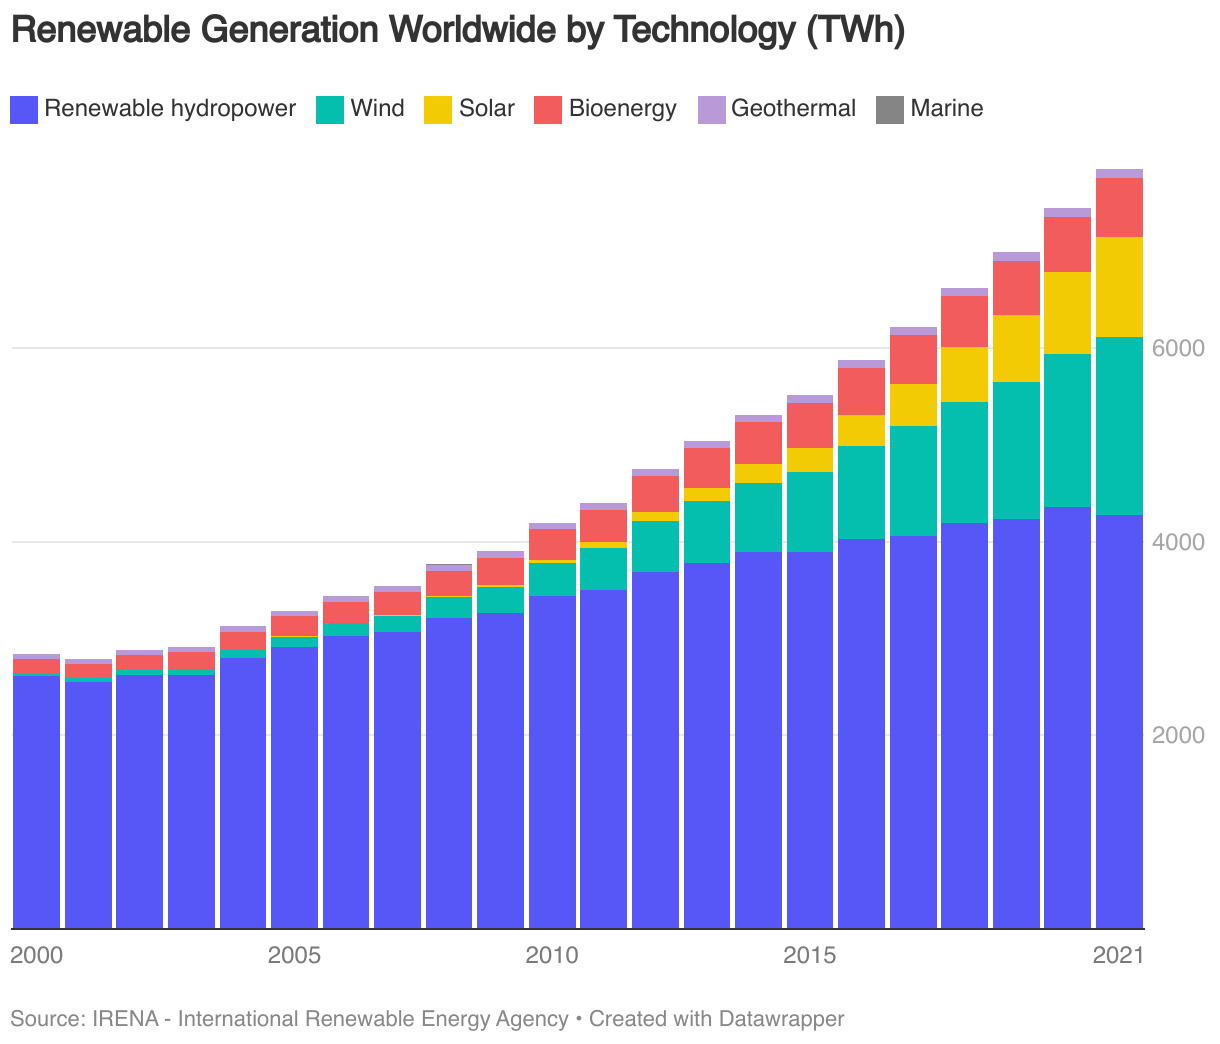
Hydropower has traditionally been the dominant force in renewable energy generation worldwide. However, its preeminence has diminished over the years, with its share declining from 92% in 2000 to 54% in 2021. In contrast, wind and solar technologies have experienced significant growth. The contribution of wind energy leaped from a mere 1% in 2000 to 23.4% in 2021. Similarly, solar energy, which was virtually nonexistent in its contribution in 2000, climbed to 13% by 2021.


Key Nations and Regions
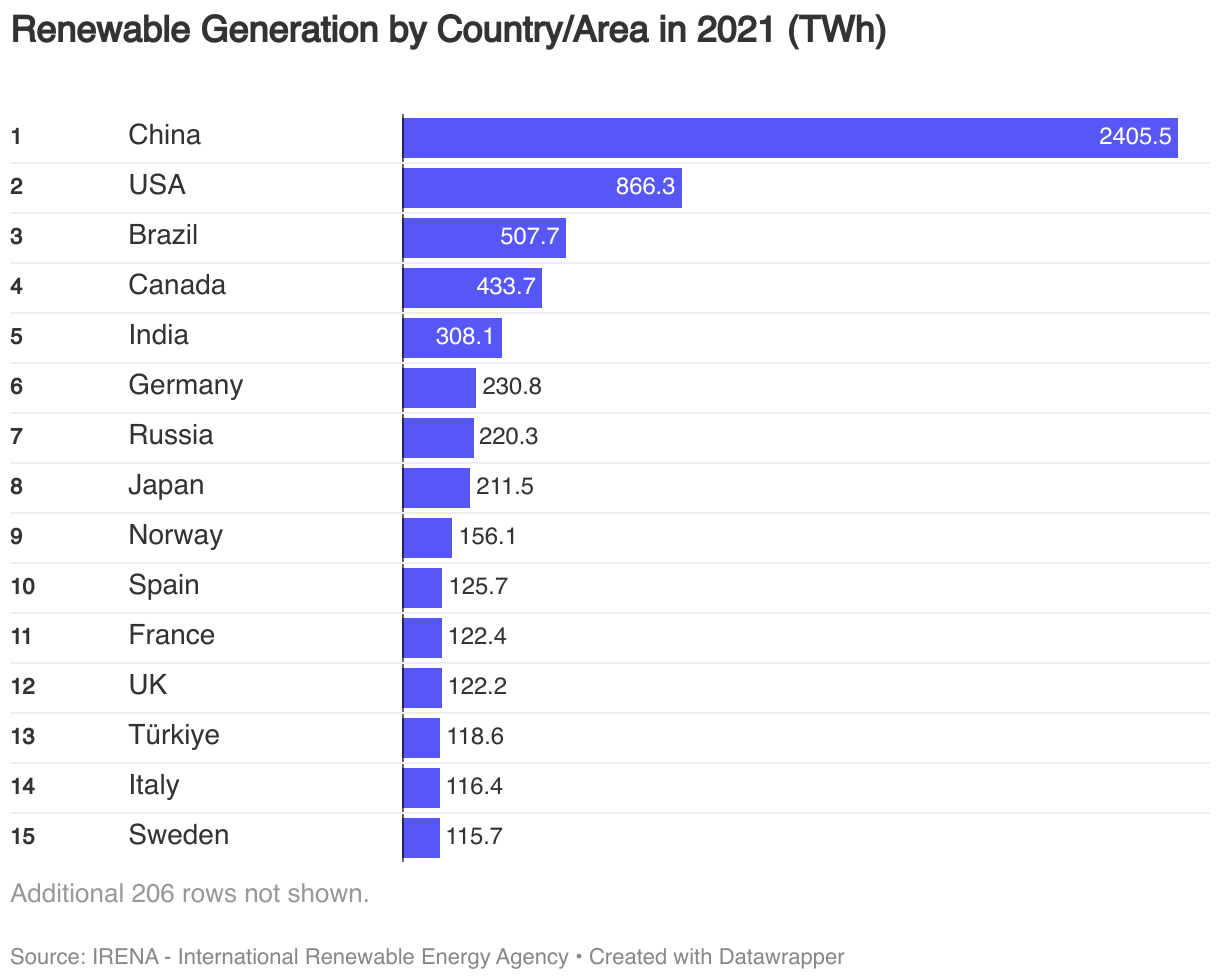
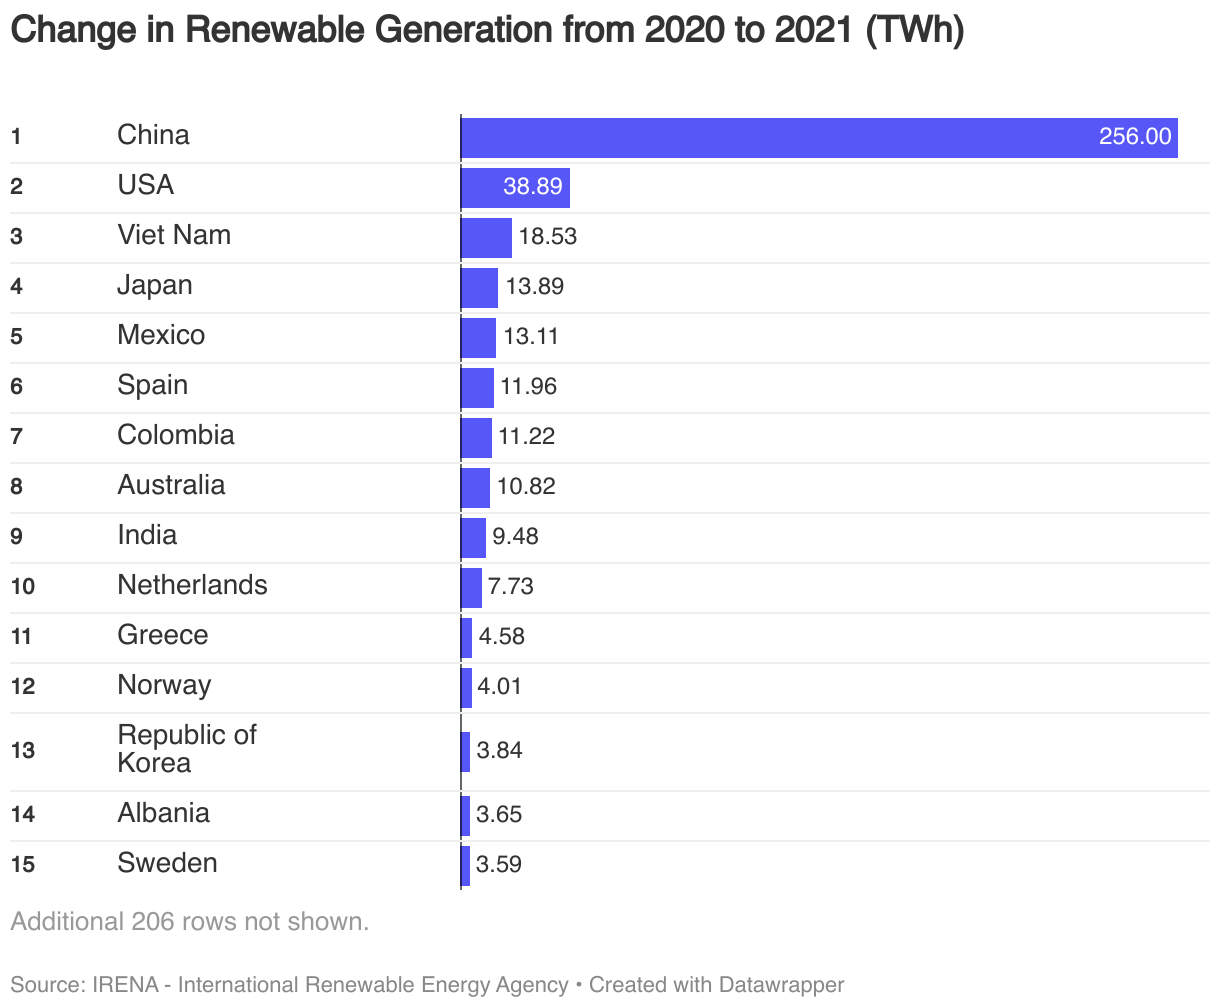
In 2021, the frontrunners in renewable energy generation included China, the USA, Brazil, Canada, and India. Of these, China stood out with the most significant annual growth, generating approximately 256 TWh more than its 2020 figures. On the flip side, several countries such as Germany, Brazil, and the UK experienced a decline in their renewable energy generation during the same timeframe.
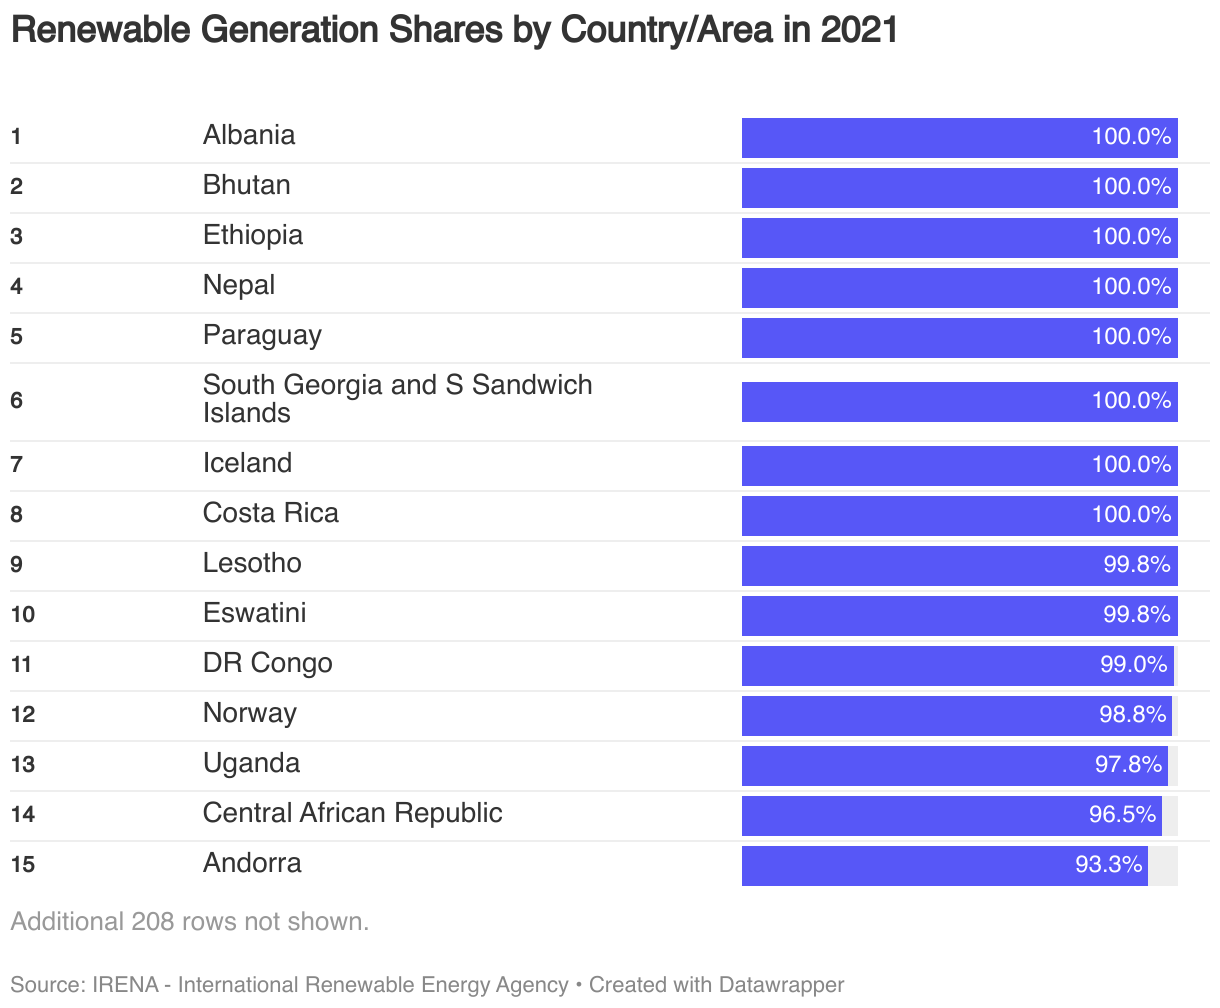
In 2021, 12 countries/areas generated close to 100% (>99%) of their electricity from renewable sources. These included Albania, Bhutan, Ethiopia, Nepal, Paraguay, Iceland, Costa Rica, and Norway.
In 2021, Asia led in renewable energy generation, producing approximately 3,418 TWh or 44% of the global total. Europe generated an estimated 1,468 TWh (19%), while North America contributed about 1,382 TWh, accounting for 18% of the global share. This pattern contrasts sharply with 2000 when North America was the major contributor, with Europe and Asia following.
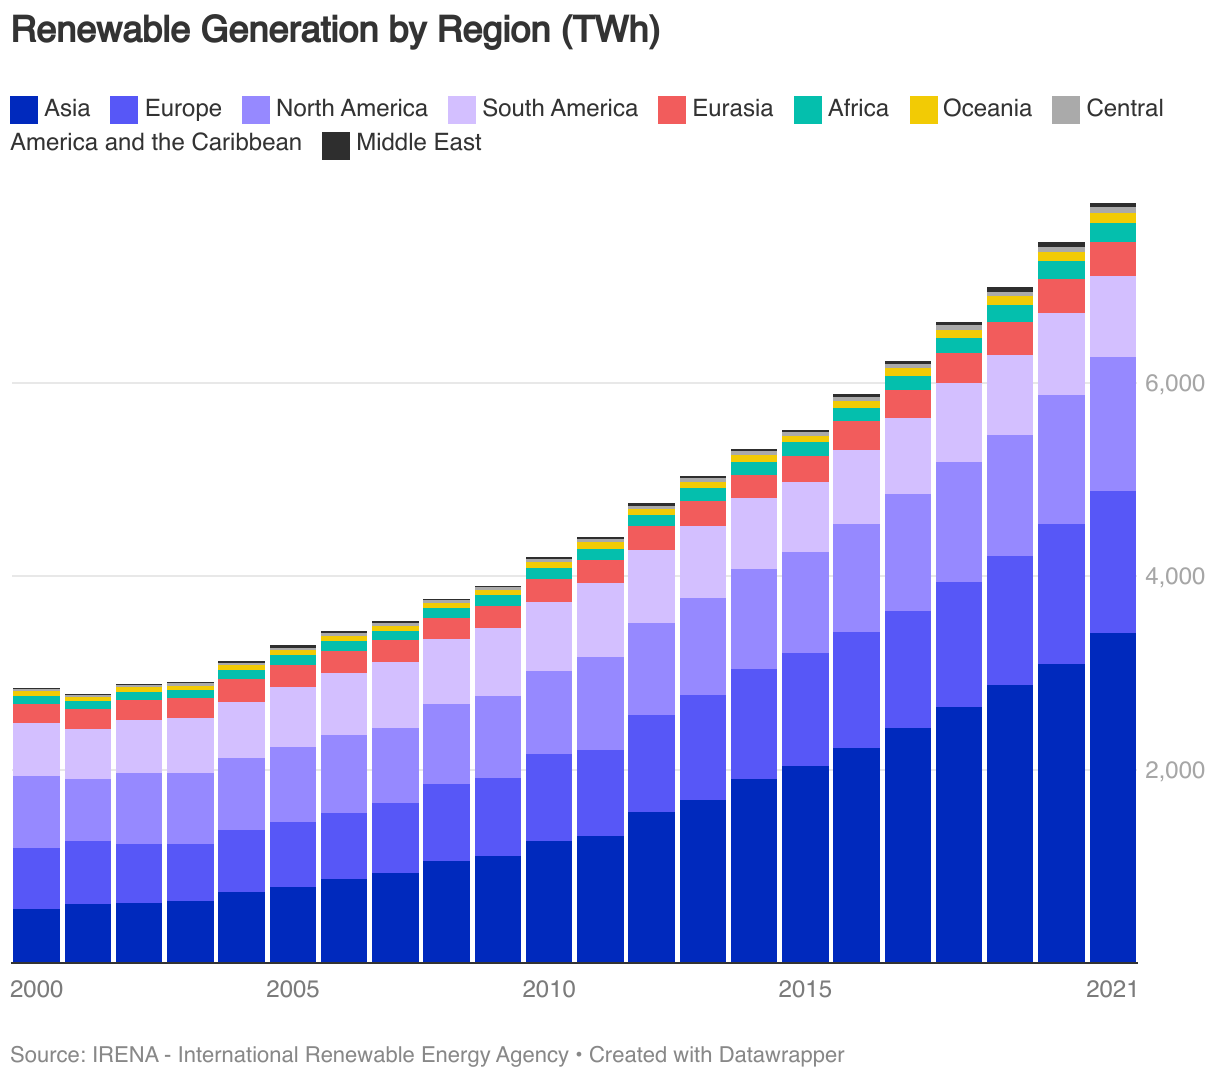
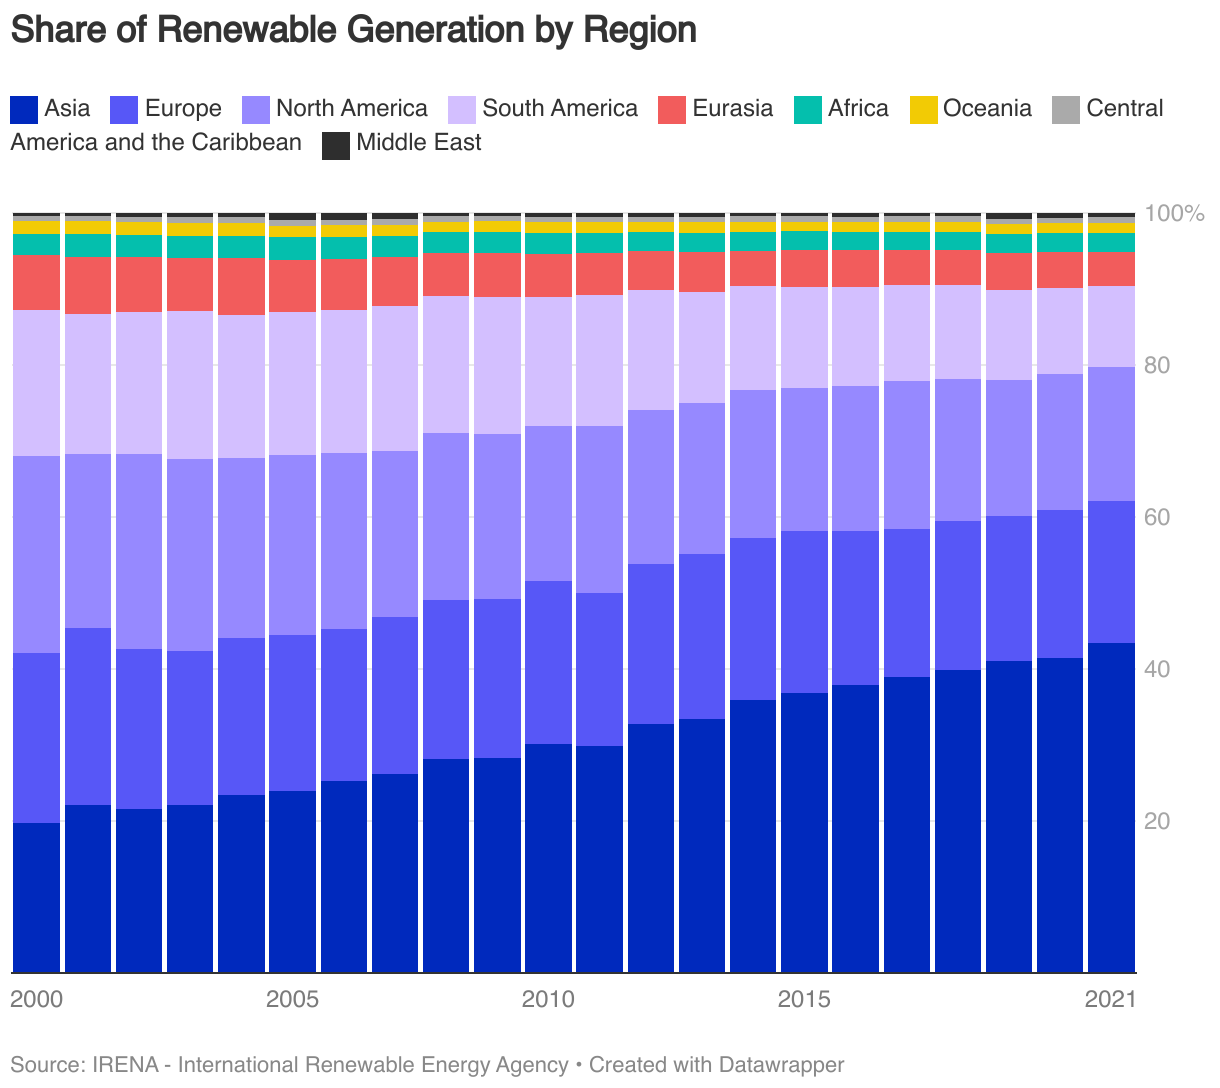
Although Asia leads in absolute terms of renewable energy generation, South America is noteworthy for its reliance on renewables as a proportion of its total energy mix. In 2021, South America sourced approximately 69% of its electricity from renewable sources. Europe was next with a significant 39%, while Central America and the Caribbean trailed closely at 38%. Conversely, renewables constituted only about a quarter of Asia’s total electricity generation.

Renewable Hydropower
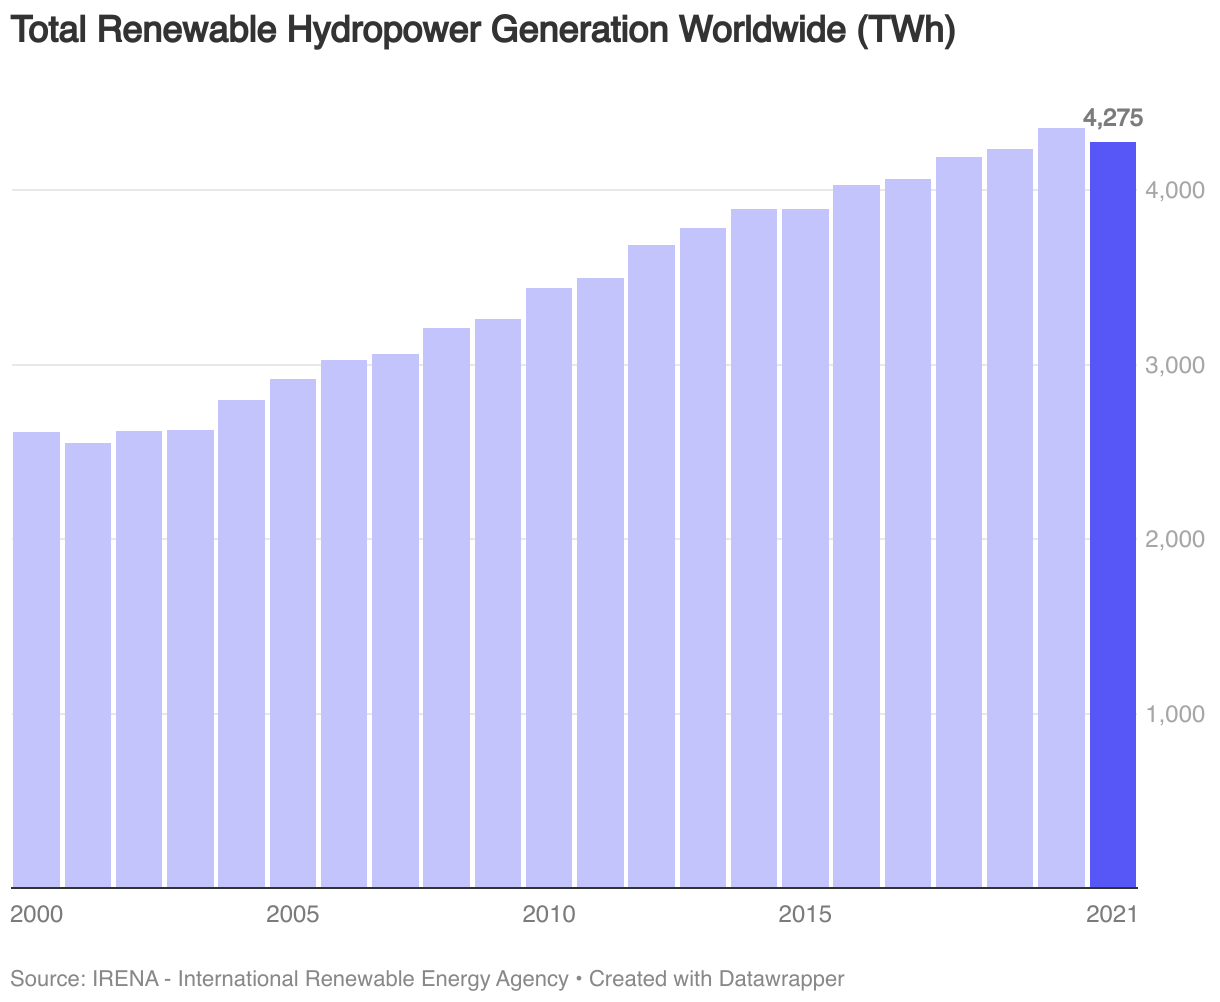
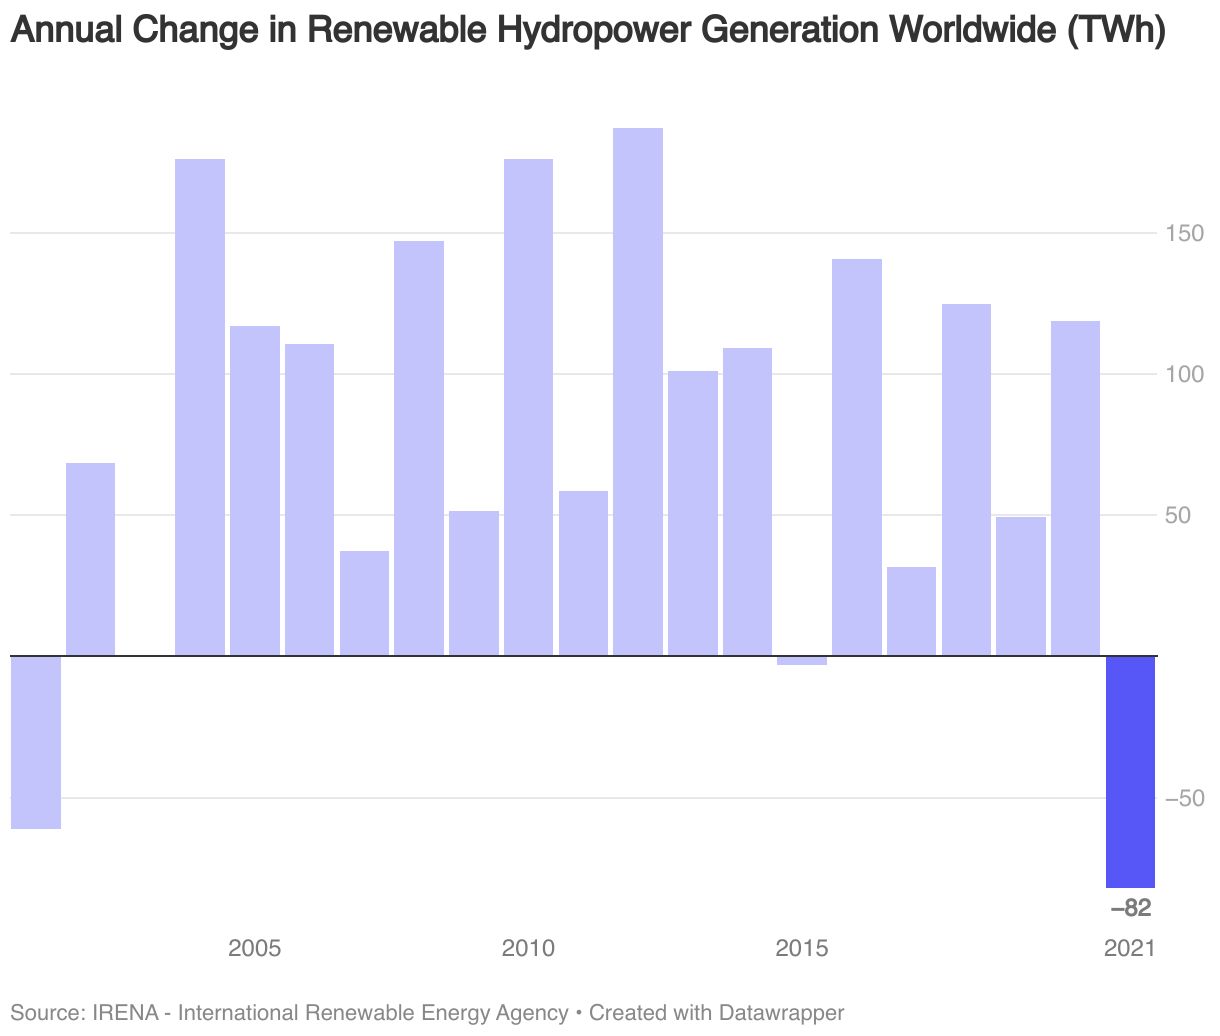
In 2021, renewable hydropower generation reached approximately 4,275 TWh, the second highest year on record, yet a decrease of 82 TWh from the year before.
Key Nations and Regions
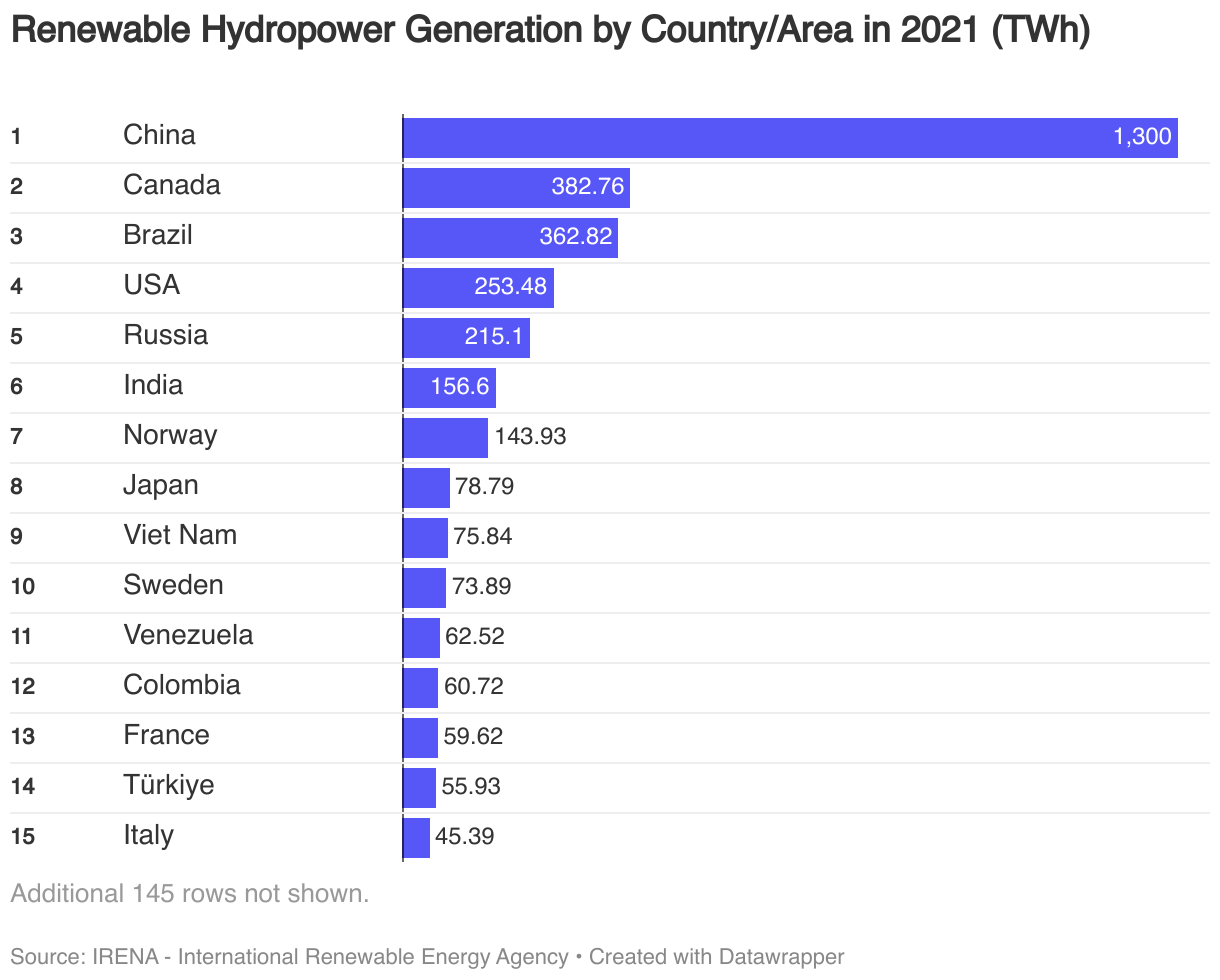
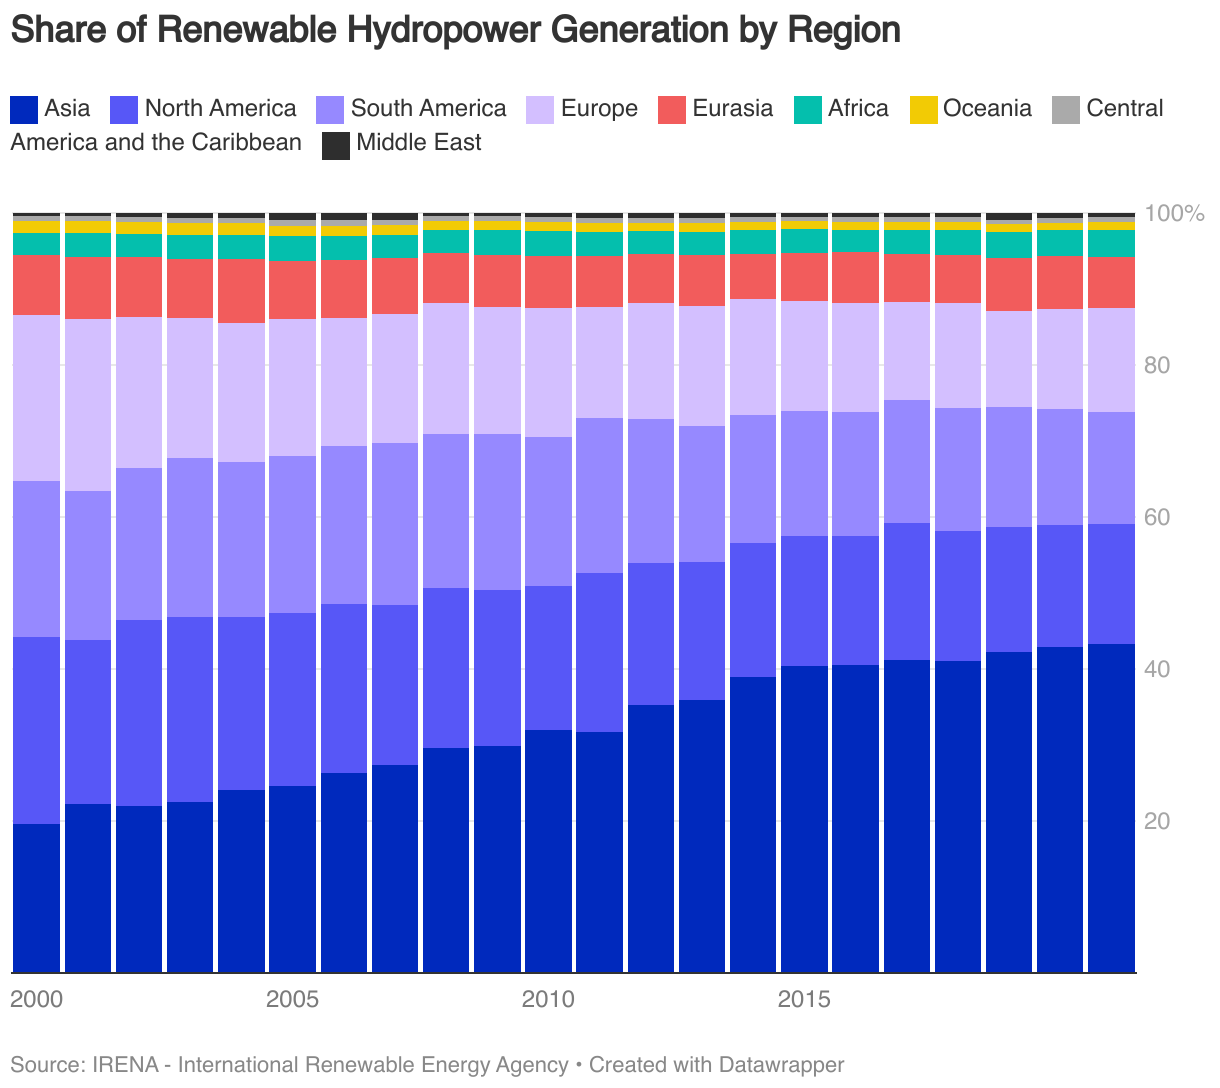
In 2021, China generated 1,300 TWh from renewable hydropower, significantly outpacing other nations. Canada, Brazil, the United States, Russia, India, and Norway each contributed over 100 TWh. The decrease in renewable hydropower generation from 2020 to 2021 can primarily be attributed to reductions in the United States, Brazil, Türkiye, and China.

On a regional scale, Asia dominated in 2021, generating roughly 1,856 TWh, which accounted for 43% of global renewable hydropower generation. Over the past decades, Asia has steadily increased its share of renewable hydropower generation.

Solar Energy
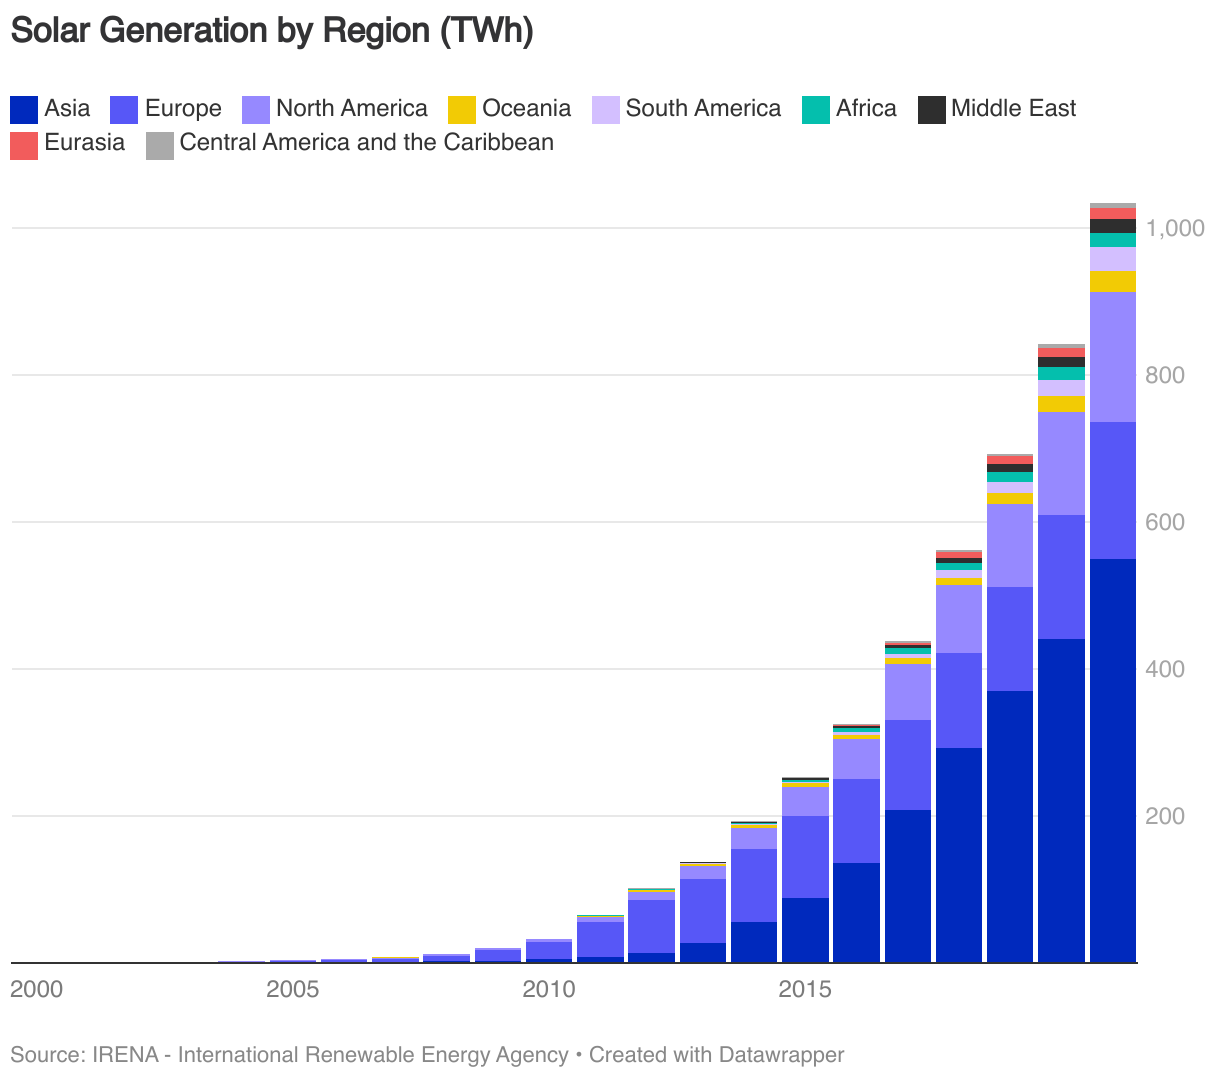
In 2021, solar energy generated approximately 1,034 TWh, a new record year for solar generation, and 192 TWh more than in 2020. Over the past two decades solar generation has seen a very strong growth. For comparison, solar energy generated just above 4 TWh in 2005 and 34 TWh in 2010.


Key Nations and Regions
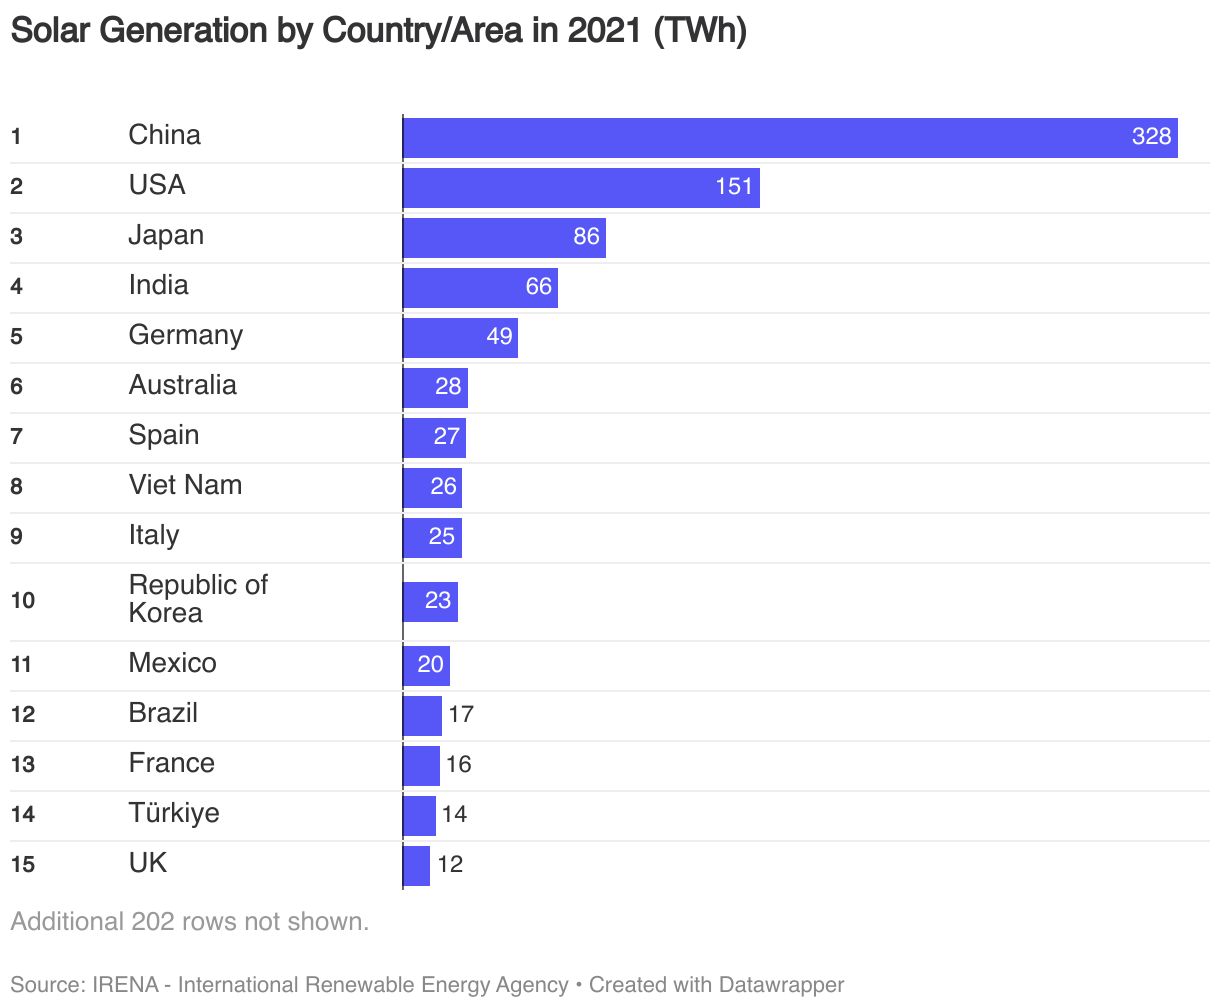
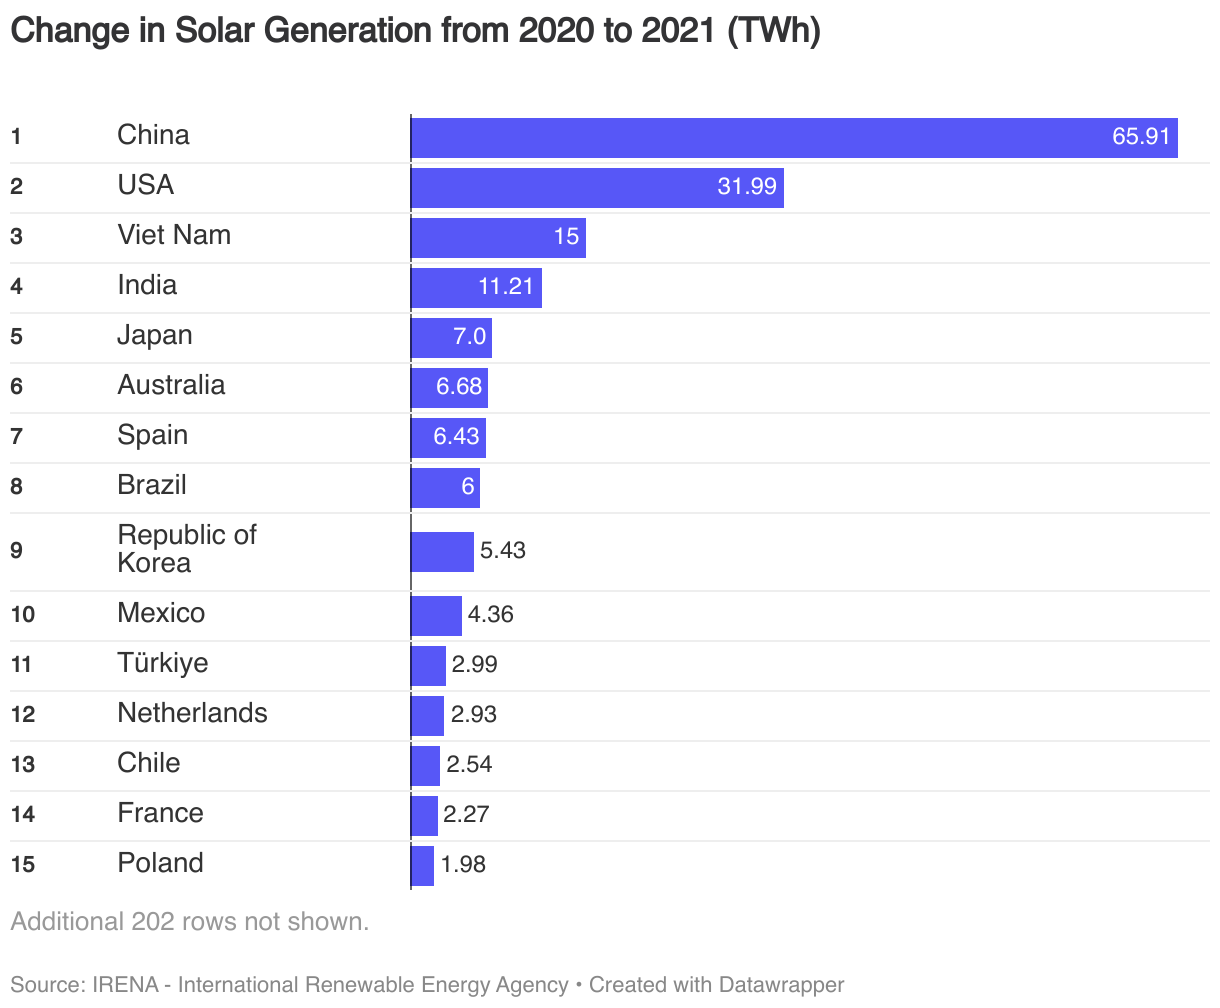
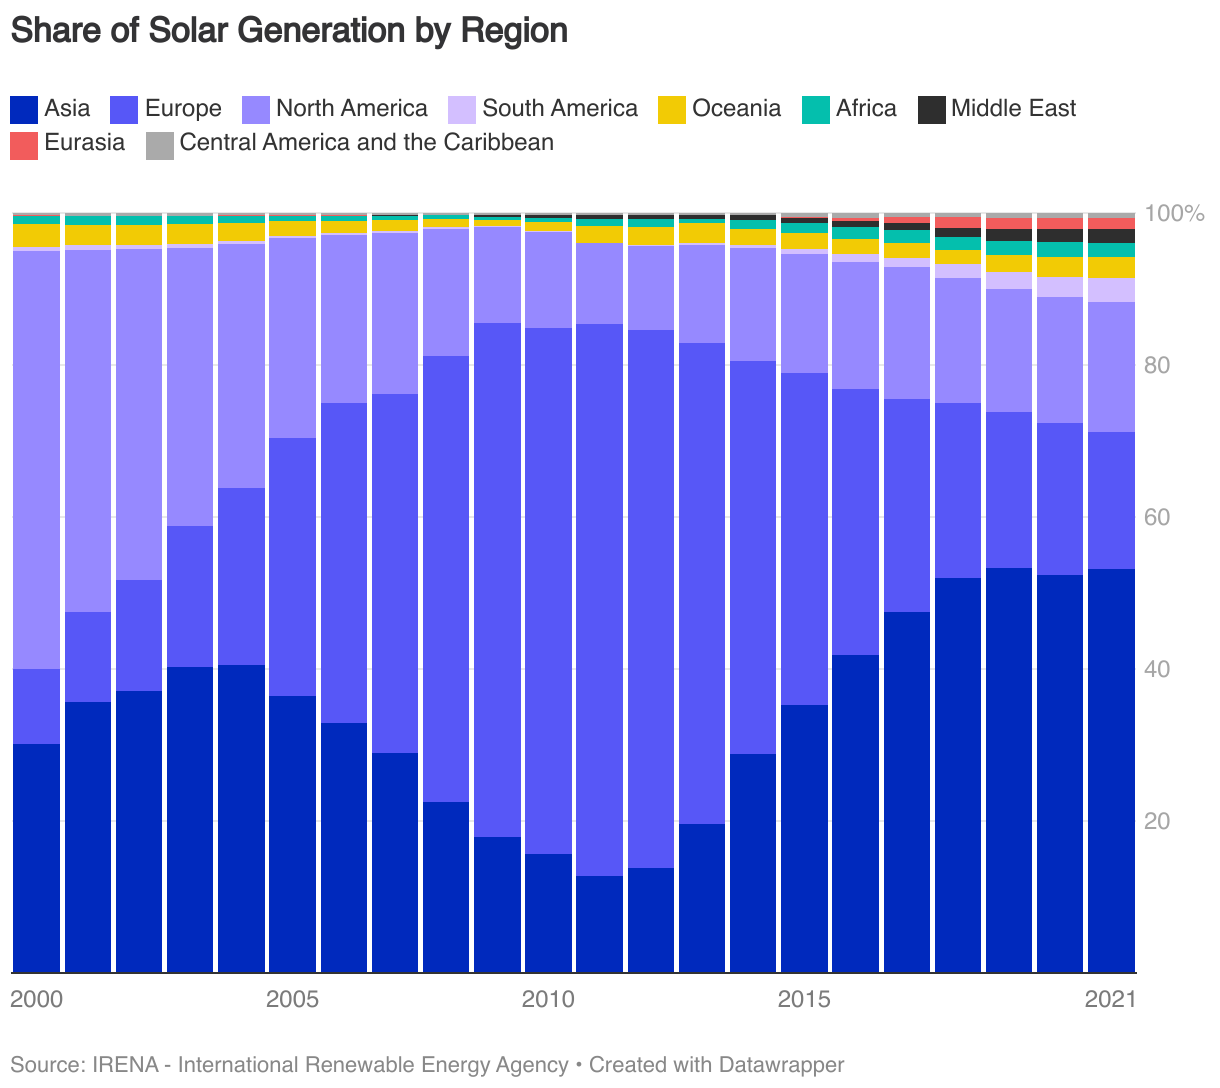
China, the United States, Japan, India, and Germany were the top contributors to global solar electricity generation in 2021. China stood out, generating nearly 328 TWh, which equates to almost one-third of worldwide solar production. While the annual growth in solar generation was highest in China and the United States, Vietnam’s growth is noteworthy, having boosted its generation by 15 TWh compared to 2020, marking the third-largest increase globally.
In 2021, Asia produced the most solar energy, with its 550 TWh accounting for roughly half of the global output. Meanwhile, Europe’s contribution has seen a notable decline over recent years as Asia’s generation has expanded.
Wind Energy
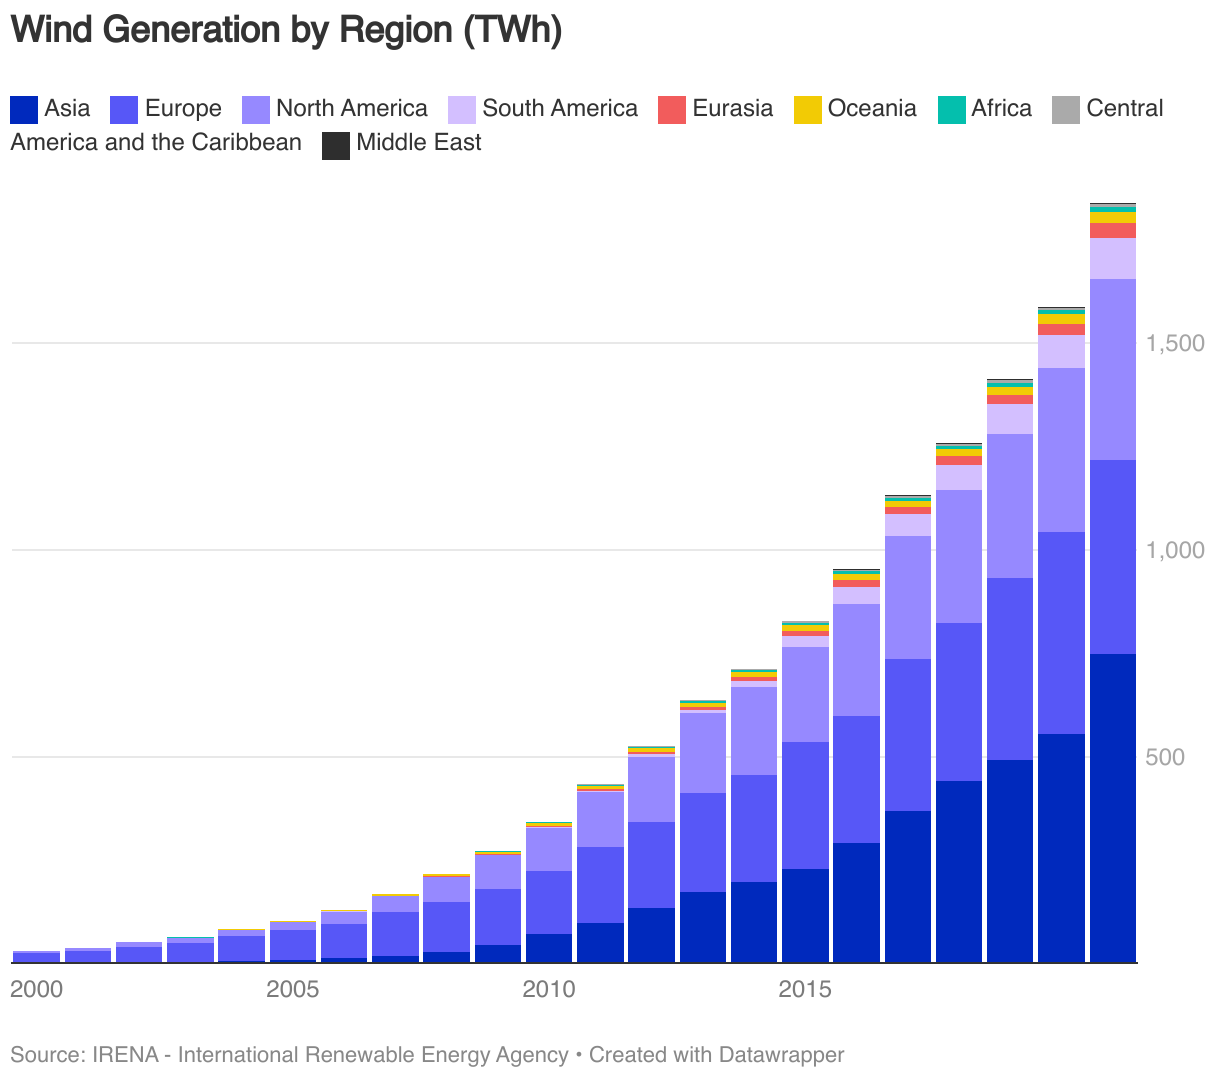
Over the past two decades, wind energy has seen robust growth. In 2021, electricity generation from wind amounted to approximately 1,838 TWh, marking an increase of 250 TWh (16%) compared to 2020.


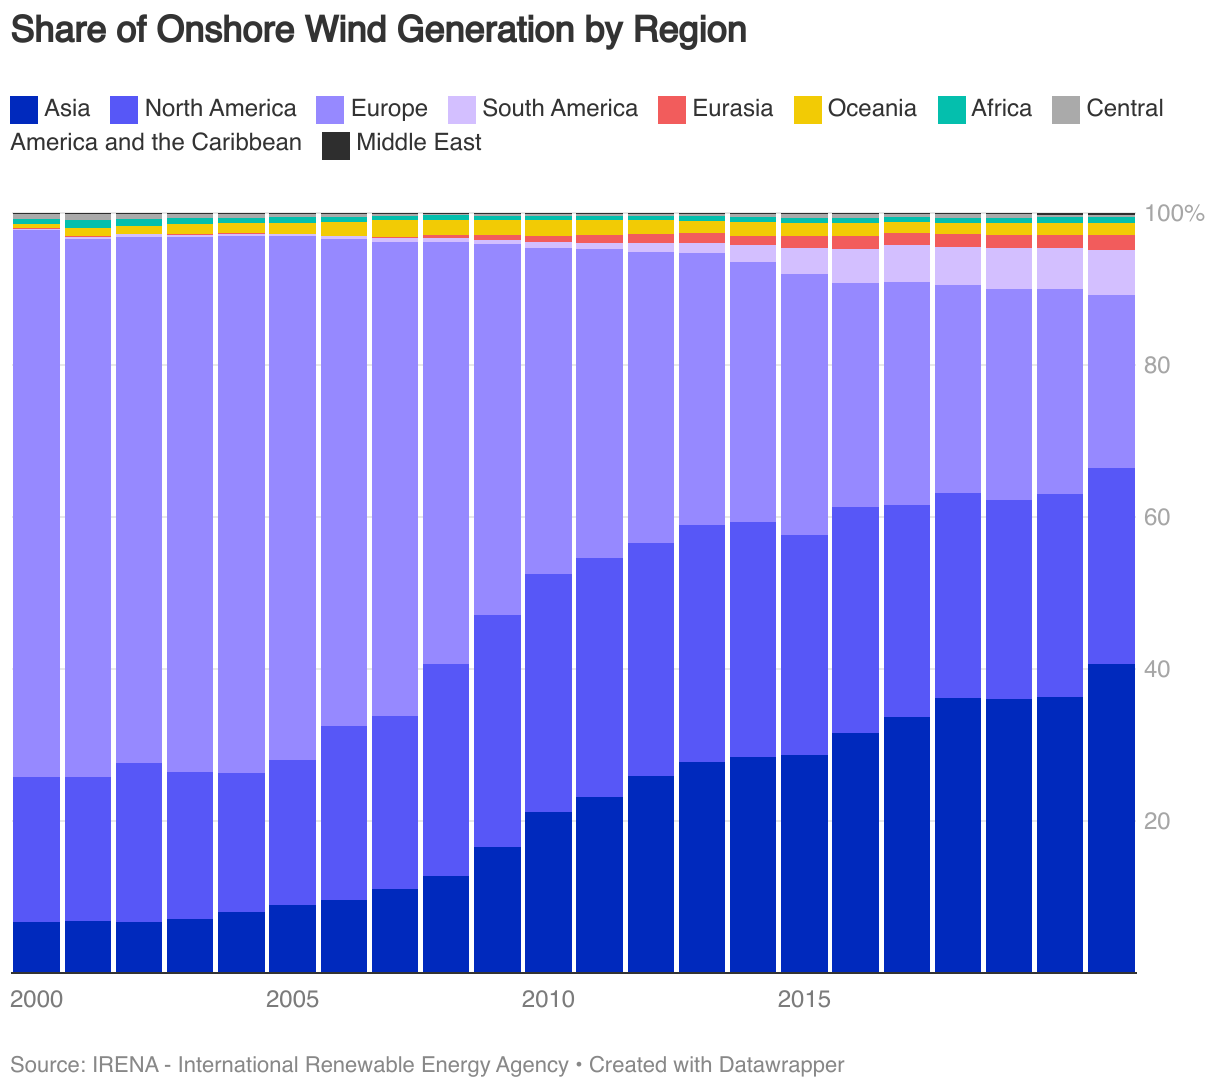
Onshore vs Offshore
While offshore wind is gaining traction, onshore wind remains the dominant contributor to wind energy generation, accounting for over 1,700 TWh of the 1,838 TWh generated in 2021.


Key Nations and Regions
In 2021, China was the largest contributor to global wind energy generation, with the United States, Germany, Brazil, India, and Spain also making significant contributions. For offshore wind, China, the UK, Germany, the Netherlands, Denmark, and Belgium were notable contributors. China also saw the largest increase in TWh from 2020 to 2021, the majority of which was onshore generated.


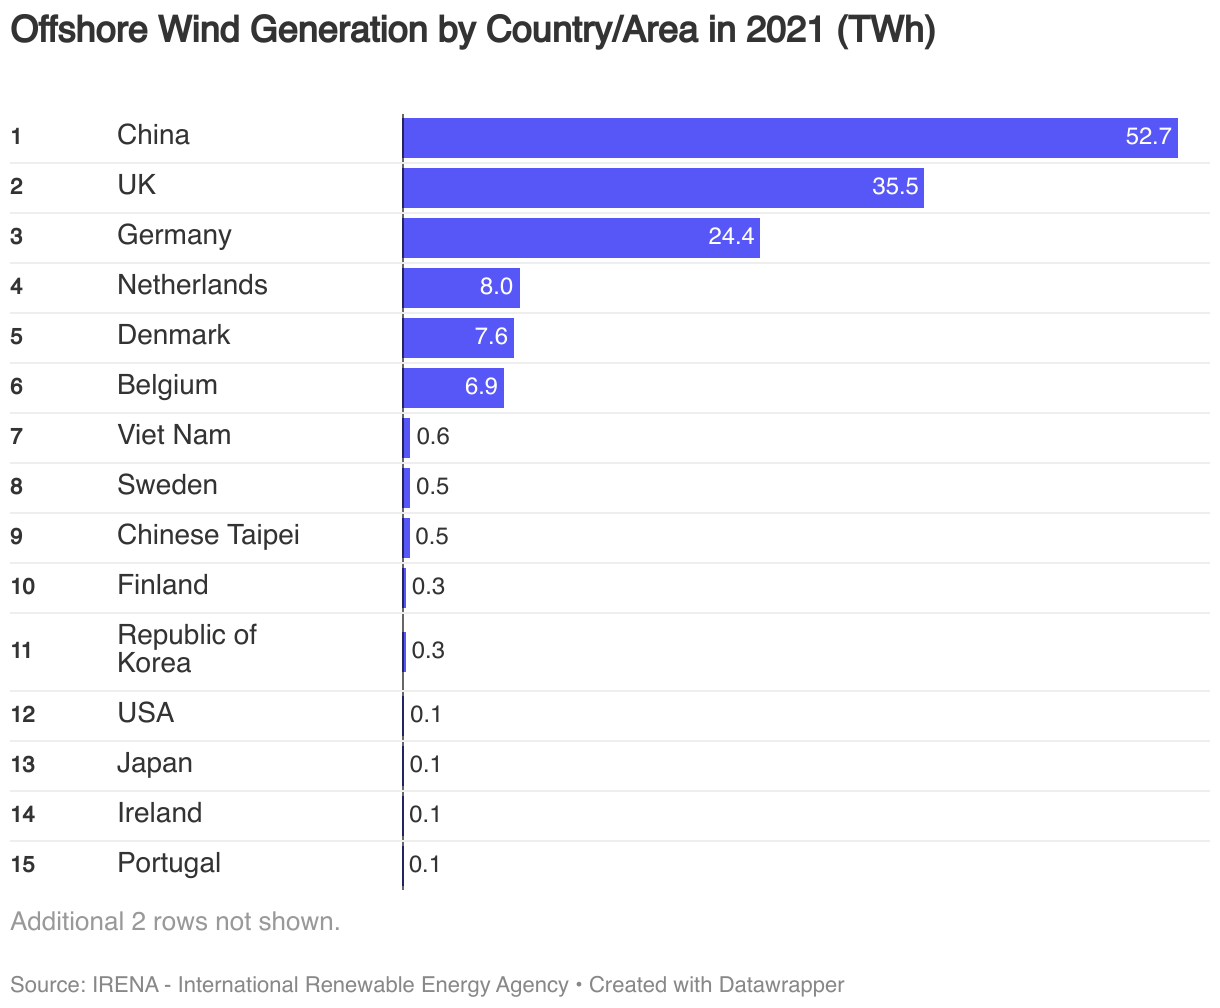
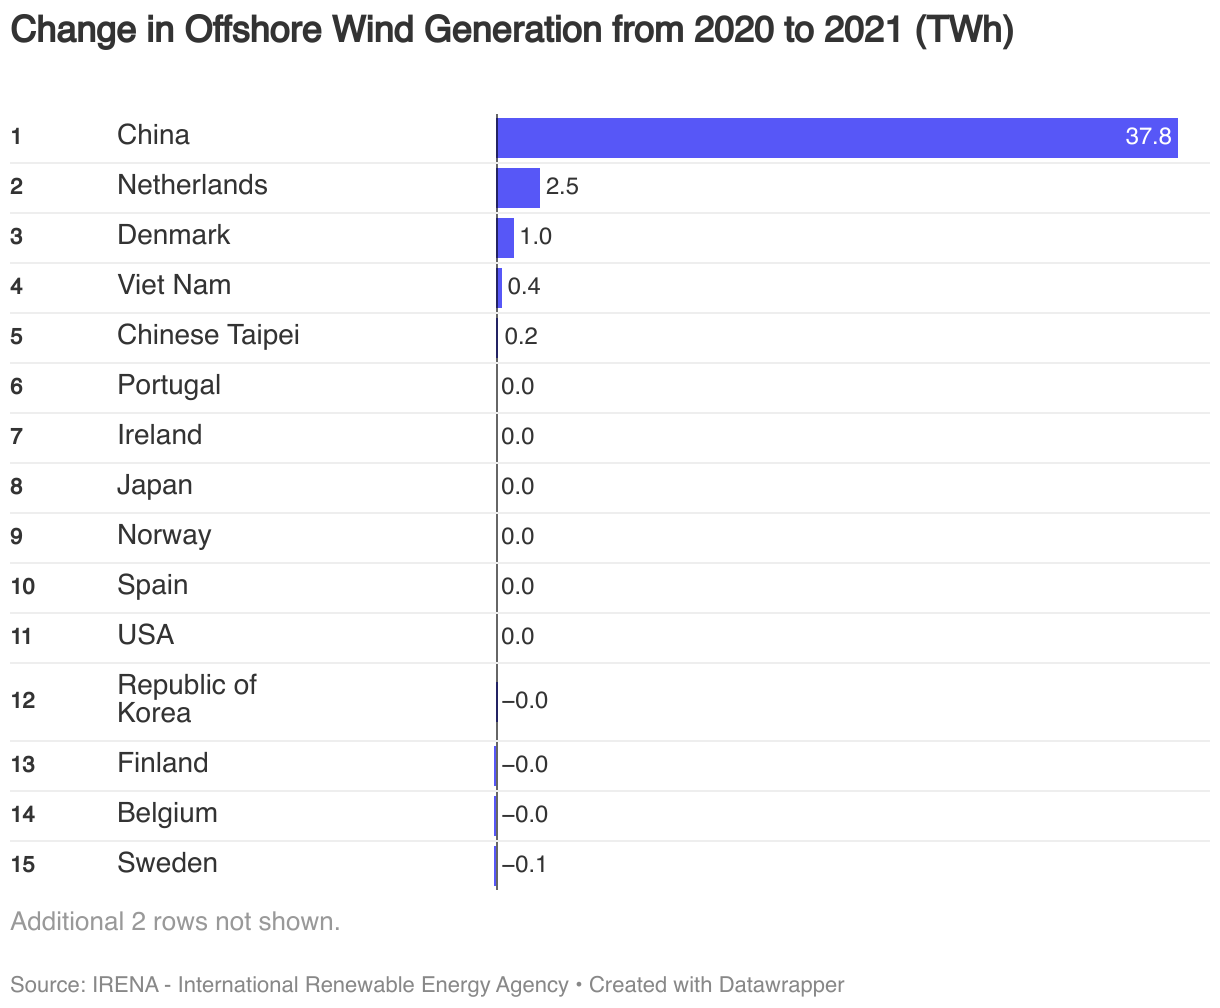
Asia, Europe, and North America stand out as the leading regions for wind energy generation. For offshore wind, Europe takes the lead, accounting for over 60% of global offshore wind generation in 2021. However, Asia is making significant strides, increasing its share from 15% in 2020 to 39% in 2021.


Bioenergy
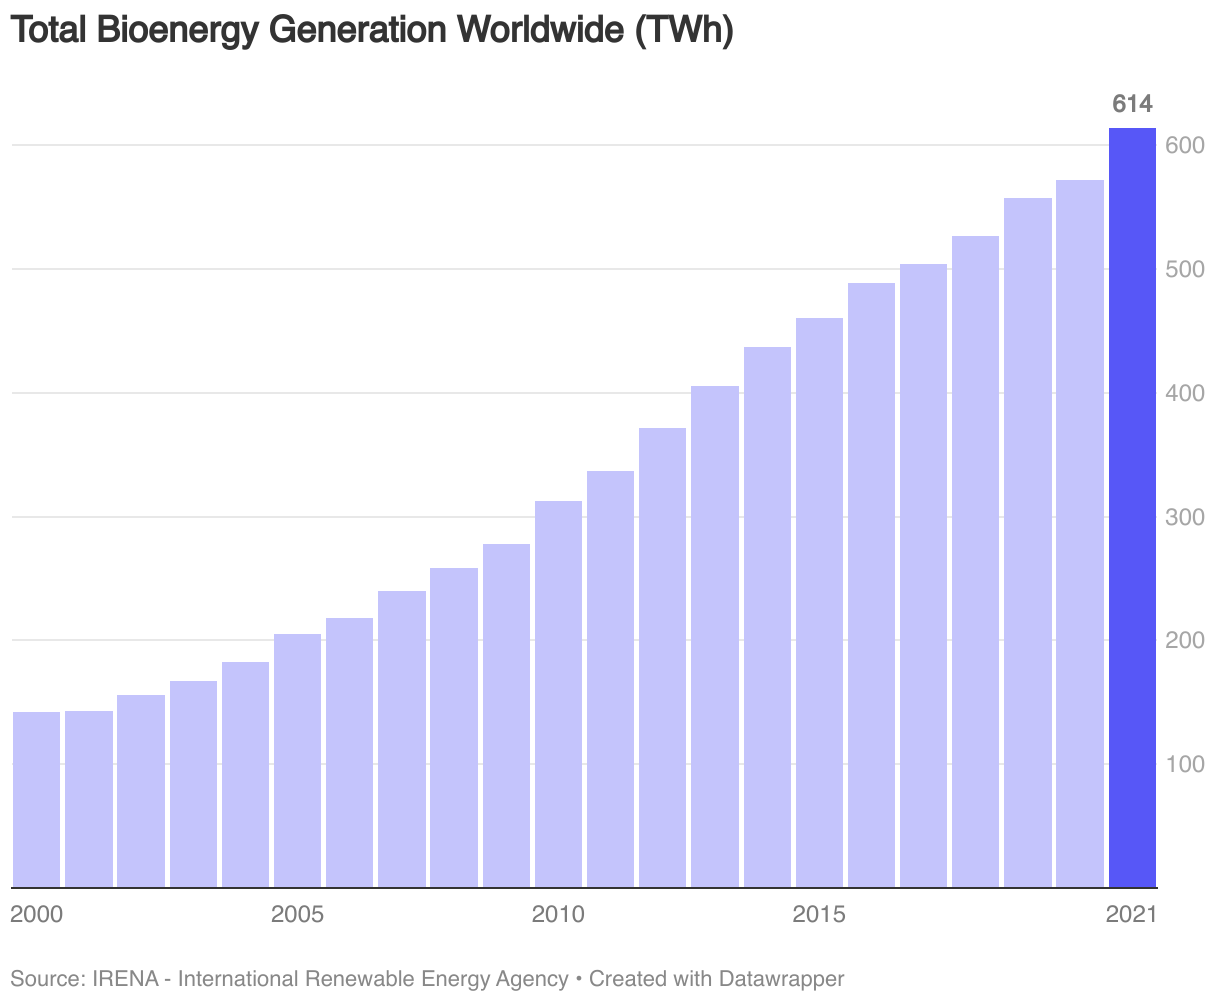
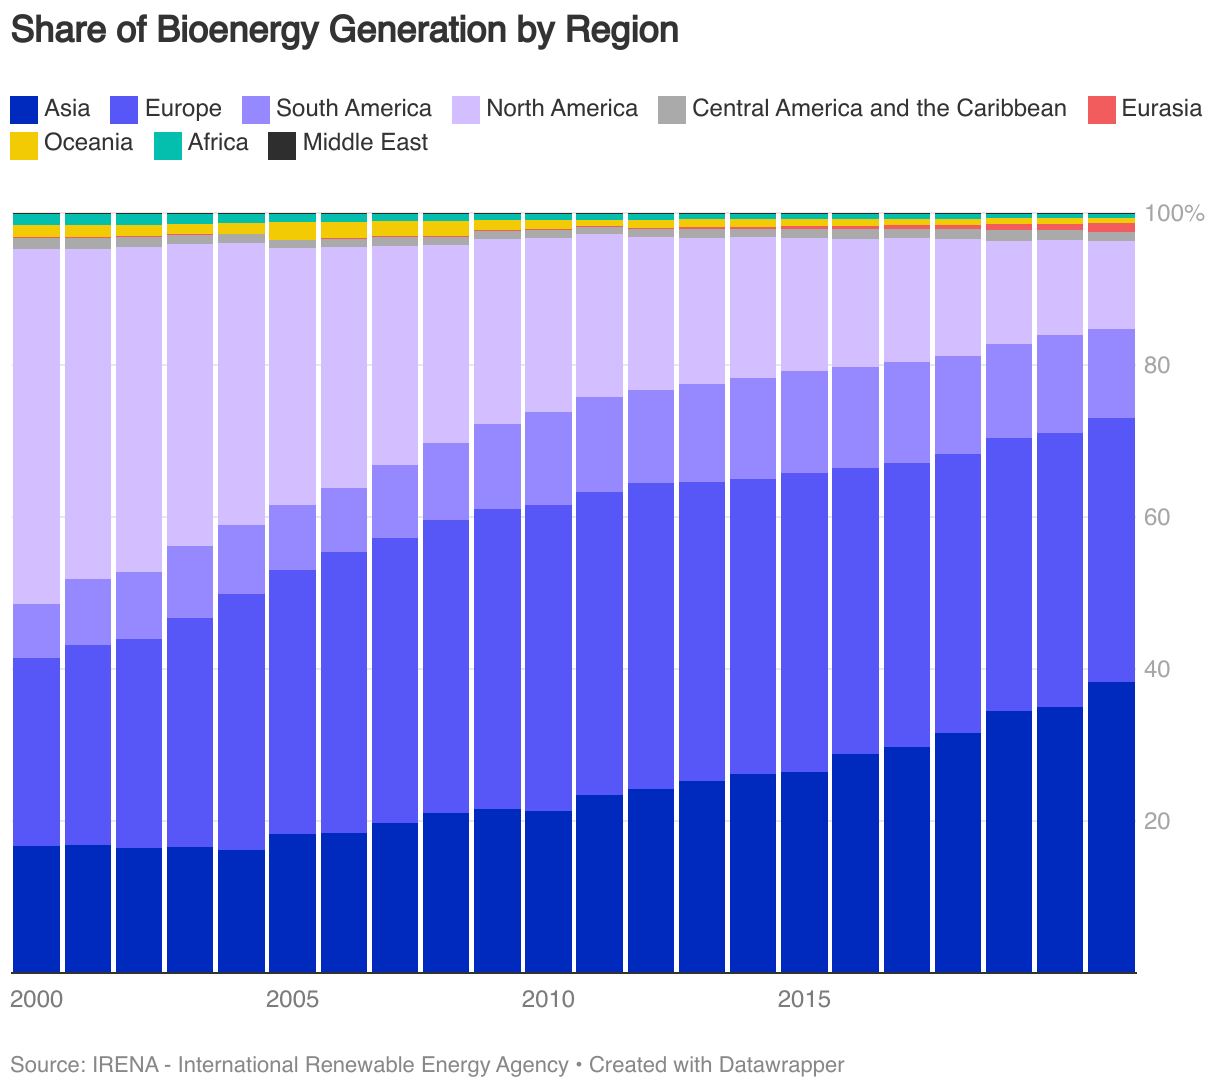
In 2021, global bioenergy generation reached approximately 614 TWh, setting a new record high with an increase of 42 TWh from 2020.

Key Nations and Regions
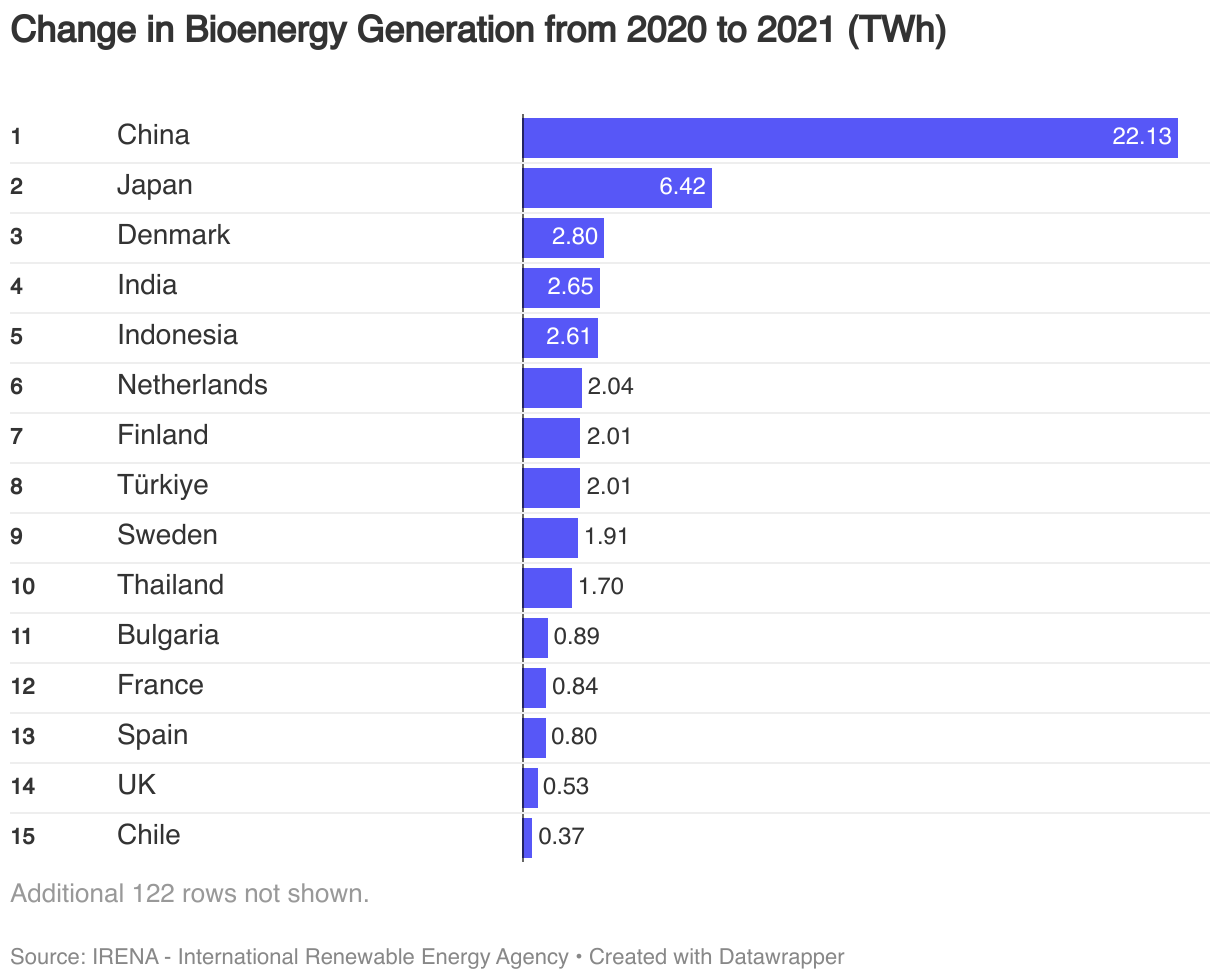
China was the largest generator of bioenergy worldwide in 2021, followed by the United States, Brazil, Germany and the UK. China alone increased its generation by over 22 TWh from 2020 to 2021, about half of the annual growth worldwide.

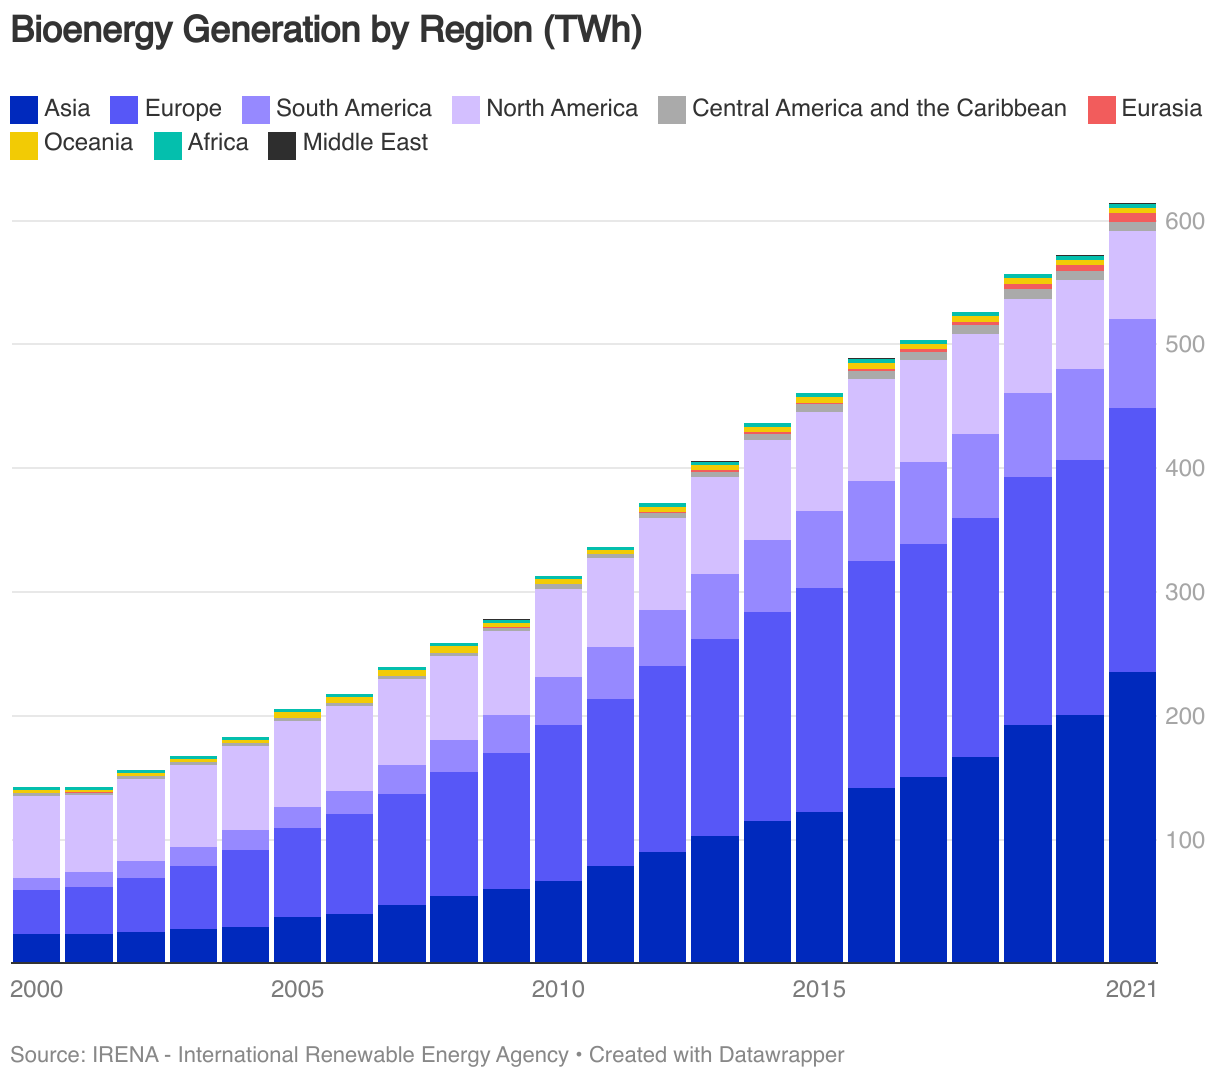
Regionally, Asia and Europe are the largest contributors to bioenergy generation, making up almost 450 TWh combined (73% of global generation). In 2021, Asia overtook Europe as the largest regional contributor.
Geothermal Energy
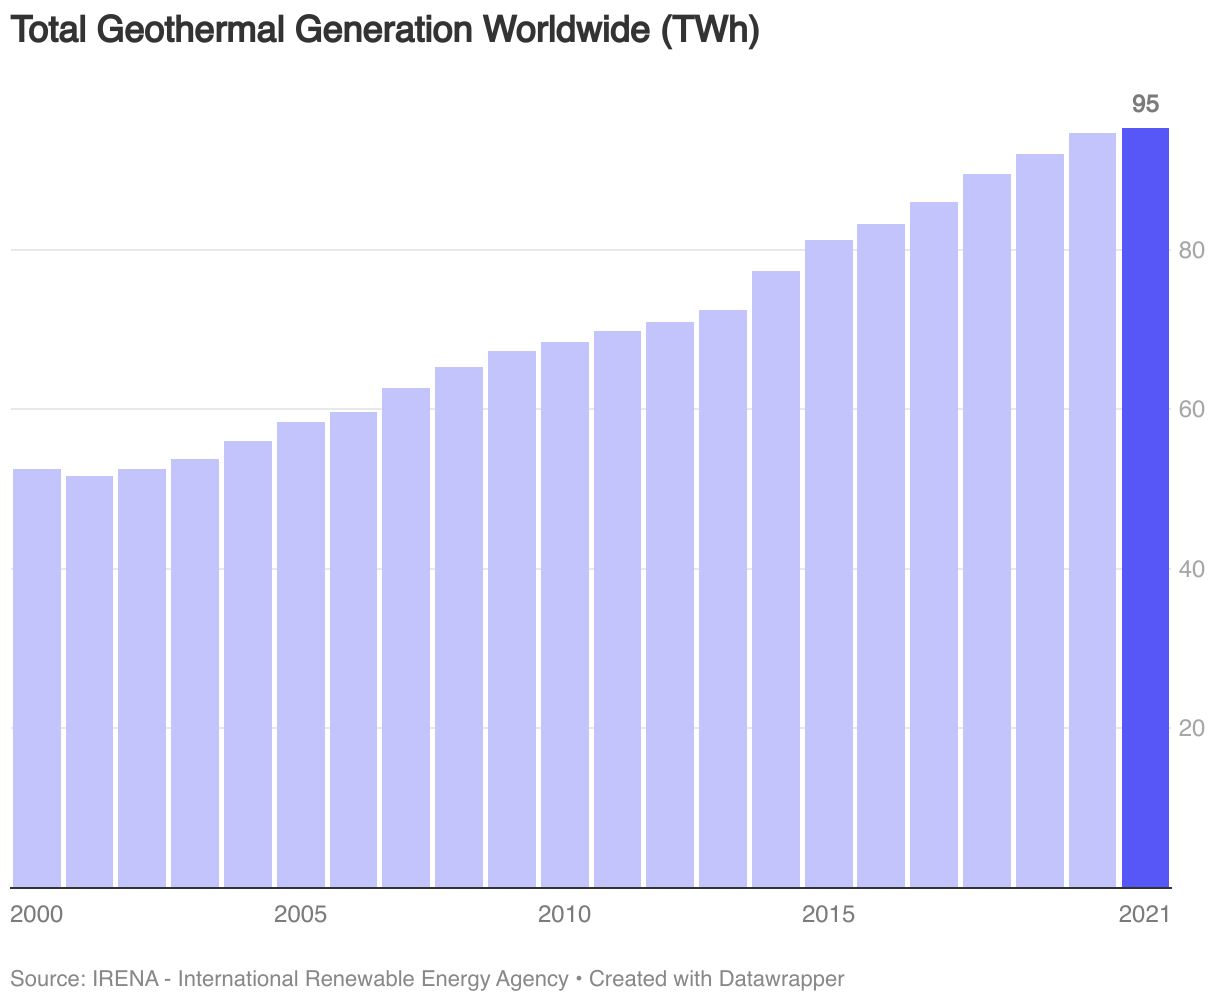
In 2021, global geothermal energy generation reached approximately 95 TWh, marking an increase of 0.61 TWh from 2020. Notably, this was the smallest annual growth in geothermal energy since 2001.

Key Nations and Regions
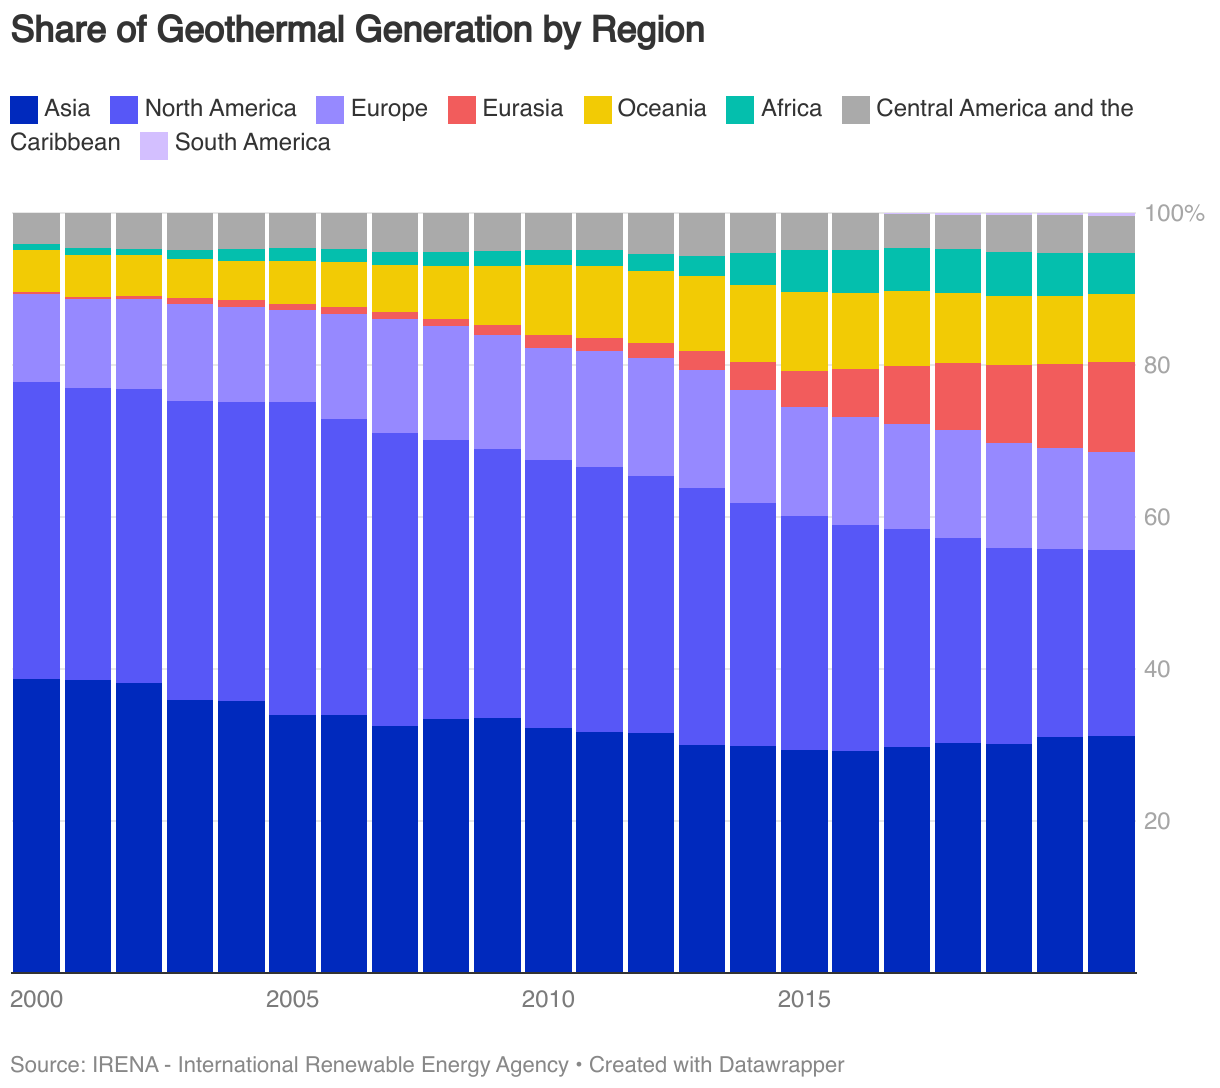
In 2021, the United States was the largest generator of geothermal energy, producing around 19 TWh. Indonesia, Türkiye, and the Philippines followed closely in contributions. Notably, Türkiye recorded the most significant annual growth in geothermal power generation from 2020 to 2021.


In geothermal energy generation, Asia and North America are the primary contributors, accounting for more than half of global output. However, in recent times, their combined share has seen a slight decline, primarily due to the emerging significance of Eurasia and Africa in this sector.

About the data
The data presented on this page is sourced from IRENA – International Renewable Energy Agency, IRENA Renewable Energy Statistics database. Data is copyright © IRENA 2023.
Renewable electrical generation statistics are released by IRENA annually.
Regional Groupings
Data from IRENA on renewable capacity is based on the following regional groupings:
Asia: Afghanistan, Bangladesh, Bhutan, Brunei Darussalam, Cambodia, People’s Republic of China, Democratic People’s Republic of Korea, India, Indonesia, Japan, Kazakhstan, Kyrgyzstan, Lao People’s Democratic Republic, Malaysia, Maldives, Mongolia, Myanmar, Nepal, Pakistan, Philippines, Republic of Korea, Singapore, Sri Lanka, Tajikistan, Thailand, Timor-Leste, Turkmenistan, Uzbekistan, Viet Nam.
Africa: Algeria, Angola, Benin, Botswana, Burkina Faso, Burundi, Cabo Verde, Cameroon, Central African Republic, Chad, Comoros, Congo, Côte d’Ivoire, Democratic Republic of the Congo, Djibouti, Egypt, Equatorial Guinea, Eritrea, Ethiopia, Eswatini, Gabon, Gambia, Ghana, Guinea, Guinea- Bissau, Kenya, Lesotho, Liberia, Libya, Madagascar, Malawi, Mali, Mauritania, Mauritius, Morocco, Mozambique, Namibia, Niger, Nigeria, Rwanda, Sao Tome and Principe, Senegal, Seychelles, Sierra Leone, Somalia, South Africa, South Sudan, Sudan, Togo, Tunisia, Uganda, United Republic of Tanzania, Zambia, Zimbabwe.
Central America and the Caribbean: Antigua and Barbuda, Bahamas, Barbados, Belize, Costa Rica, Cuba, Dominica, Dominican Republic, El Salvador, Grenada, Guatemala, Haiti, Honduras, Jamaica, Nicaragua, Panama, Saint Kitts and Nevis, Saint Lucia, Saint Vincent and the Grenadines, Trinidad and Tobago.
Eurasia: Armenia, Azerbaijan, Georgia, Russian Federation, Türkiye.
Europe: Albania, Andorra, Austria, Belarus, Belgium, Bosnia and Herzegovina, Bulgaria, Croatia, Cyprus, Czech Republic, Denmark, Estonia, Finland, France, Germany, Greece, Hungary, Iceland, Ireland, Italy, Latvia, Liechtenstein, Lithuania, Luxembourg, Malta, Monaco, Montenegro, Kingdom of the Netherlands, Norway, Poland, Portugal, Republic of Moldova, Romania, San Marino, Serbia, Slovakia, Slovenia, Spain, Sweden, Switzerland, Ukraine, United Kingdom.
Middle East: Bahrain, Islamic Republic of Iran, Iraq, Israel, Jordan, Kuwait, Lebanon, Oman, Qatar, Saudi Arabia, Syrian Arab Republic, United Arab Emirates, Yemen.
North America: Canada, Mexico, United States.
Oceania: Australia, Fiji, Kiribati, Marshall Islands, Micronesia (Federated States of), Nauru, New Zealand, Palau, Papua New Guinea, Samoa, Solomon Islands, Tonga, Tuvalu, Vanuatu.
South America: Argentina, Bolivia (Plurinational State of), Brazil, Chile, Colombia, Ecuador, Guyana, Paraguay, Peru, Suriname, Uruguay, Venezuela (Bolivarian Republic of).
Changelog
- First version of this page was released in September 2023, with IRENA data covering 2000 up until the end of 2021.