
Inflation Trends Across Europe
How much consumer prices change over time is a key economic indicator, and affects everything from the cost of living to monetary policy, investment decisions, and wage negotiations.
This data tracker focuses on inflation data from the harmonised index of consumer prices (HICP), which is compiled by Eurostat and the national statistical institutes. Speficially, it covers the all European Union countries as well as Iceland, Norway, and Switzerland. The HICP is calculated using harmonised statistical methods, and thus ensures comparability across countries.
Latest inflation data
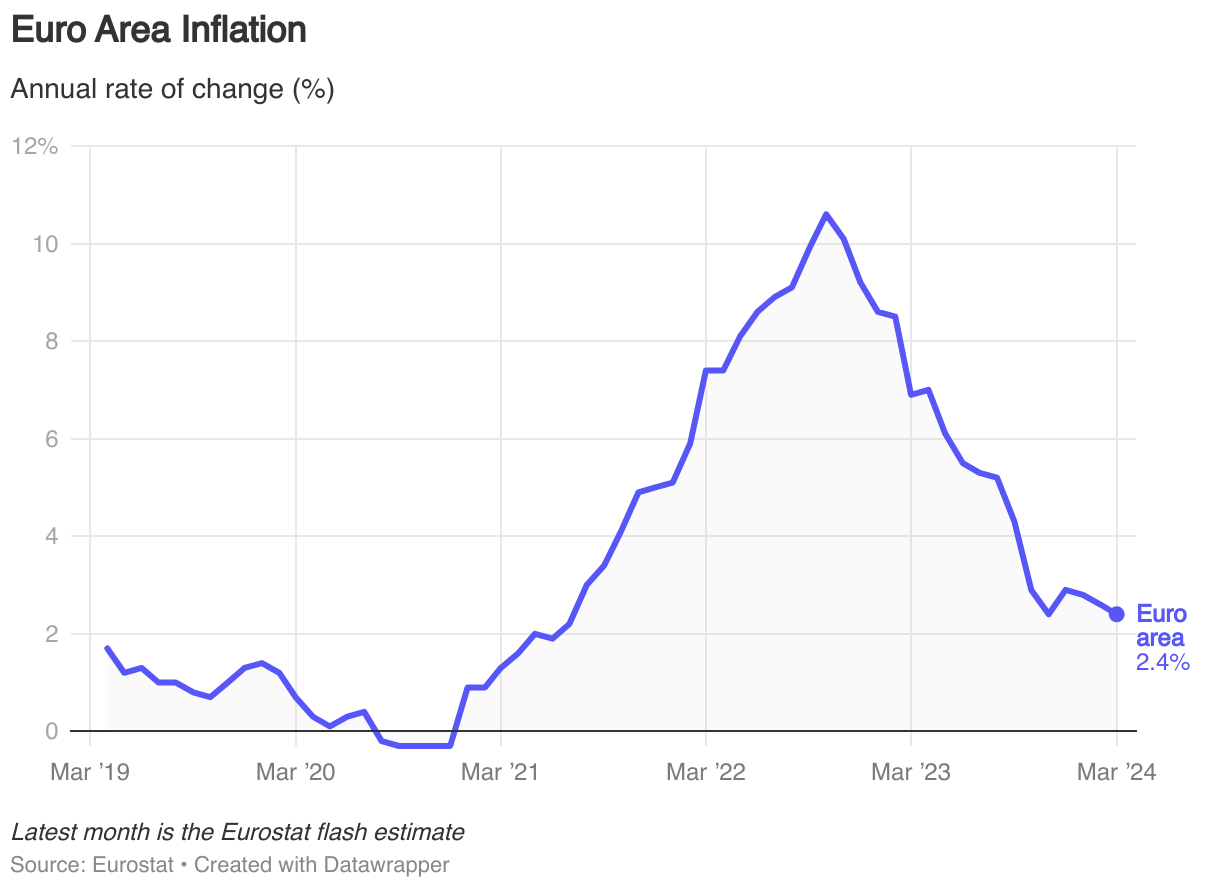
The inflation rate in the euro area stood at 2.8% in June 2026, down from 3.2% in May according to the latest Eurostat data. This is the annual rate of change, and thus indicates how much prices have changed compared to June 2025.
The euro area consists of those EU Member States that have adopted the euro as their currency: Belgium, Germany, Estonia, Ireland, Greece, Spain, France, Croatia, Italy, Cyprus, Latvia, Lithuania, Luxembourg, Malta, the Netherlands, Austria, Portugal, Slovenia, Slovakia and Finland.
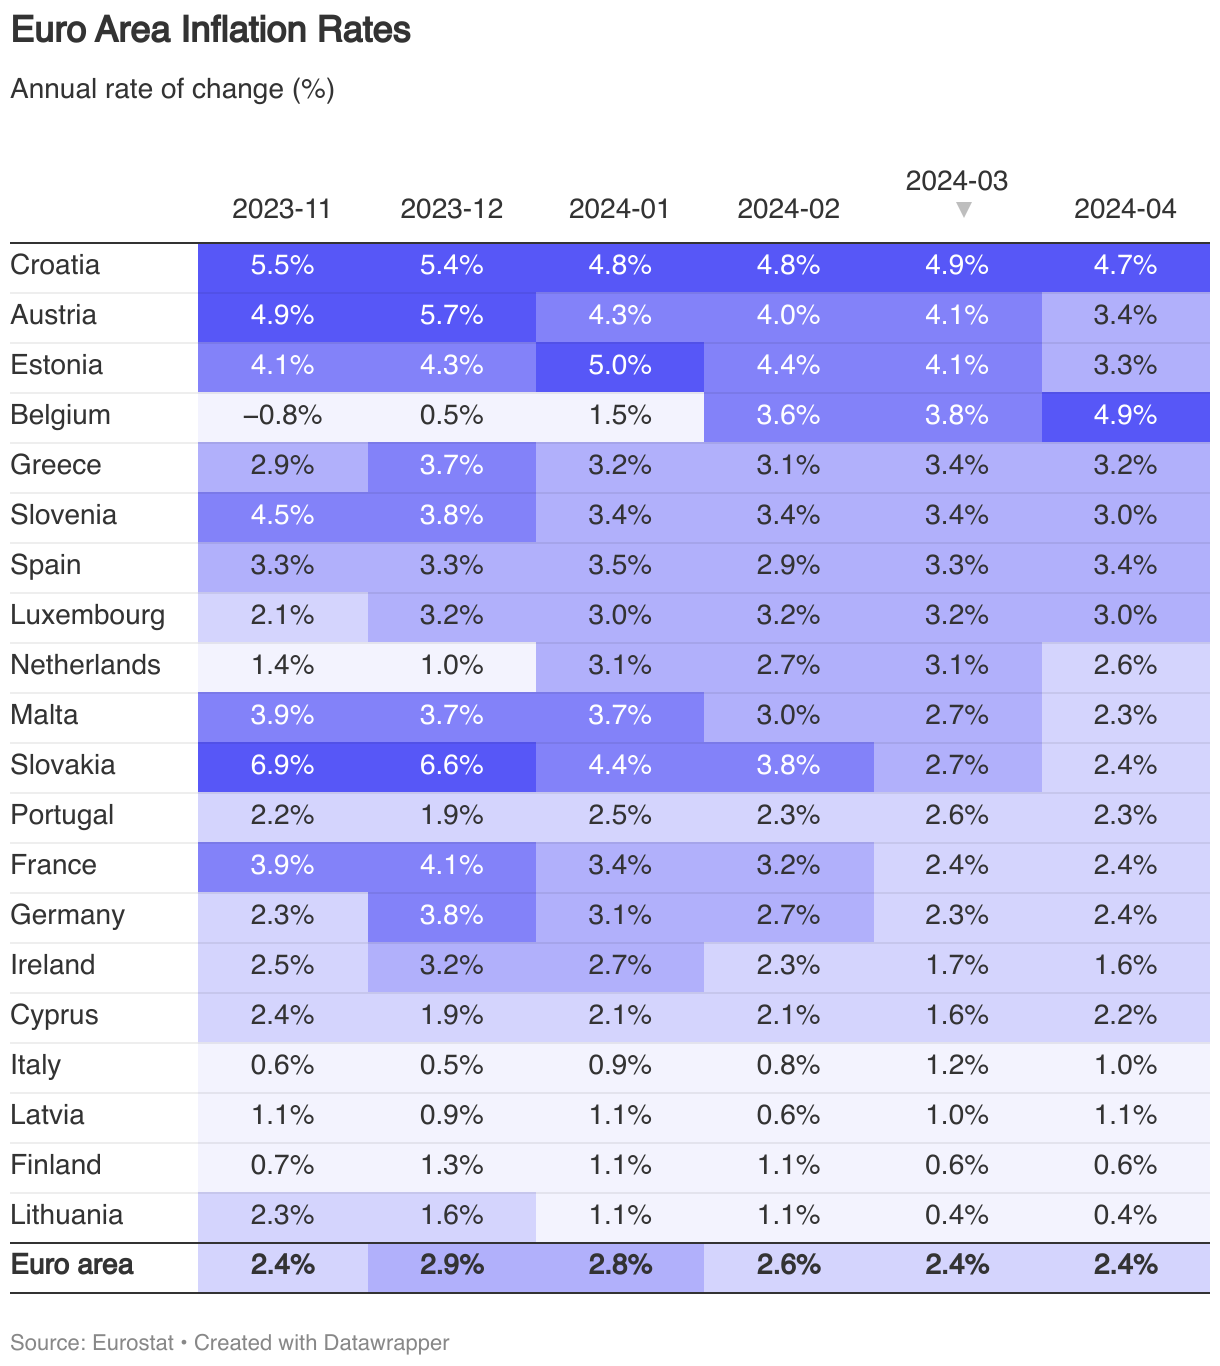
The below table shows the inflation rates for all euro area countries in June 2026, ranging from Lithuania (highest at 5.5%) to Malta (lowest at 1.9%).
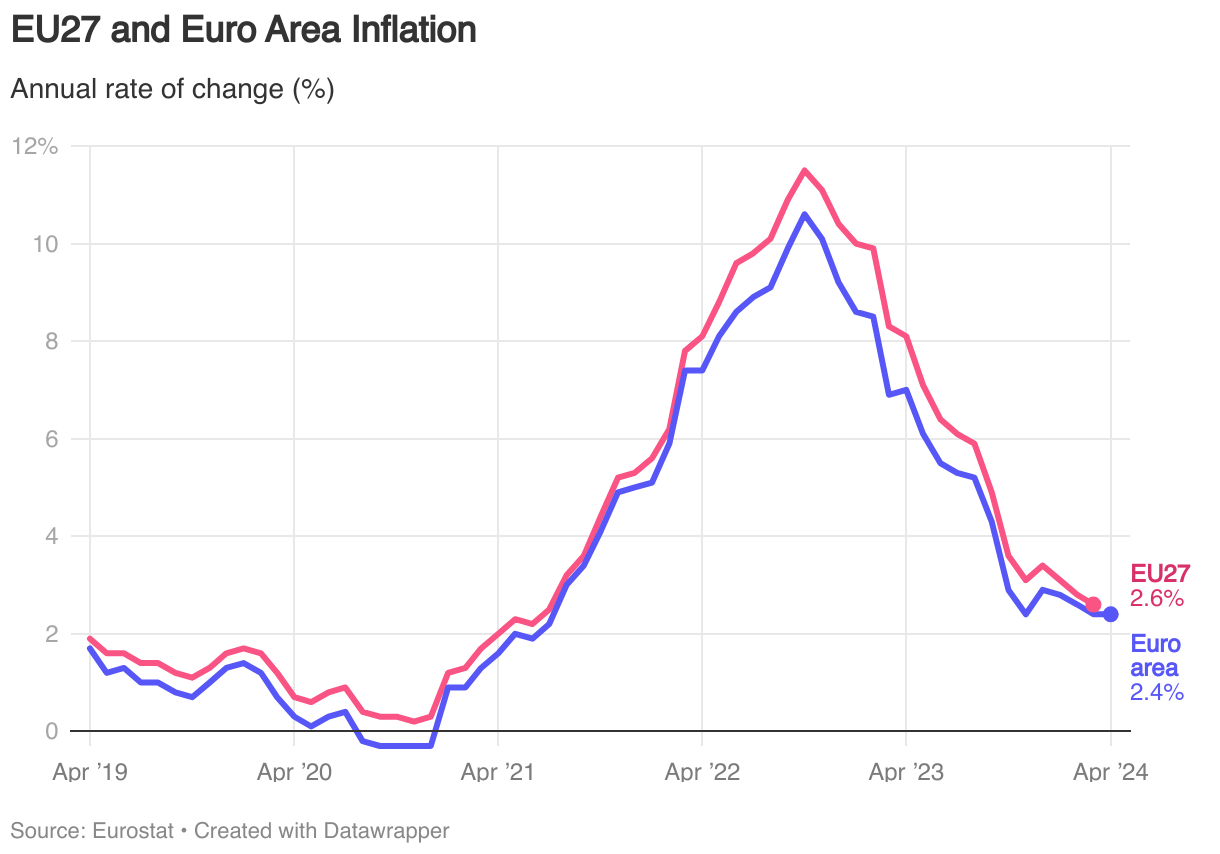
For the 27 EU countries (EU27), the inflation rate stood at 3.3% in May, up slightly from 3.2% in April. Note that Eurostat only produce flash estimates for euro area countries at the end of each month. The full data release for EU27 countries is published around the middle of the following month.
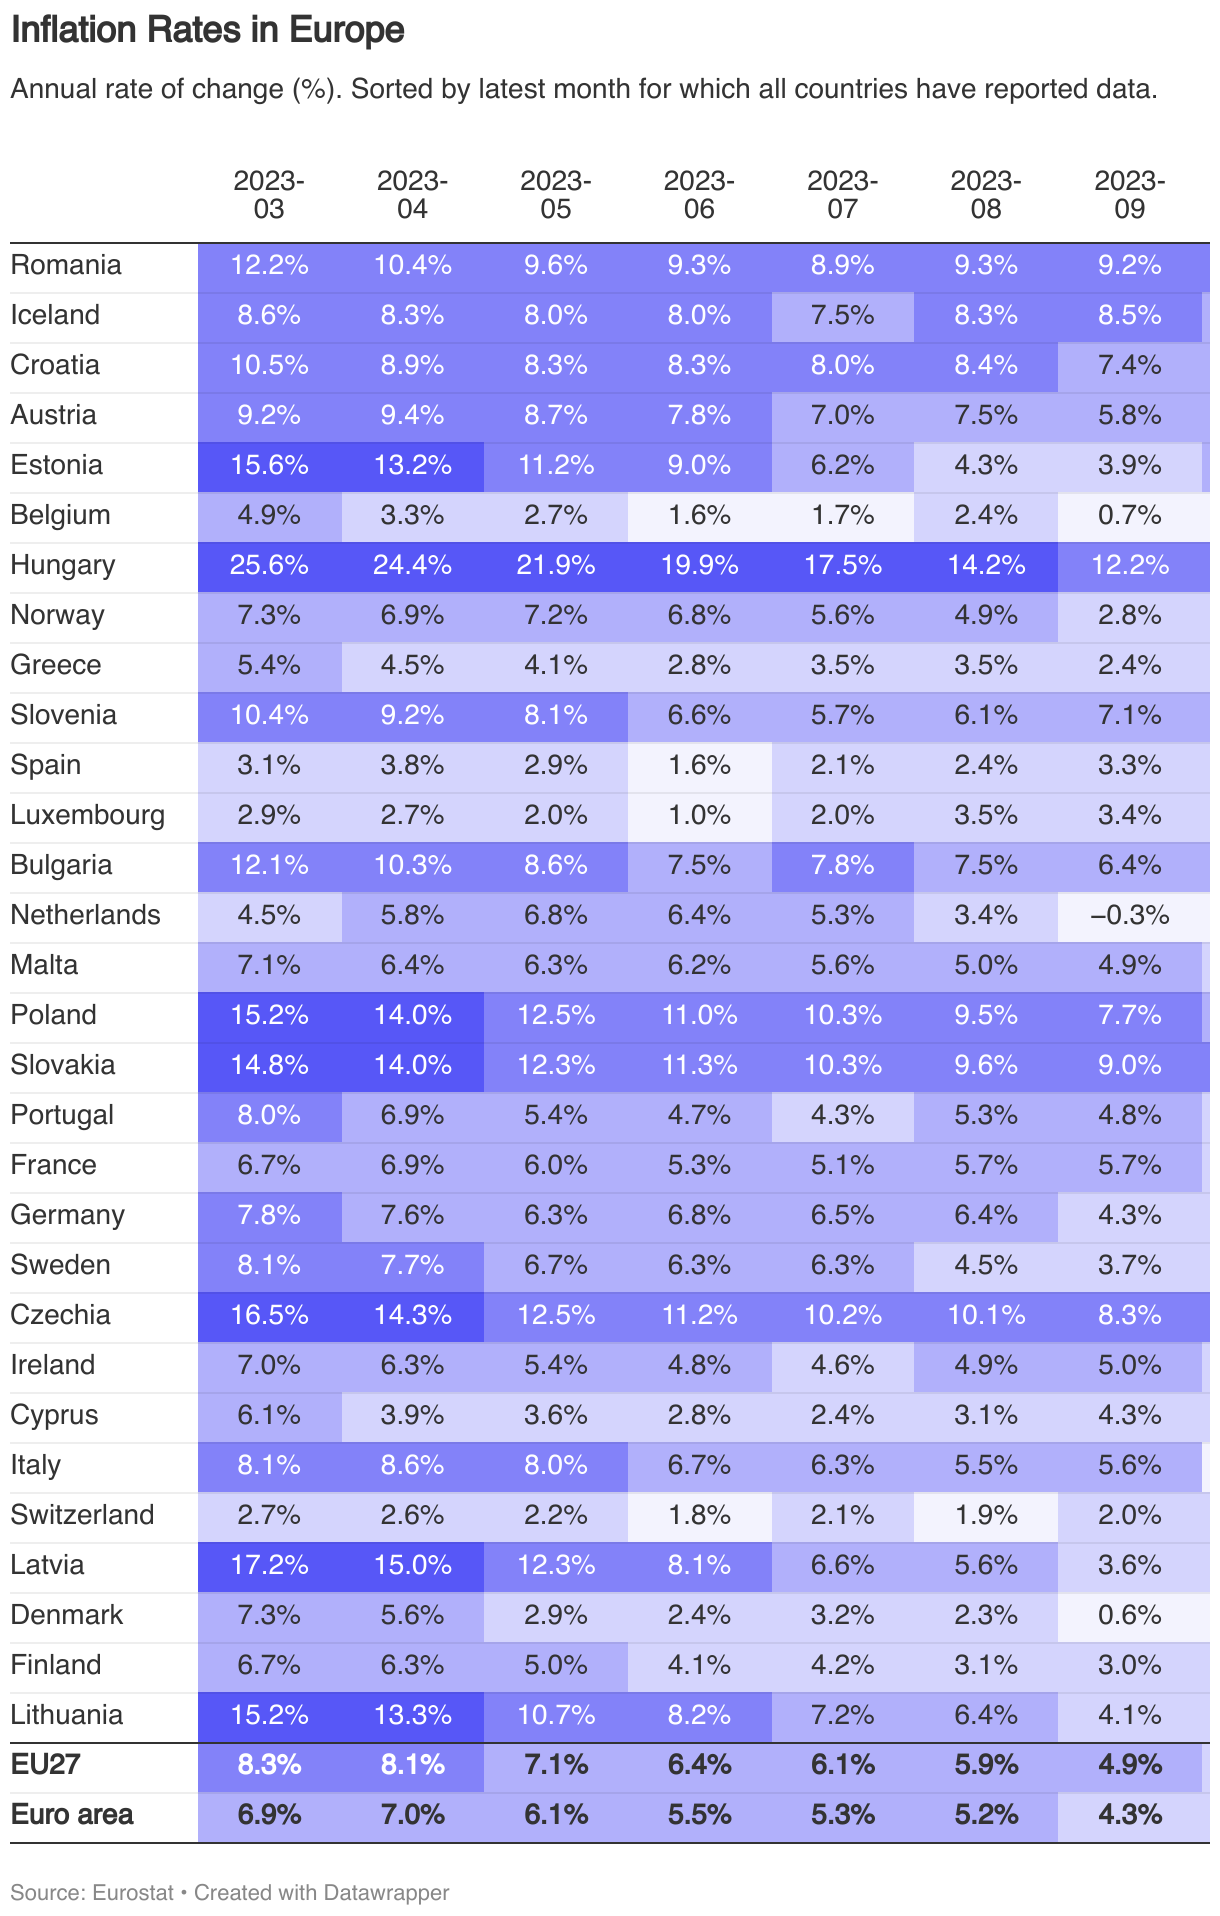
The below table shows the inflation rates for all countries for which Eurostat publishes data for in May 2026 (including EU27, Norway, Iceland and Switzerland), ranging from Romania (highest at 9.7%) to Switzerland (lowest at 0.9%).
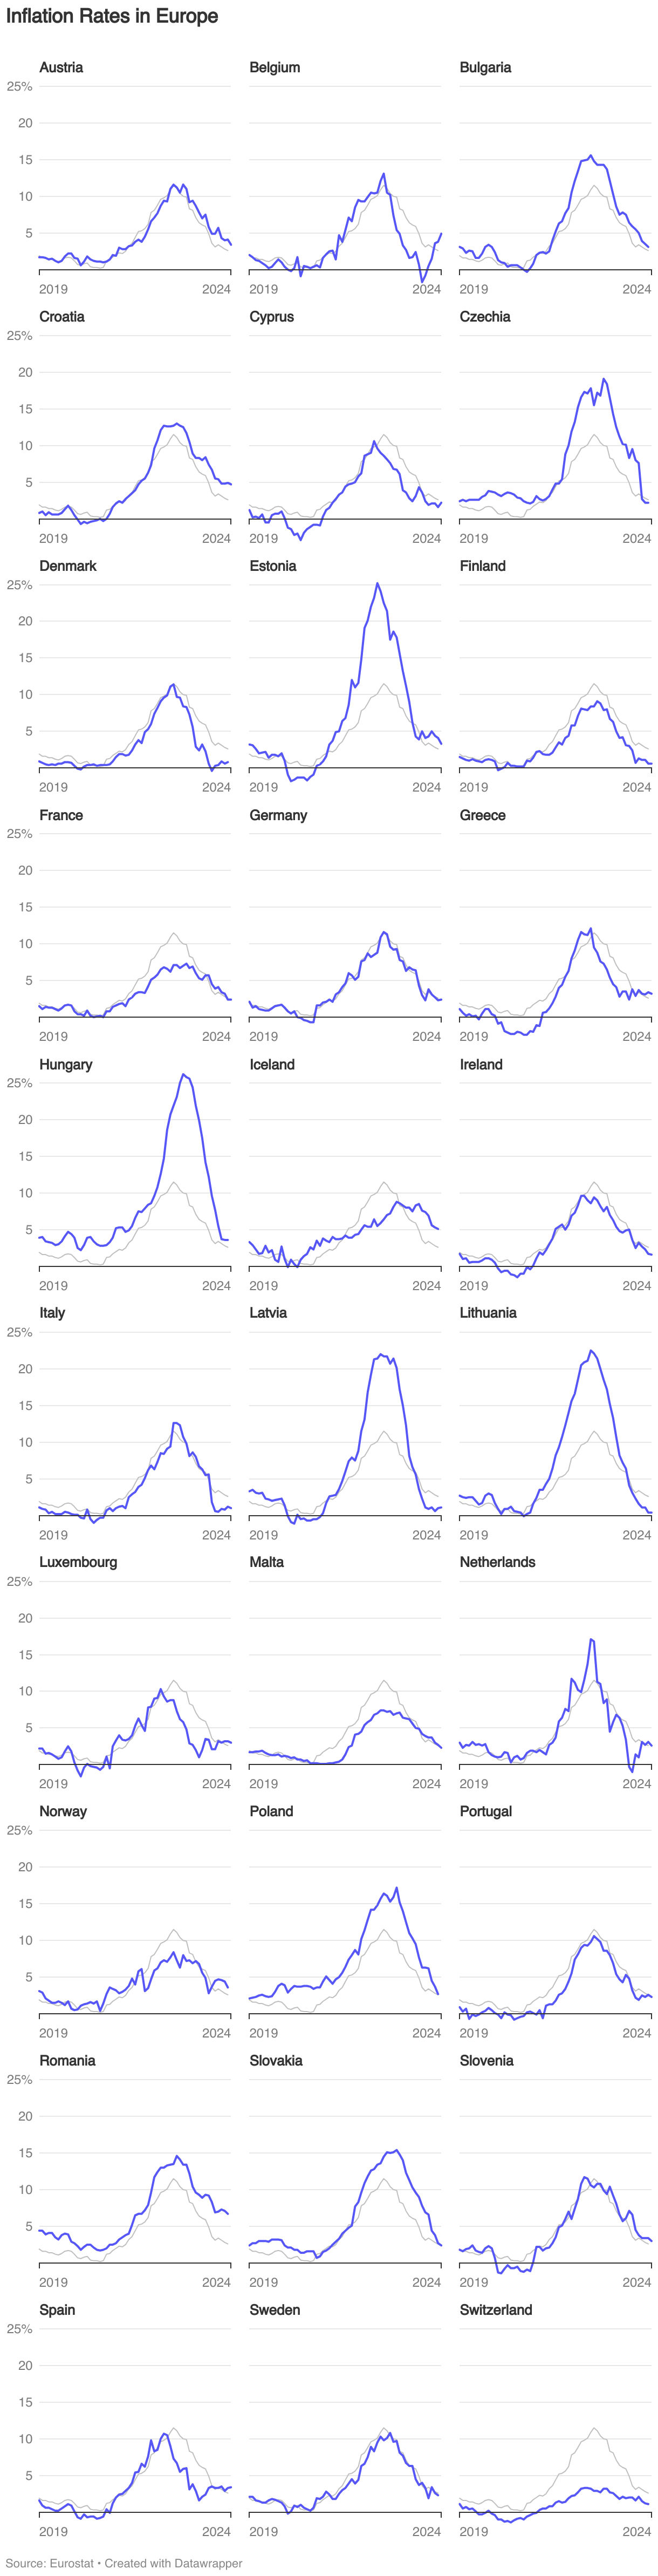
Inflation trends over time
The chart below shows how the inflation rate has developed over the past five years in all EU countries as well as Iceland, Norway and Switerland. These are harmonised indices of consumer prices (HICP), which means the measure is comparable across countries. The EU27-average marked as a grey line in each country chart.
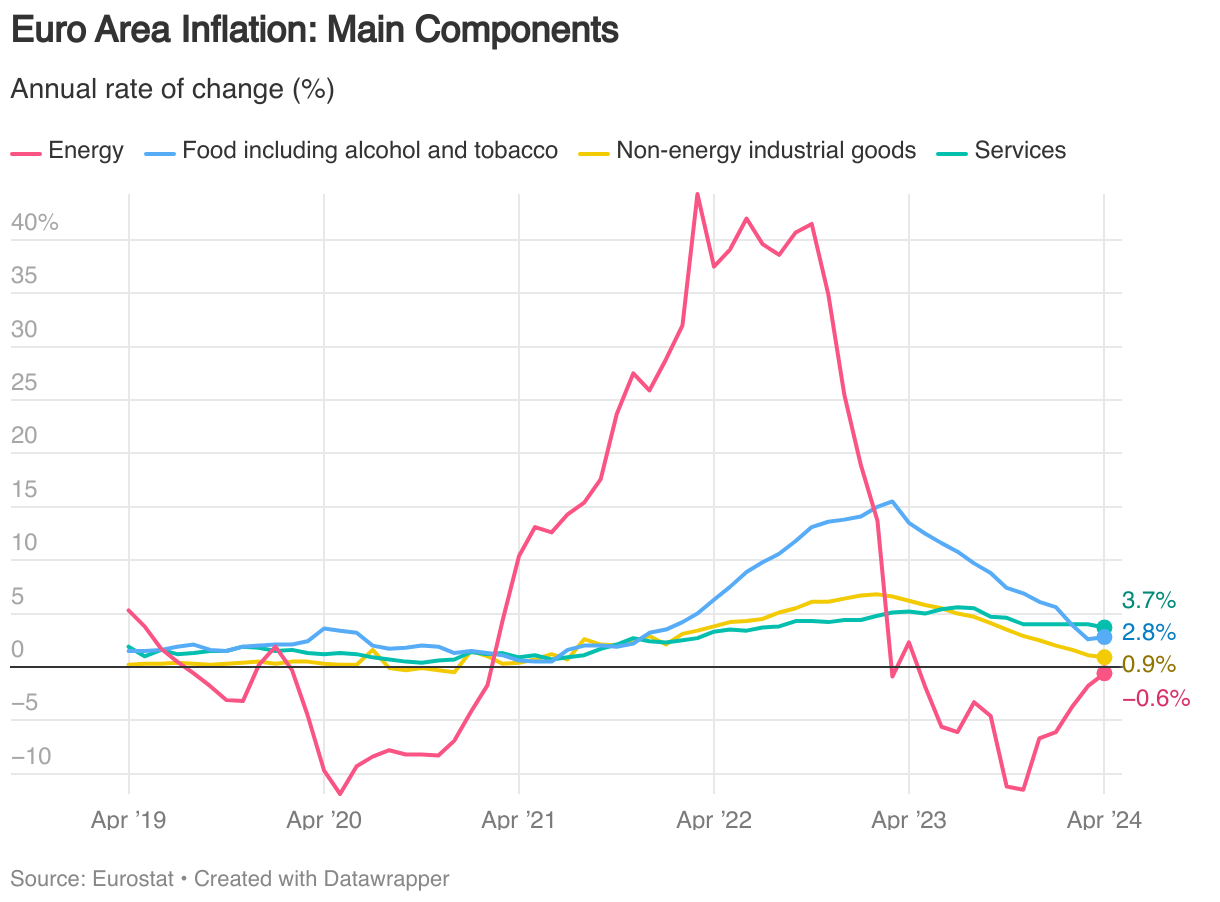
Inflation by main components
Inflation can be understood both as an overall rate and by examining its main components. There are four main components that contribute to the overall index: services, food, energy and non-energy industrial goods.
The latest data for the euro area countries, shows services inflation at 3.2% in June 2026, food, alcohol and tobacco inflation at 1.6%, while non-energy industrial goods inflation stood at 0.9% and energy at 8.7%.
About the data
The data used on this page is from Eurostat.