

Food prices are a critical aspect of the global food system, as they impact everyone from producers and distributors to consumers and policymakers. Fluctuations in food prices can have significant economic and social consequences, affecting the availability and affordability of food around the world.
The FAO Food Price Index, published by the Food and Agriculture Organization of the United Nations (FAO), is a key barometer of the world food market, tracking changes in global food prices over time. The index is set to 100 for the years 2014-2016, meaning that the average price level for the basket of food commodities in those three years is used as the reference point or base period.
Subsequent values of the index represent the percentage change in the average price level compared to the base period. For example, if the index value is 120, it means that the average price level for the basket of food commodities in that year is 20% higher than the average price level in the base period (2014-2016).
The FAO Food Price Index comprises five major commodity groups: cereals, vegetable oils, dairy, meat, and sugar. These commodity groups are tracked by their own sub-indices:
- FAO Cereal Price Index: This sub-index tracks changes in the prices of wheat, maize, rice, barley, and other cereal crops, which are some of the most important staple foods for people around the world.
- FAO Vegetable Oil Price Index: This sub-index monitors price trends for major vegetable oils, such as palm oil, soybean oil, and sunflower oil, which are widely used in food production and are important sources of fat and calories in many diets.
- FAO Dairy Price Index: This sub-index tracks changes in the prices of dairy products, including milk, cheese, and butter, which are important sources of protein, fat, and other nutrients in many diets.
- FAO Meat Price Index: This sub-index monitors price trends for different types of meat, including beef, pork, and poultry, which are important sources of protein in many diets and are widely consumed around the world.
- FAO Sugar Price Index: This sub-index tracks changes in the prices of raw sugar and white sugar, which are important sources of calories and sweetness in many diets.
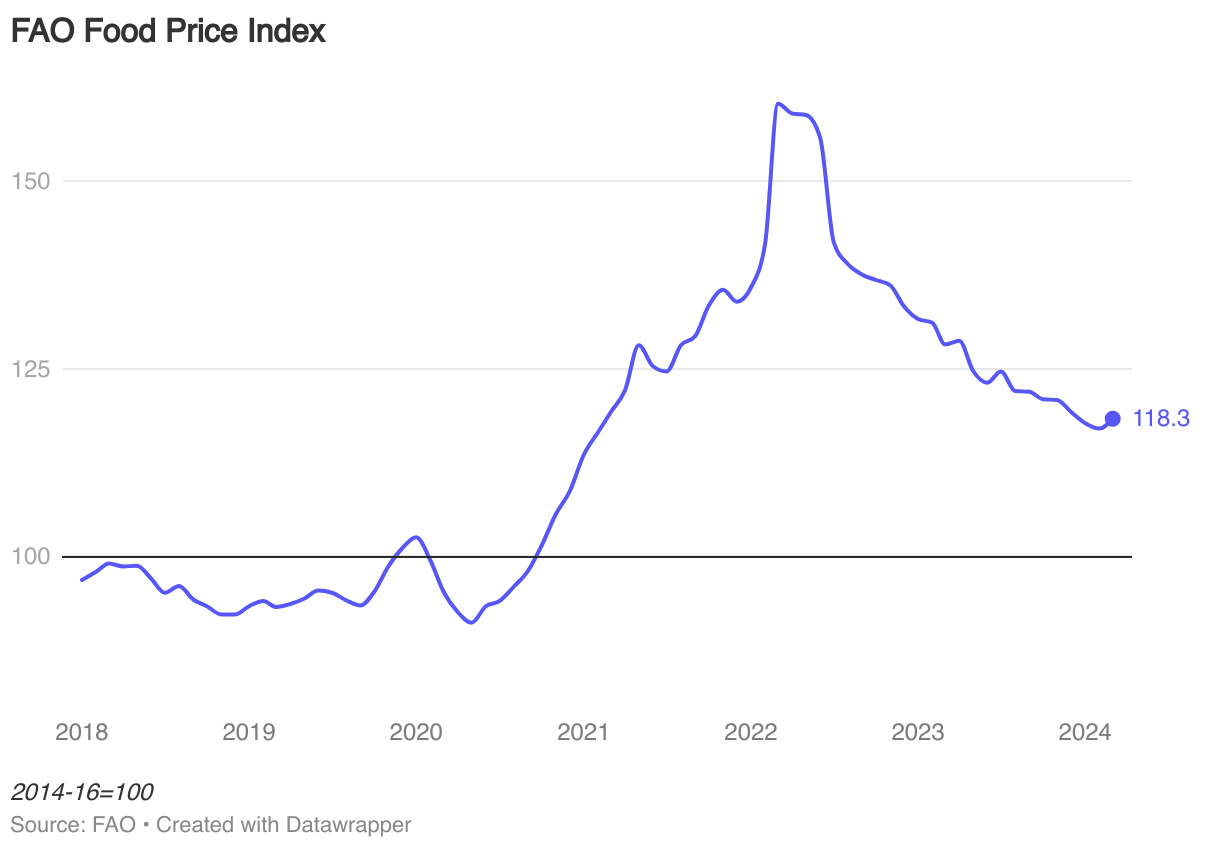
FAO Food Price Index slighty up in March
In March 2024, the FAO Food Price Index increased slightly by 1.1 percent to 118.3 points, marking its first rise after a seven-month decline, although it remained 7.7 percent lower year-on-year.
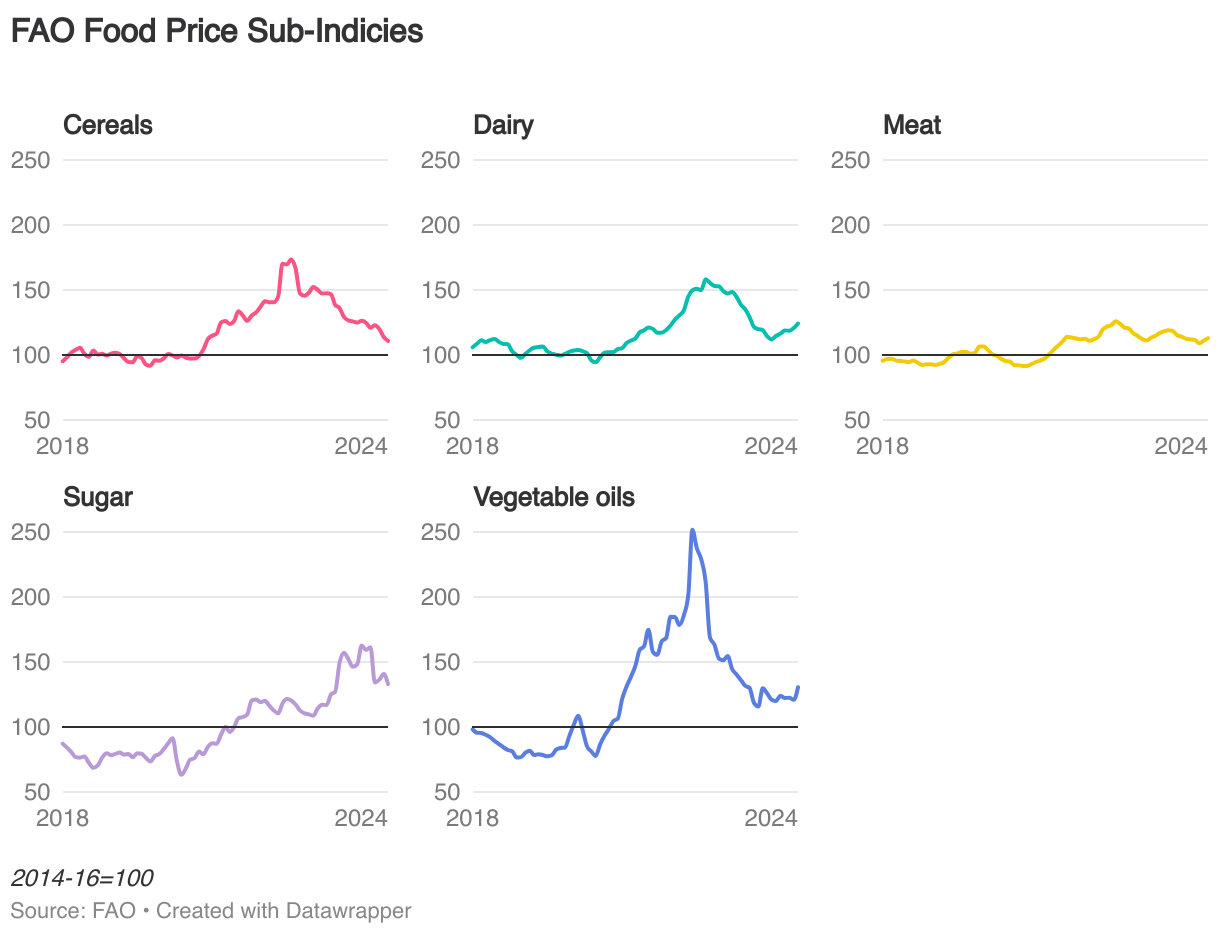
A closer look at the five sub-indicies in March 2024 shows that the rise was driven by higher prices in the vegetable oils, dairy, and meat, which more than compensated for declines in sugar and cereals:
- The FAO Cereal Price Index dropped by 2.6% to 110.8 points, continuing a declining trend for the past months, and stands 20% below the level in March 2023.
- The FAO Dairy Price Index increased by 2.9% to 124.2 points, up for the sixt month in row but still 11.2% lower than the level in March 2023.
- The FAO Meat Price Index also rose slightly by 1.9% to 113.0 points, standing at approximately the same level as a year ago (up 1.5%).
- The FAO Sugar Price Index fell by 5.4% to 133.1 points, up 5.4% compared to March 2023 yet significantly lower than the levels seen in late 2023.
- The FAO Vegetable Oil Price Index saw the largest increase from February to March at +9.7 points (8%), standing at the highest level in over a year.
More details of the key drivers behind recent trends can be found in the latest FAO press release.
About the data
The data used on this page is sourced from Food and Agriculture Organization of the United Nations (FAO).