
Eurostat has released their estimates of Gross Domestic Product (GDP) per capita across the European Union in 2023, which gives insights into the variances in economic prosperity among its member states.
GDP encapsulates the total value of all goods and services produced within a nation, and is a key indicator of overall economic output. When adjusted per capita, it gives insights into differences in living standards between countries.
To ensure these comparisons hold true meaning across national boundaries, it’s important to adjust for differences in price levels through Purchasing Power Parity (PPP) adjustment.
Even if GDP per capita is measured in a common currency (like the euro or dollar) but without adjusting for PPP, differences in price levels between countries are not taken into account. In reality, a euro spent in one country can buy a different quantity of goods and services than the same euro spent in another country. In countries with higher price levels, people need more money to buy the same goods and services than in countries with lower price levels. If we don’t adjust for this, GDP per capita figures will overestimate the real purchasing power of people in high-price countries.
PPP adjustments recalibrate GDP figures by taking into account the relative cost of living and the inflation rates of countries. The PPP rates are used to convert the GDP of each country into an artificial common currency that equalizes the purchasing power of different currencies. This means that after PPP adjustment, the GDP per capita figures gives a comparable view of what people can actually afford in their own country, irrespective of national price levels.
Eurostat’s data for 2023 are presented in the below tables as an index, with the EU27’s average GDP per capita set as the benchmark at 100. Countries scoring above this threshold have a GDP per capita surpassing the EU mean, suggesting higher living standards than the EU27-average. Those below 100, conversely, indicate lower living standards than the EU27-average.
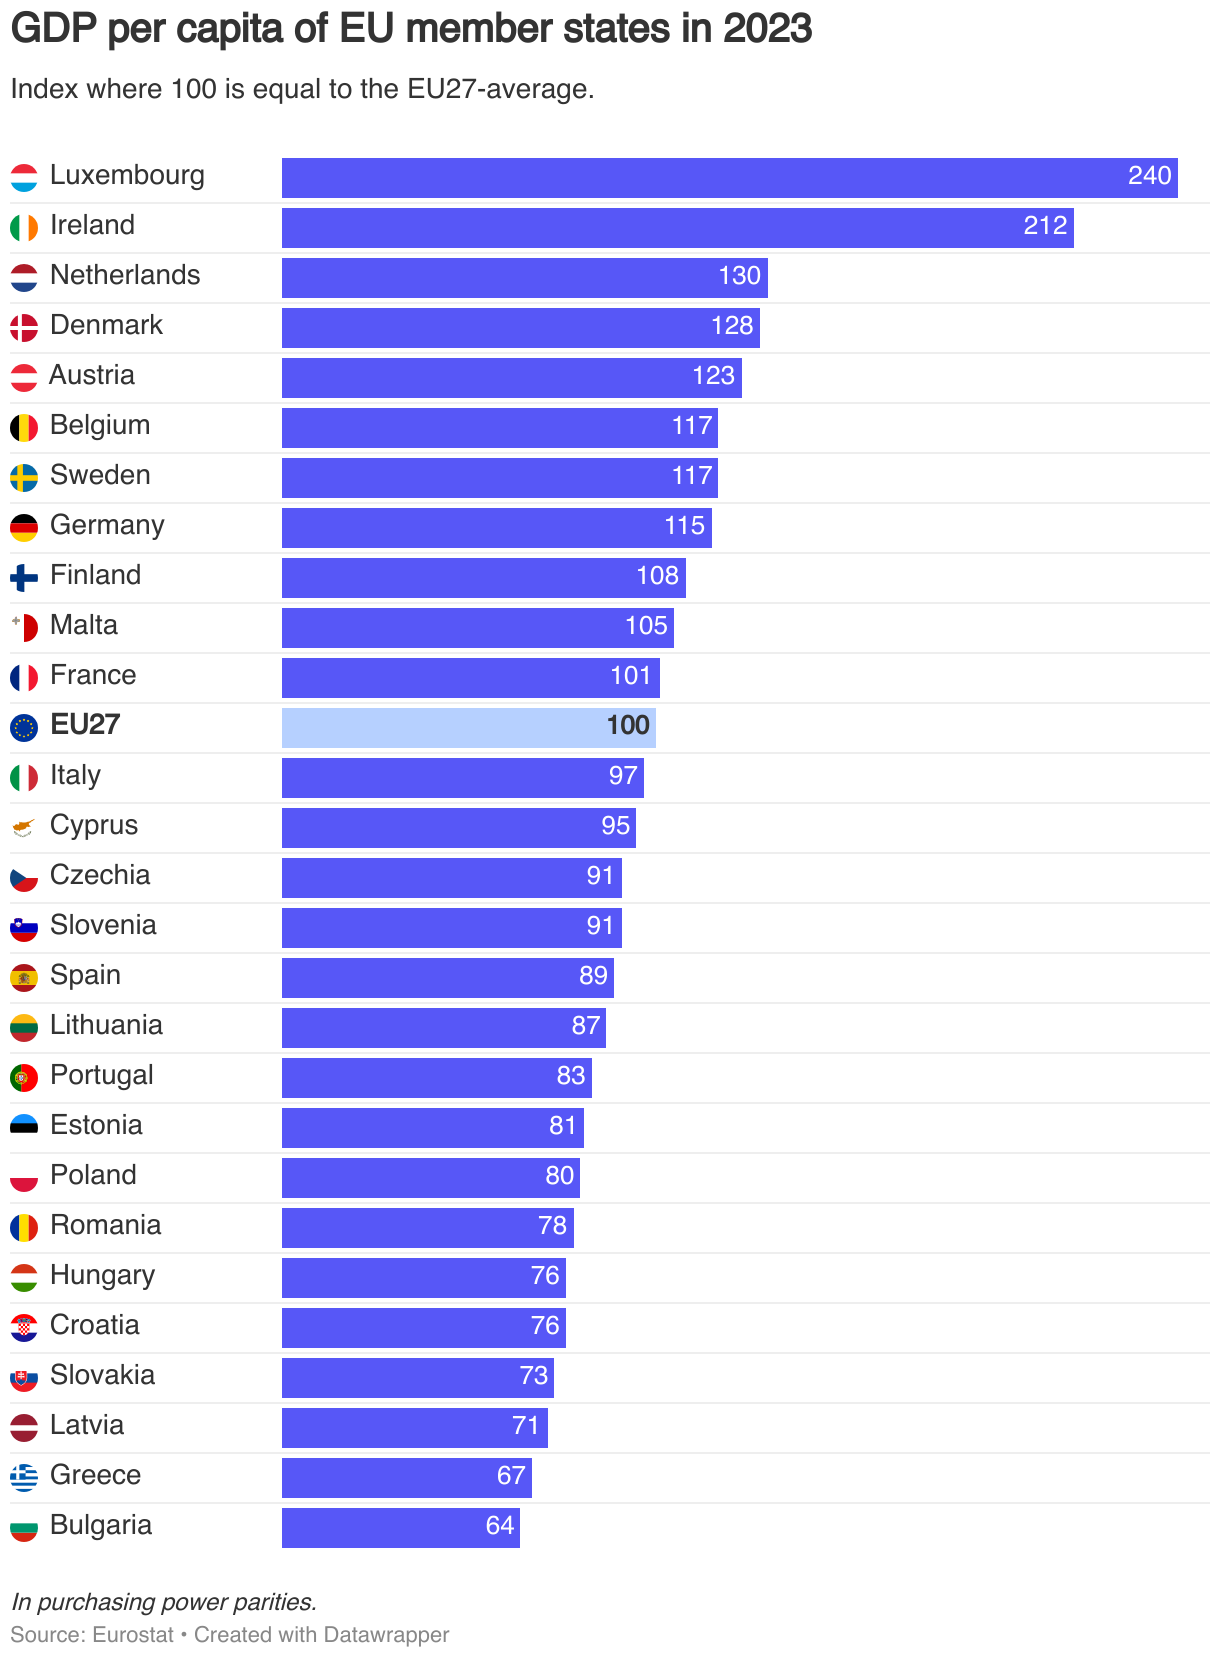
The 2023 data show that Luxembourg and Ireland at the forefront of economic prosperity within the EU, with their GDP per capita significantly outpacing the union average, followed closely by the Netherlands, Denmark, and Austria. On the opposite end of the spectrum, countries like Bulgaria, Greece, Latvia, Slovakia, and Croatia find themselves with GDP per capita figures considerably below the EU average.
As an example of how to intepret the index values, Cyprus at 95 has a GDP per capita which is 5% lower the EU27-average. Meanwhile, Luxembourg at 240 has a GDP per capita which is 140% above the EU27-average.
Importantly, Eurostat points out that the high GDP per capita figures for Luxembourg and Ireland are influenced by some unique country speficic factors. In Luxembourg, the presence of cross-border workers inflates its GDP per capita, as they contribute to the economy but aren’t counted in the population used for per capita calculations. In Ireland, the significant role of multinational corporations boosts GDP. However, much of this income is returned to the company owners abroad, affecting the net economic benefit to the Irish population.