

Introduction
This data tracker looks at Nordic countries’ progress towards achieving Sustainable Development Goal 9: Build resilient infrastructure, promote inclusive and sustainable industrialization and foster innovation. The goal is comprised of 8 targets.
The Nordic countries – Denmark, Finland, Iceland, Norway and Sweden – are classified into one of five categories for each target:
Met: The country has already met the 2030 target.
On track: The country has not yet met the target but is on track to do so by 2030.
Short distance: The country has not met the target and is not projected to do so but is close to achieving it. This category also applies when the country currently meets the target but is projected to move away from it.
Long distance but progressing: The country is far from the target but is making progress towards it.
Long distance and not progressing: The country is far from the target and is not making progress towards reaching it.
Details on the methodology used, together with the overall assessment for all 17 goals, can be found on our overview page. Note that the analysis is currently work in progress.
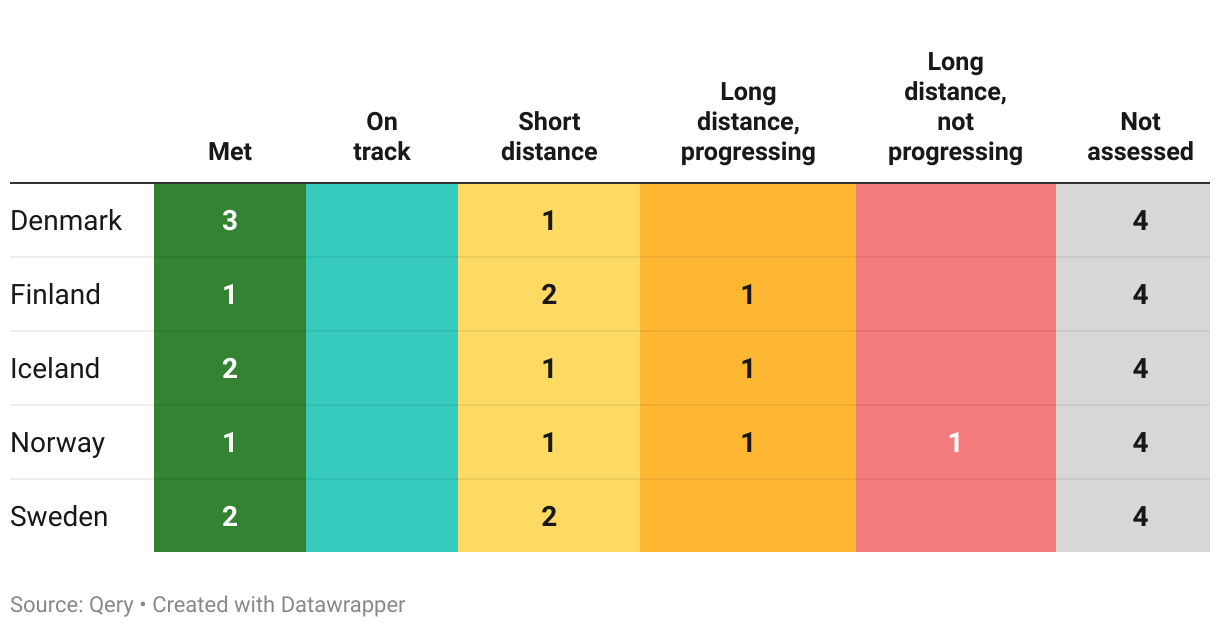
Overall assessment of progress
As of mid-2023, this is our assessment of the Nordic countries progress on the 8 targets part of SDG 9:
The Nordic countries’ performance on the different targets part of this goal can be explored further below. Each section follows the same structure:
- First, the official target text and related indicators is described and the latest global and regional trends are highlighted briefly.
- Second, where data is available, we then zoom in on the Nordic countries to describe how they are progressing, and assess their likelihood of achieving the target by the 2030 deadline.
- Note that both sections above strictly uses data from the UN SDG Global Database and/or the OECD.
Target 9.1
Develop quality, reliable, sustainable and resilient infrastructure, including regional and transborder infrastructure, to support economic development and human well-being, with a focus on affordable and equitable access for all
| 9.1.1 | Proportion of the rural population who live within 2 km of an all-season road |
| 9.1.2 | Passenger and freight volumes, by mode of transport |
Global trends
No data is available at the global or regional level for indicator 9.1.1.
For the second indicator on passenger and freight volumes, data is available at a global and regional level up until 2021 from the UN SDG database. This section is to be expanded.
The Nordics
Progress is not assessed for the Nordic countries on this target.
Target 9.2
Promote inclusive and sustainable industrialization and, by 2030, significantly raise industry’s share of employment and gross domestic product, in line with national circumstances, and double its share in least developed countries
| 9.2.1 | Manufacturing value added as a proportion of GDP and per capita |
| 9.2.2 | Manufacturing employment as a proportion of total employment |
Global trends
The share of manufacturing in employment and GDP is highly dependent on national circumstances and there is no set target level in the SDG framework. To gauge the development of the manufacturing sector, it is more informative to look at the sector’s value added per capita.
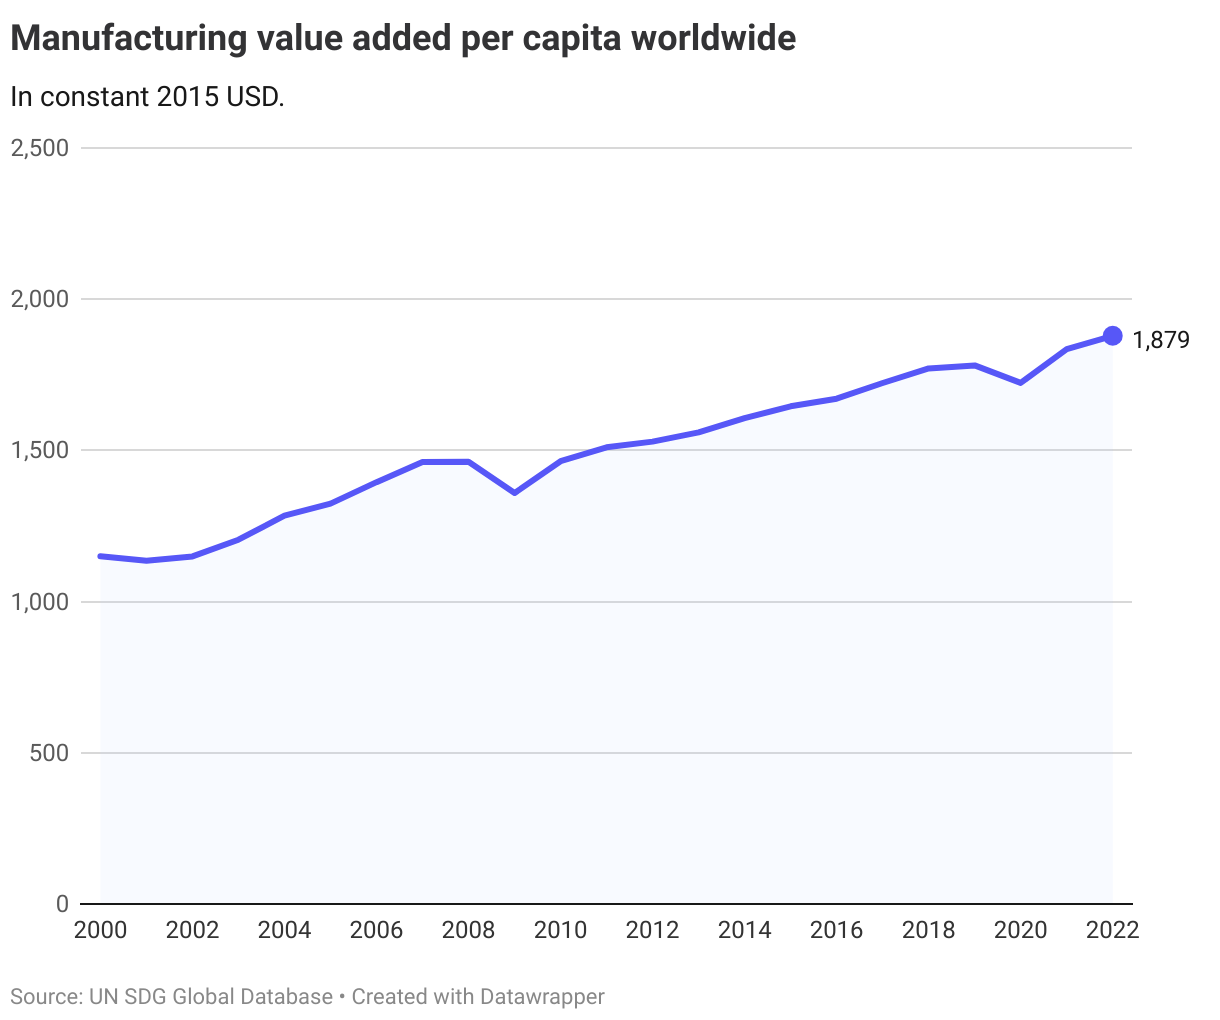
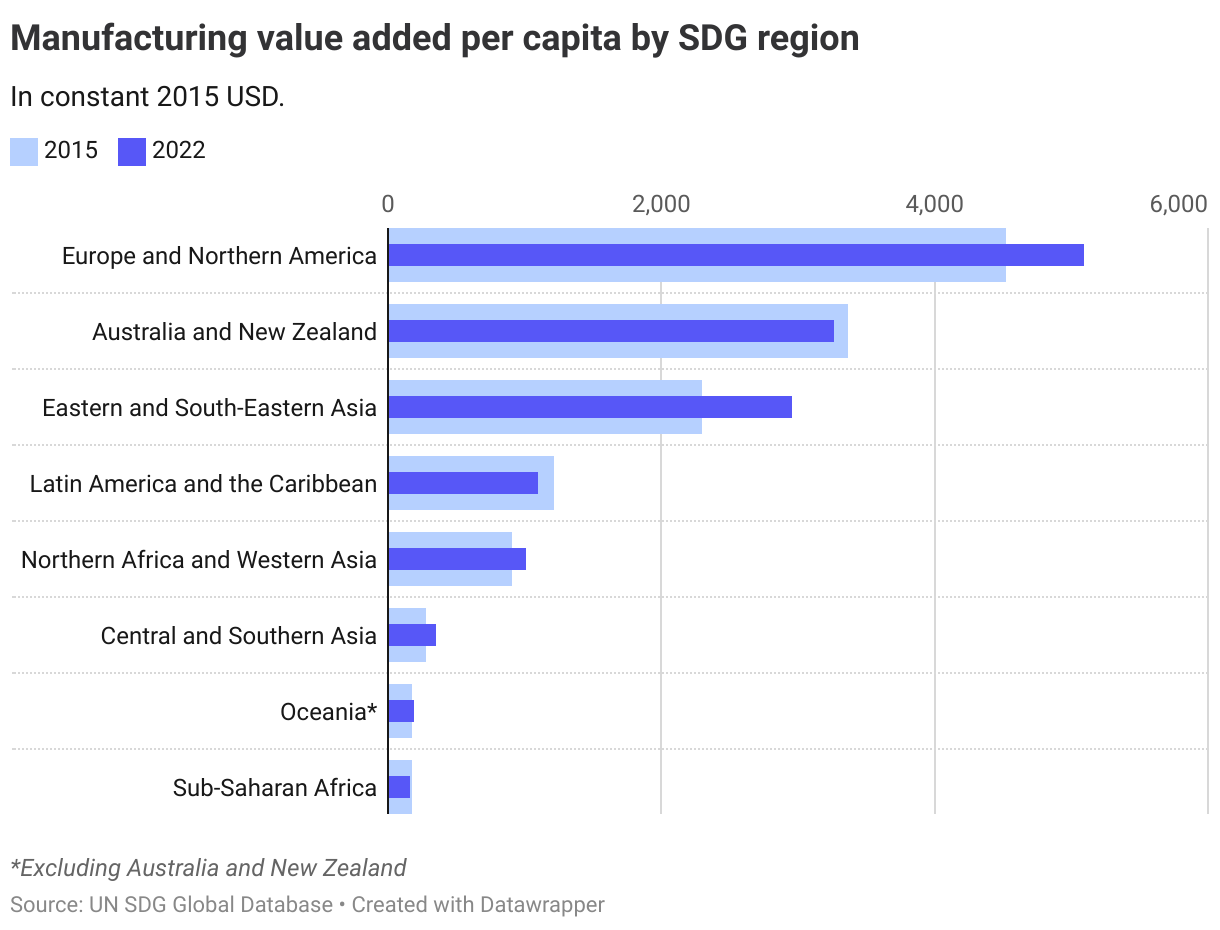
At a global level, this has increased by 14% since 2015. The increase has been driven by increases in manufacturing value added per capita in Europe and Northern America as well as Eastern and South-Eastern Asia.
The Nordics
Given the absence of a country-level target for 2030 in the global framework, the OECD has operationalised the target as matching the average level of the four best OECD performers in 2015 (7500 USD per capita). Denmark is currently the only country which has made progress towards this target over the past years, reaching a level of over 8600 USD value added per capita from manufacturing in 2022.
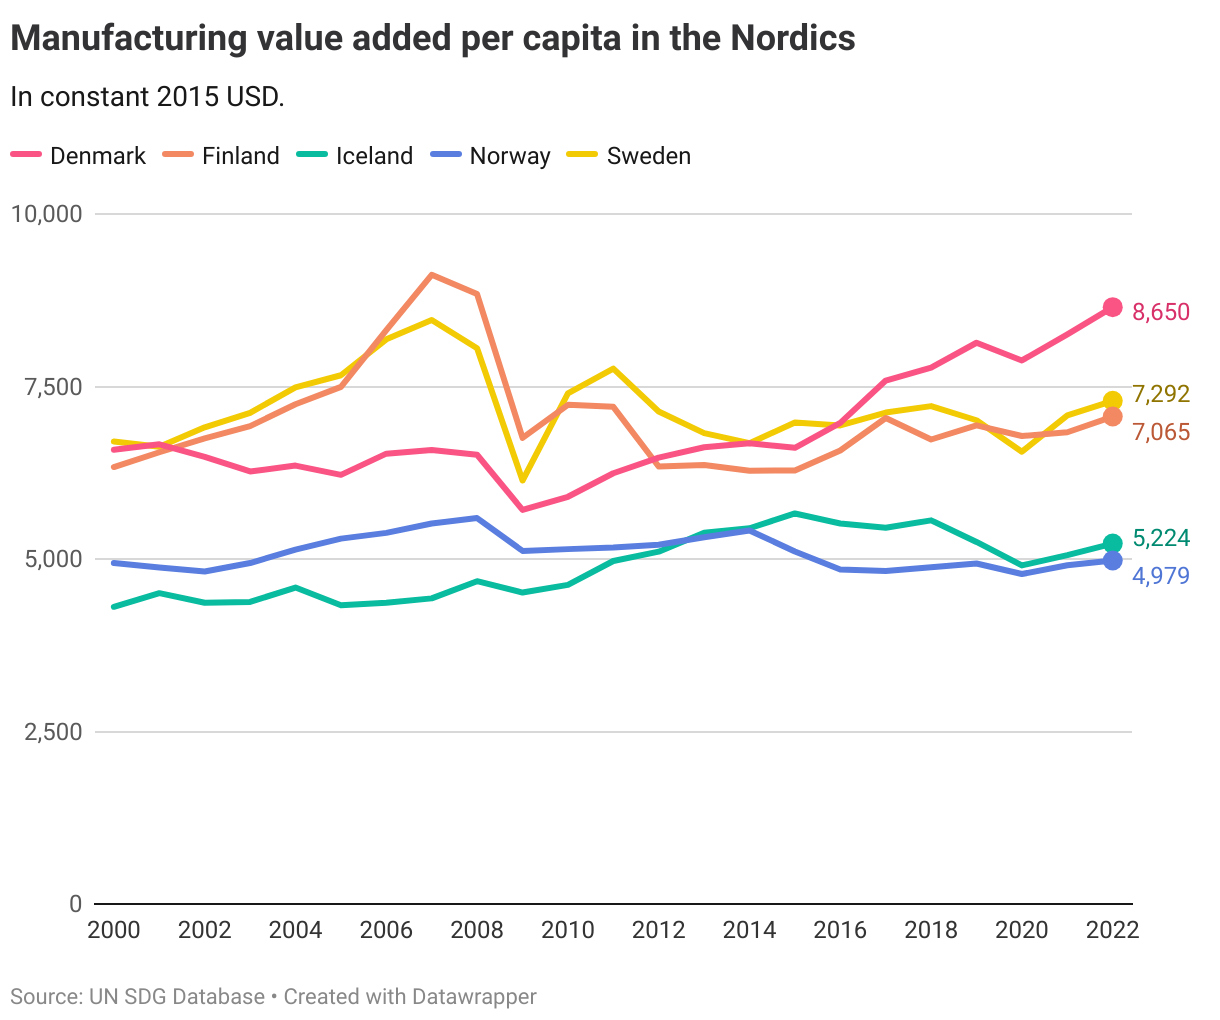
Denmark
Target is met
Finland
Short distance to target
Iceland
Long distance to target but progressing
Norway
Long distance to target, not progressing
Sweden
Short distance to target
Target 9.3
Increase the access of small-scale industrial and other enterprises, in particular in developing countries, to financial services, including affordable credit, and their integration into value chains and markets
| 9.3.1 | Proportion of small-scale industries in total industry value added |
| 9.3.2 | Proportion of small-scale industries with a loan or line of credit |
Global trends
No data is available at a global or regional level for indicator 9.3.1.
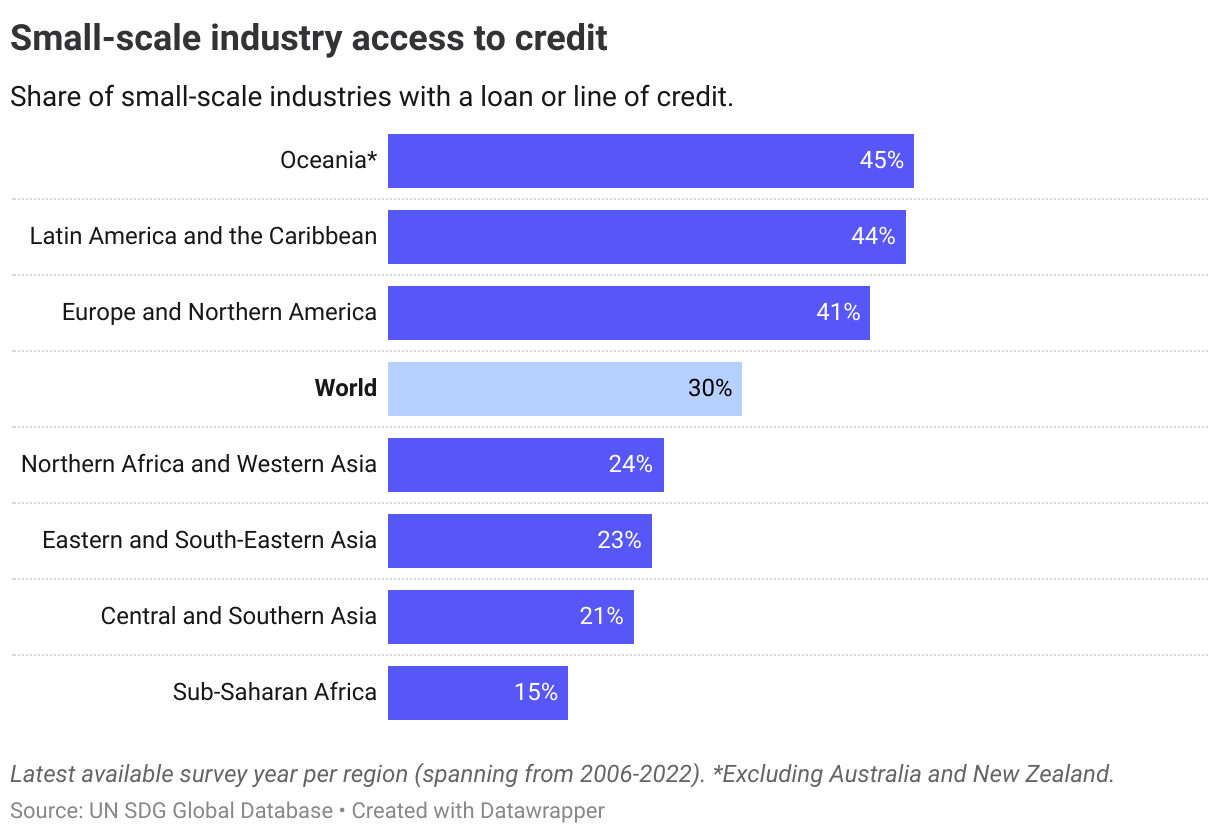
Globally, one-third of small-scale industries have a loan or a line of credit (indicator 9.3.2), based on latest avaliable survey data. The share with access to credit is lowest in Sub-Saharan Africa, where the latest survey data showed that only 15% had a loan or a line of credit.
The Nordics
Progress is not assessed for the Nordic countries due to insufficient data.
Target 9.4
By 2030, upgrade infrastructure and retrofit industries to make them sustainable, with increased resource-use efficiency and greater adoption of clean and environmentally sound technologies and industrial processes, with all countries taking action in accordance with their respective capabilities
| 9.4.1 | CO2 emission per unit of value added |
Global trends
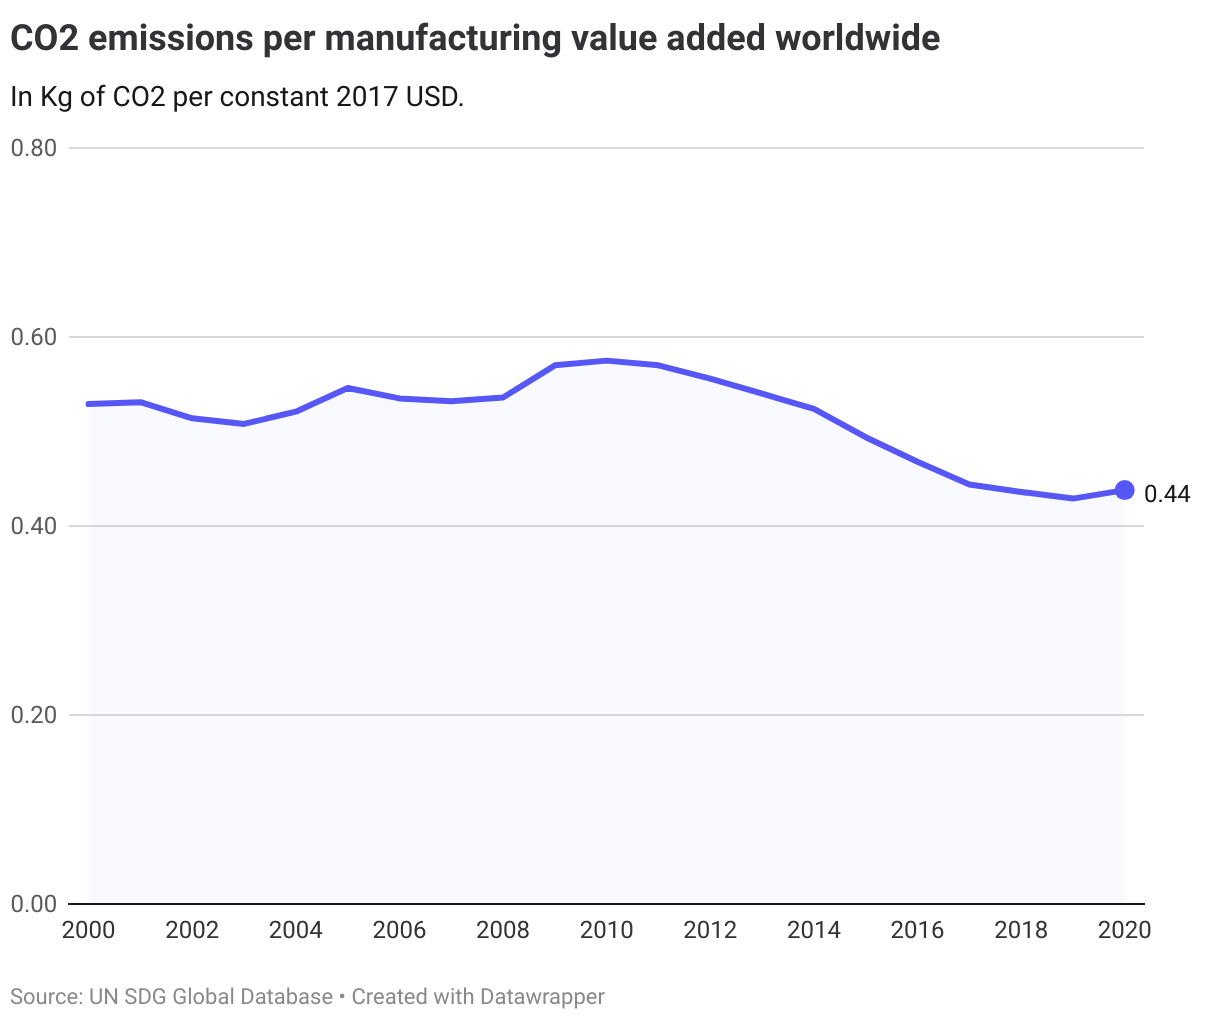
Global CO2 emissions in the manufacturing sector (in kg per value added) have decreased since 2015, and stood at 0.44 Kg CO2 emissions per manufacturing value added in 2020.
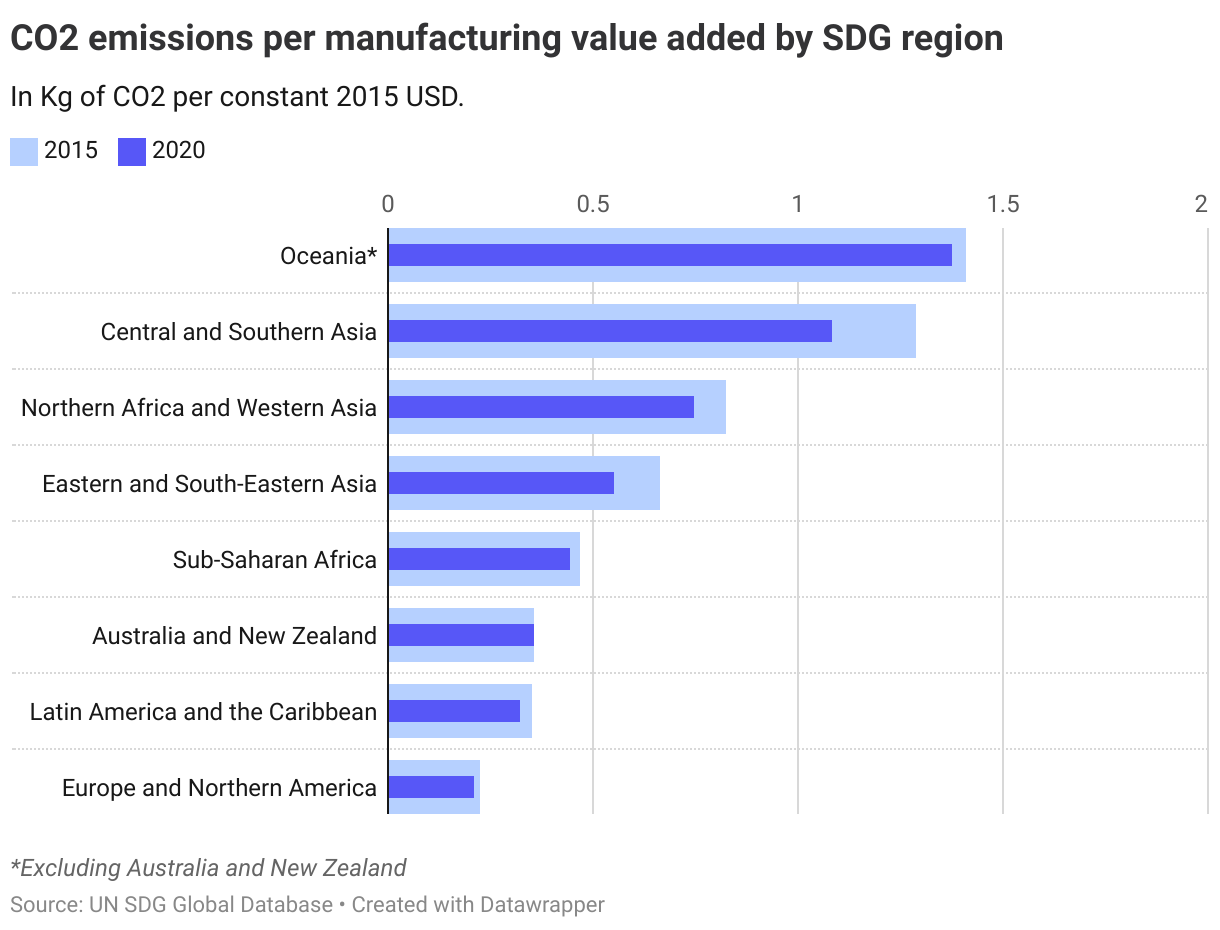
Regional data from 2020 (the latest year available) shows that emissions decreased in all regions (though to varying degrees) when compared to 2015 levels. The data shows there are large variations across regions, with emission levels almost 6 to 7 times larger in Oceania and Central and Southern Asia than in Europe and Northern America.
The Nordics
The OECD has operationalised this target by measuring progress against the top OECD performers in 2015. For CO2 emissions per unit of manufacturing value added this entails a target level of below 0.1 Kg by 2030. The OECD also includes an additional indicator for CO2 emissions per unit of GDP, similarly benchmarked against best OECD performers in 2015, entailing a level of 0.085 Kg by 2030. The latest data shows that Denmark, Sweden and Iceland are on track to reach the targets, while more progress is needed in Norway and Finland.
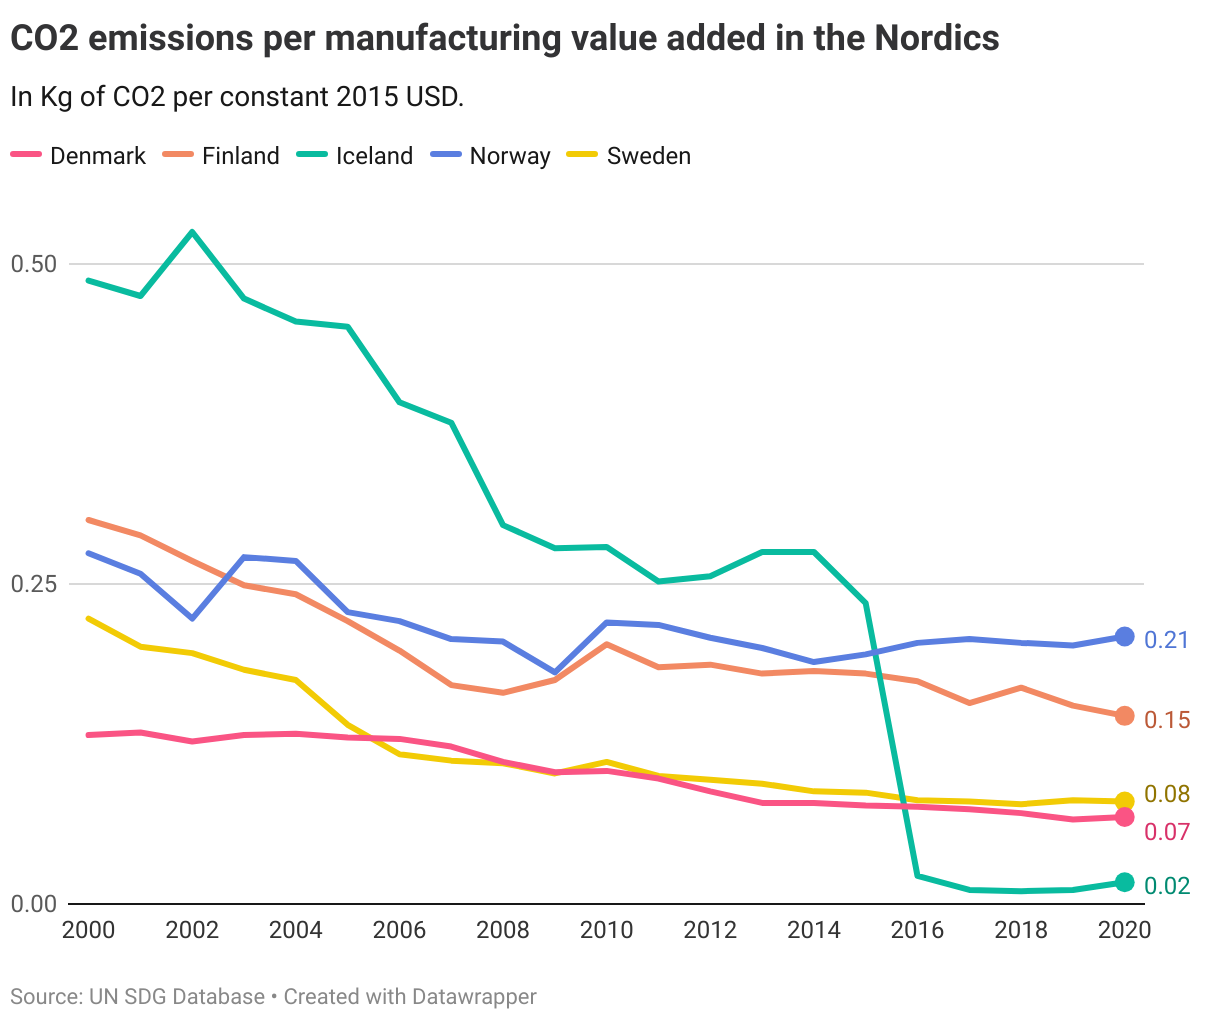
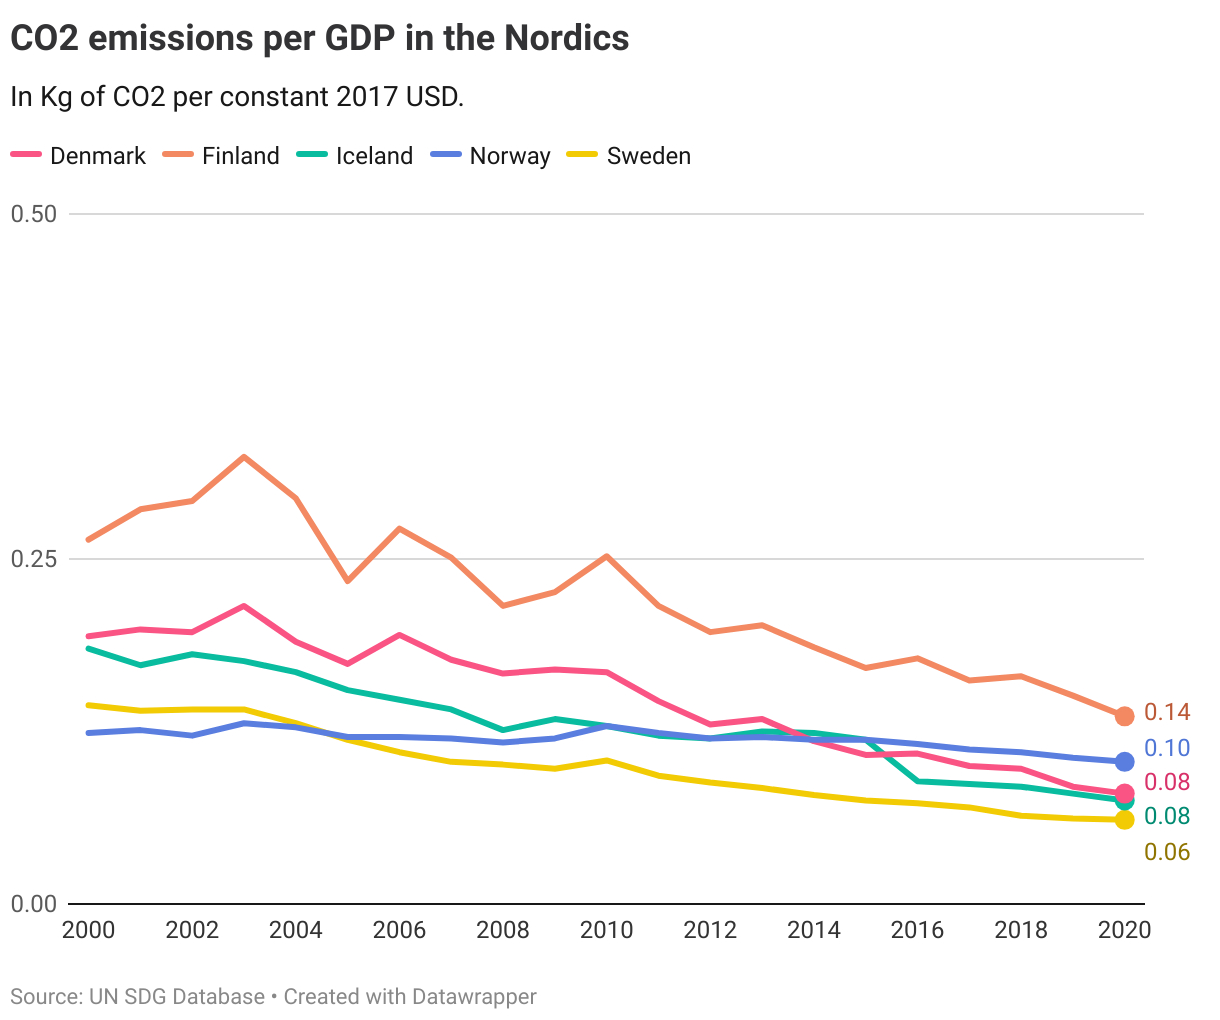
Denmark
Target is met
Finland
Target is met
Iceland
Long distance to target but progressing
Norway
Long distance to target but progressing
Sweden
Target is met
Target 9.5
Enhance scientific research, upgrade the technological capabilities of industrial sectors in all countries, in particular developing countries, including, by 2030, encouraging innovation and substantially increasing the number of research and development workers per 1 million people and public and private research and development spending
| 9.5.1 | Research and development expenditure as a proportion of GDP |
| 9.5.2 | Researchers (in full-time equivalent) per million inhabitants |
Global trends
9.5.1. R&D expenditures
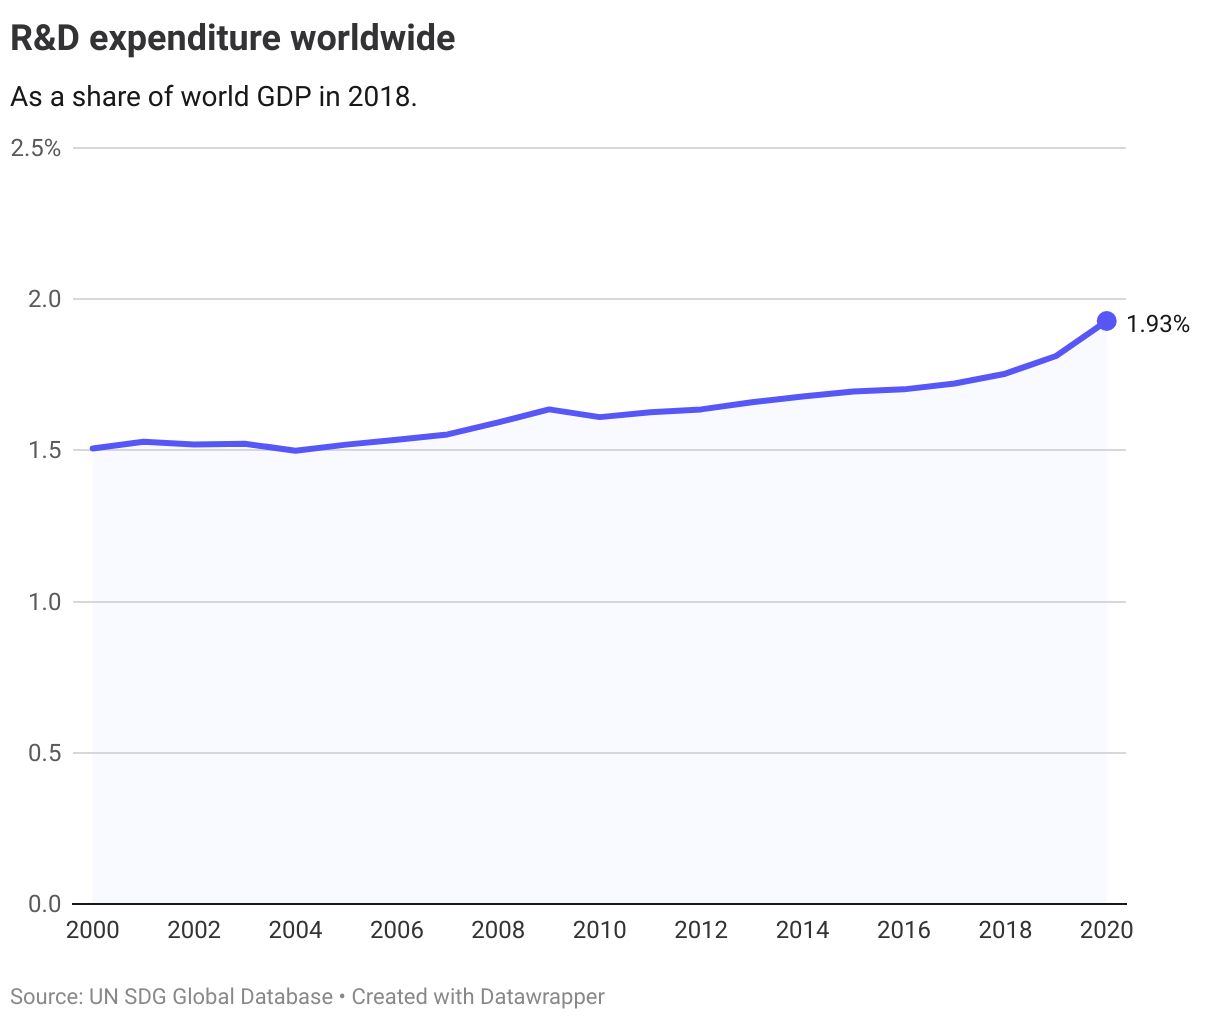
Government spending on research and development (R&D) as a share of GDP has seen an increase since 2015 globally from 1.69% to 1.93% in 2020. Note that no numerical target is set for 2030 for this indicator.
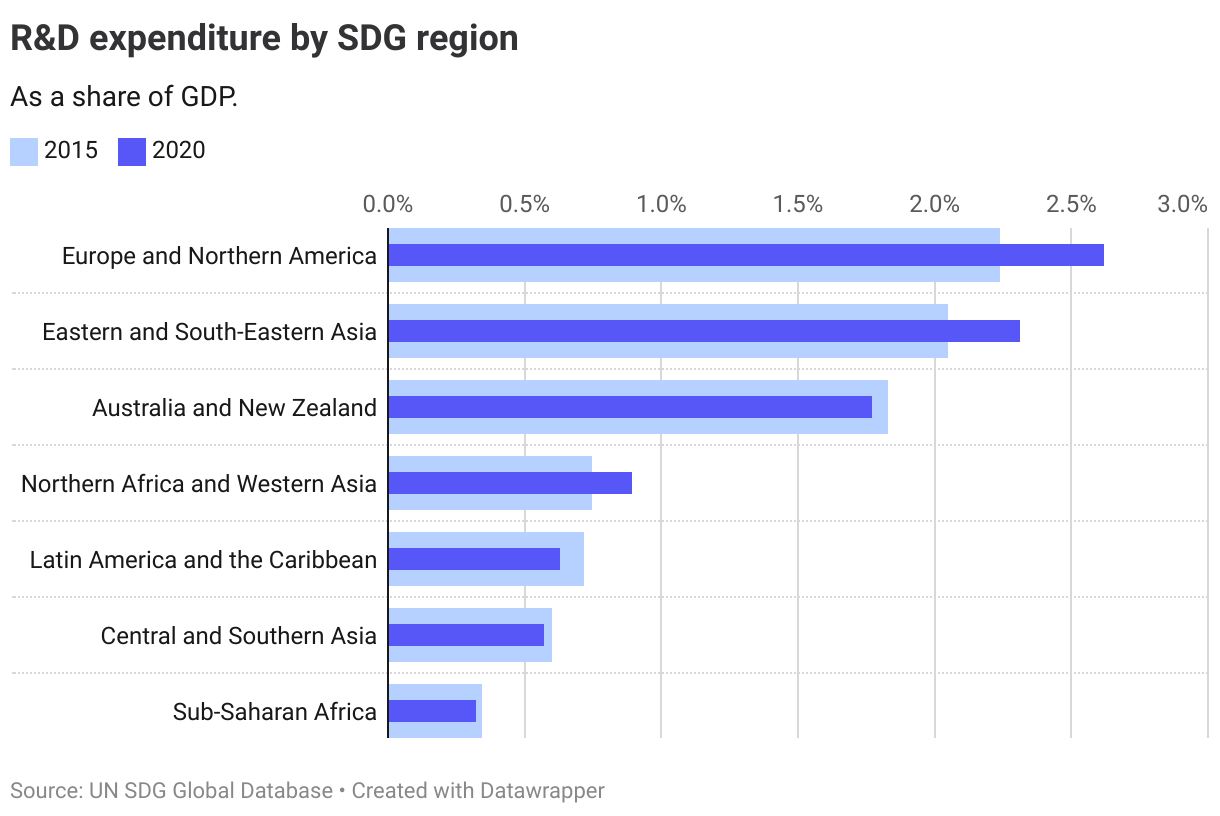
R&D spending was highest in Europe and Northern America and Eastern and South-Eastern Asia. Since 2015 both these regions have seen their R&D spending shares increase. In the three SDG regions with the lowest shares, the R&D shares either declined (Latin America and the Caribbean) or stood still between 2015 and 2020 (Central and Southern Asia and Sub-Saharan Africa).
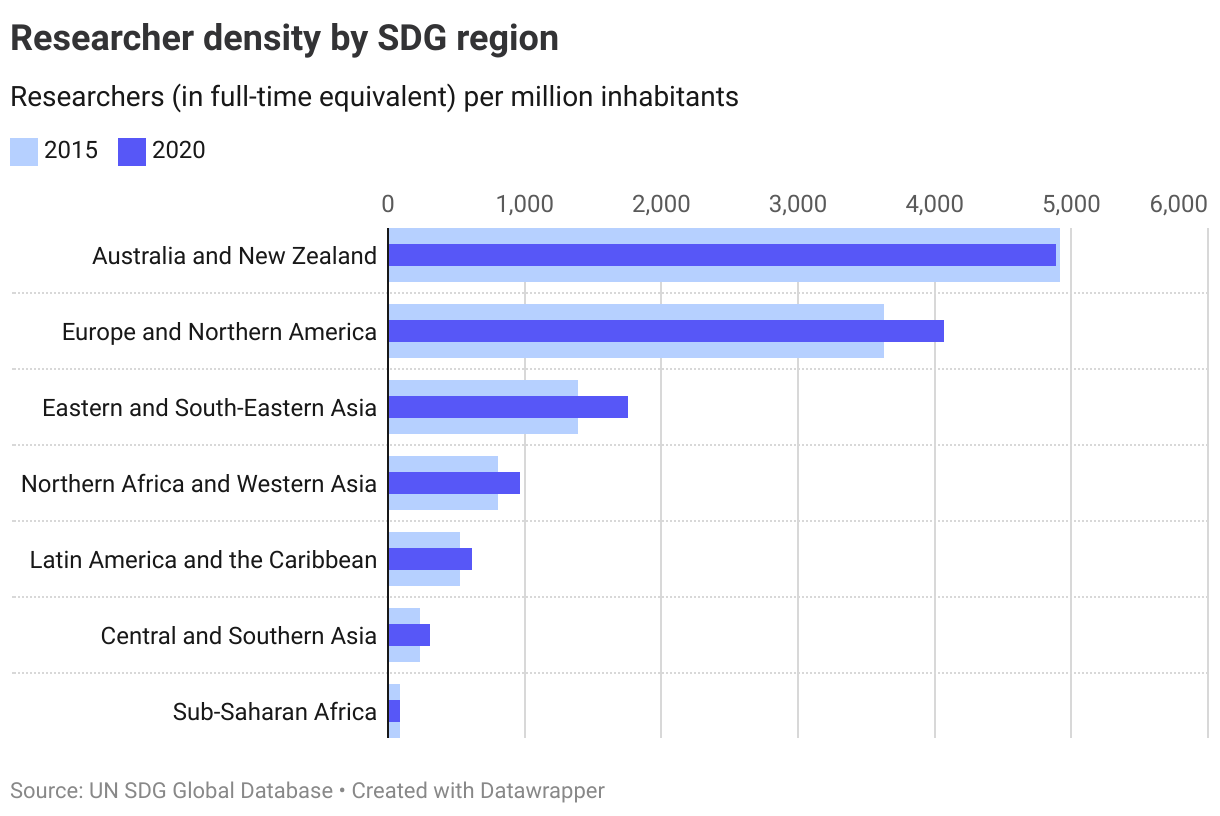
9.5.2. Researcher density
The second indicator in this target aims to substantially increase the number of researchers (measured as the number of researchers per million inhabitants). While no numerical target for 2030 is set, there is a clear trend of increasing researcher density at the global level.
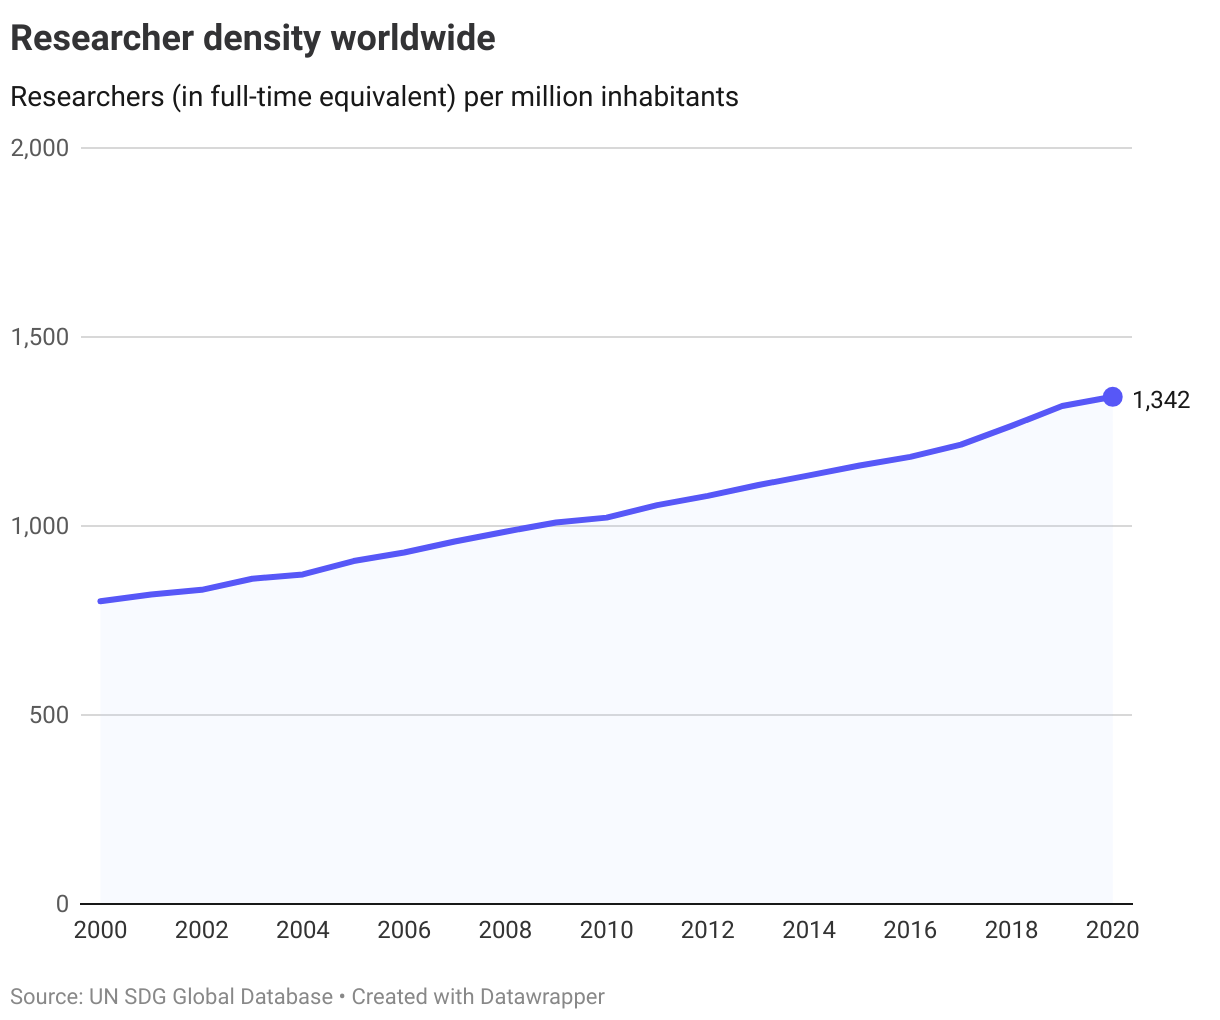
Since 2015, except for Australia and New Zealand, researcher density has increased in all other regions.
The Nordics
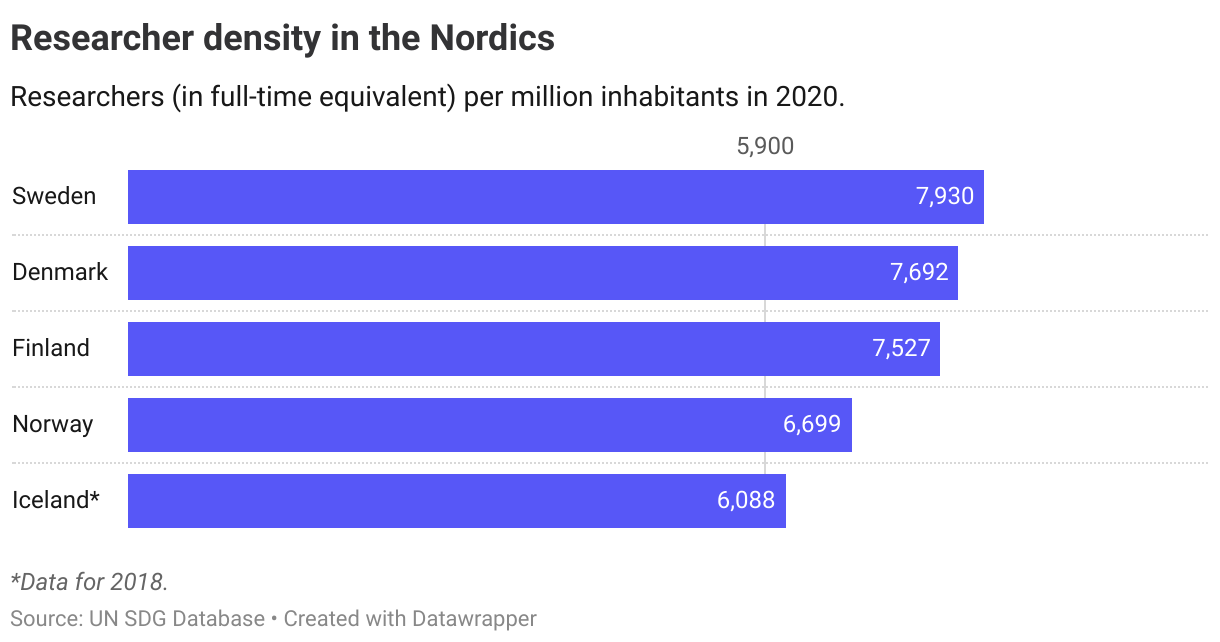
The OECD has operationalised this target at the level of the top OECD performers in 2015. For R&D expenditure this entails a target level of 3.3%, while for researcher density the target is set at 5 900 researchers per million inhabitants.
Sweden is the only country which has achieved the target level for R&D expenditure as of 2021, while all the Nordics have achieved the target level for researcher density.
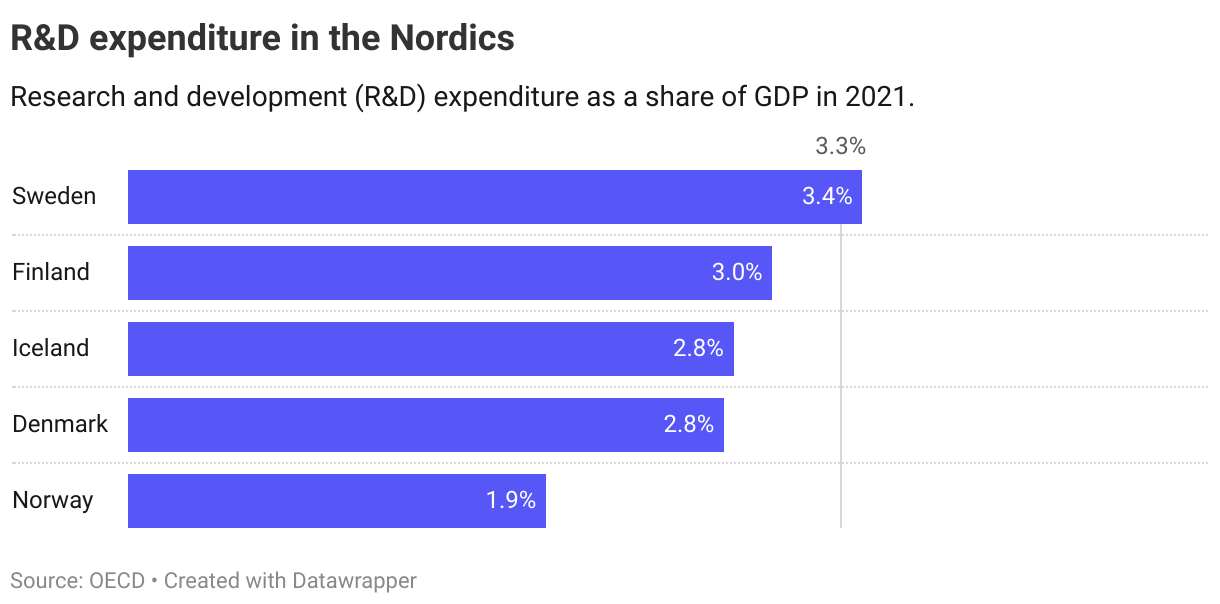
A combined assessment of both indicators shows that all countries are within short distance of the target. While Sweden currently has met both targets, it is not on track to stay above the target level for R&D spending (less than 75% of simulations reach the target level).
Denmark
Short distance to target
Finland
Short distance to target
Iceland
Short distance to target
Norway
Short distance to target
Sweden
Short distance to target
Target 9.a
Facilitate sustainable and resilient infrastructure development in developing countries through enhanced financial, technological and technical support to African countries, least developed countries, landlocked developing countries and small island developing States
| 9.a.1 | Total official international support (official development assistance plus other official flows) to infrastructure |
Global trends
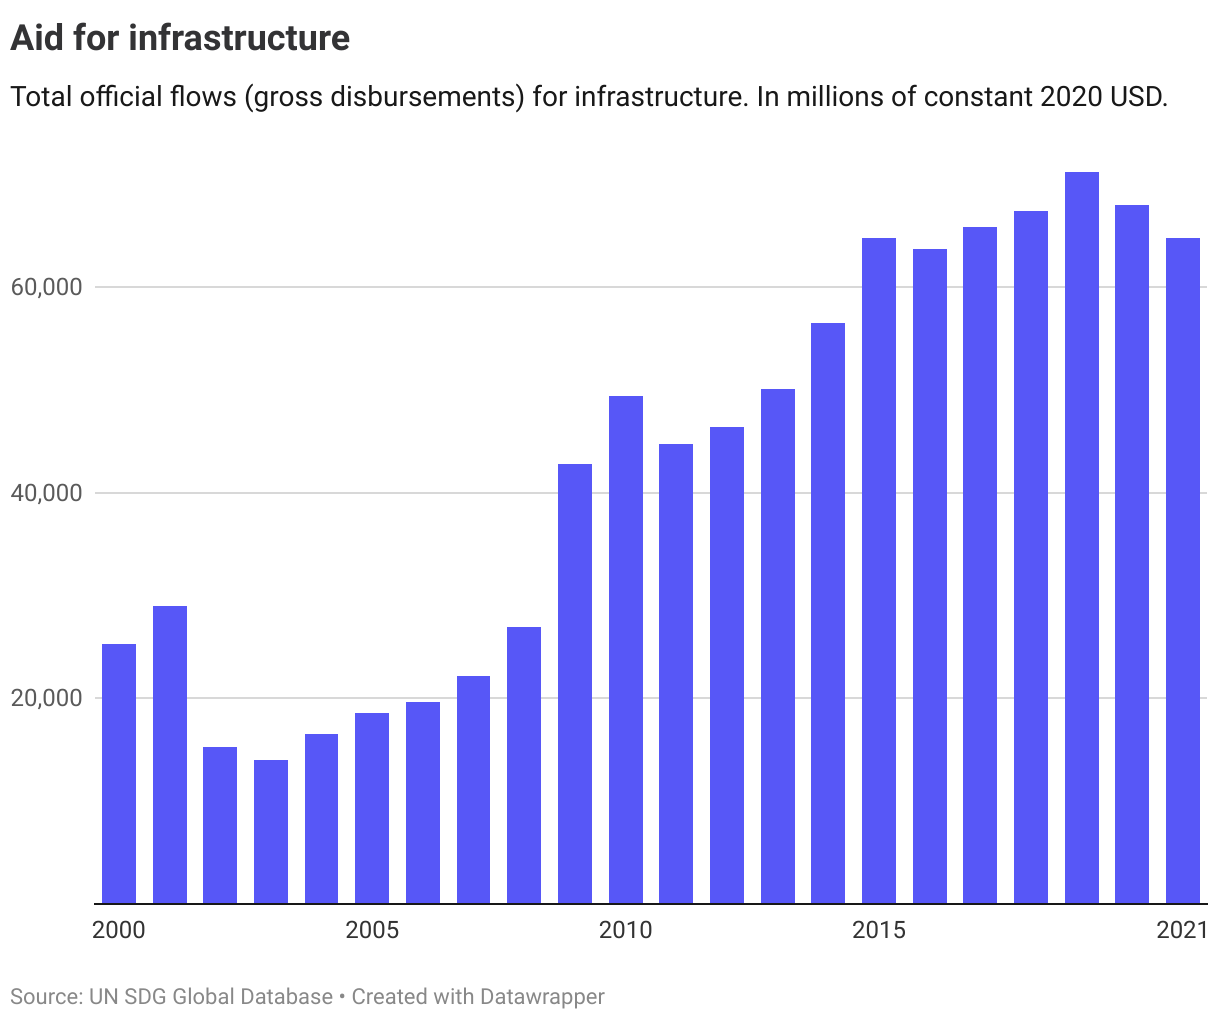
The target sets out a commitment to increase support to developing countries for sustainable infrastructure, however, there is no set numerical target. OECD data show that total aid for infrastructure stood at 65 billion USD in 2021.
The Nordics
As the sectoral distribution of international flows will depend on national contexts, no progress assessment is performed.
Target 9.b
Support domestic technology development, research and innovation in developing countries, including by ensuring a conducive policy environment for, inter alia, industrial diversification and value addition to commodities
| 9.b.1 | Proportion of medium and high-tech industry value added in total value added |
Global trends
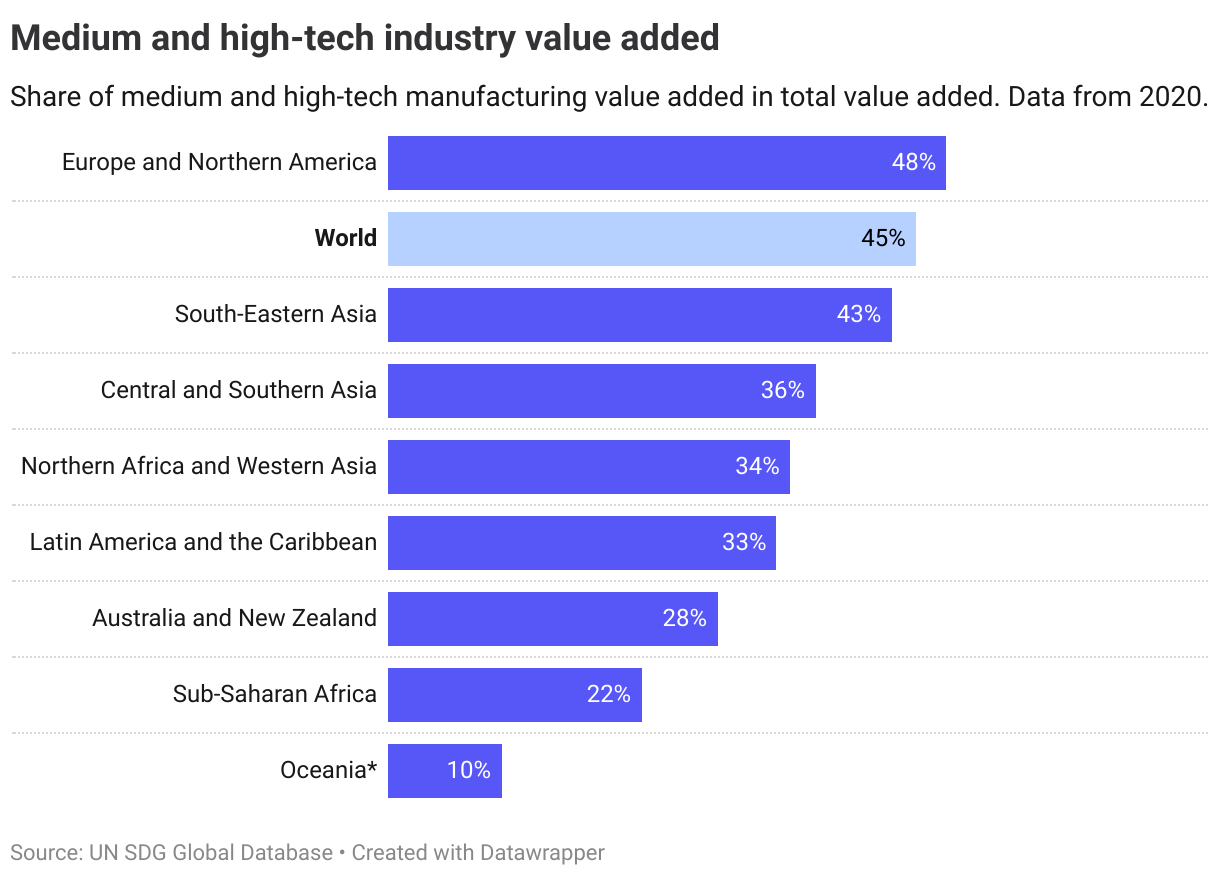
No specific target level is set for 2030 at either the global or national level for this indicator. The latest available data from 2020 show that on average worldwide, medium and high-tech industry contributed 45% to total value added globally.
The Nordics
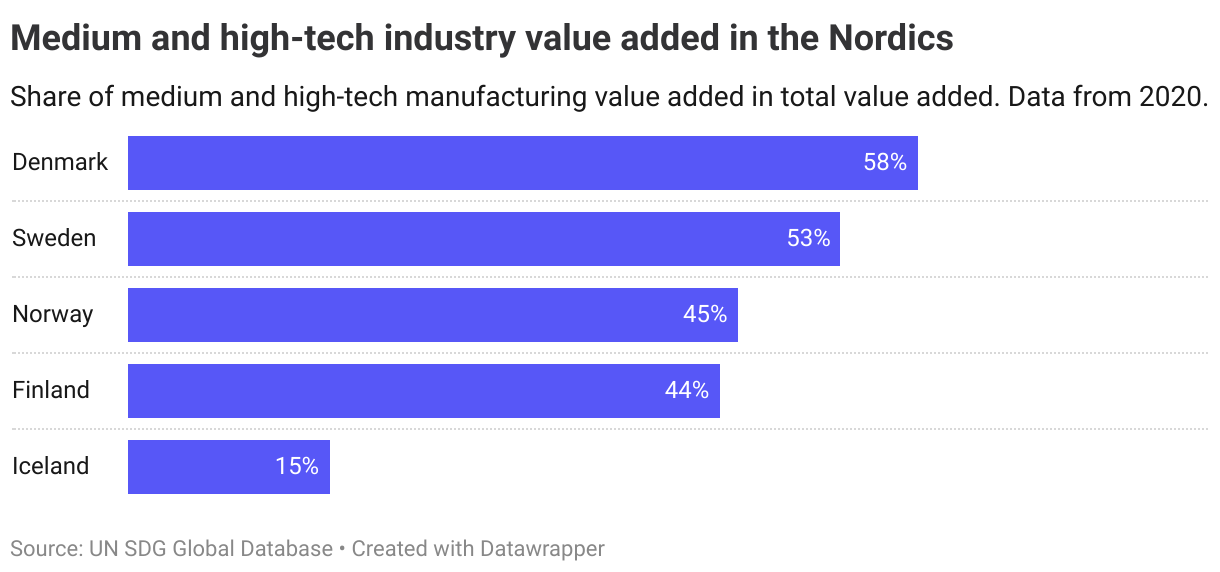
Both Denmark and Sweden are above the average for the Europe and Northern America region. Iceland is significantly lower, with only a 10% contribution from medium and high-tech manufacturing in total value added.
No assessment of progress is given for this indicator as the optimal level will depend on the national context.
Target 9.c
Significantly increase access to information and communications technology and strive to provide universal and affordable access to the Internet in least developed countries by 2020
| 9.c.1 | Proportion of population covered by a mobile network, by technology |
Global trends
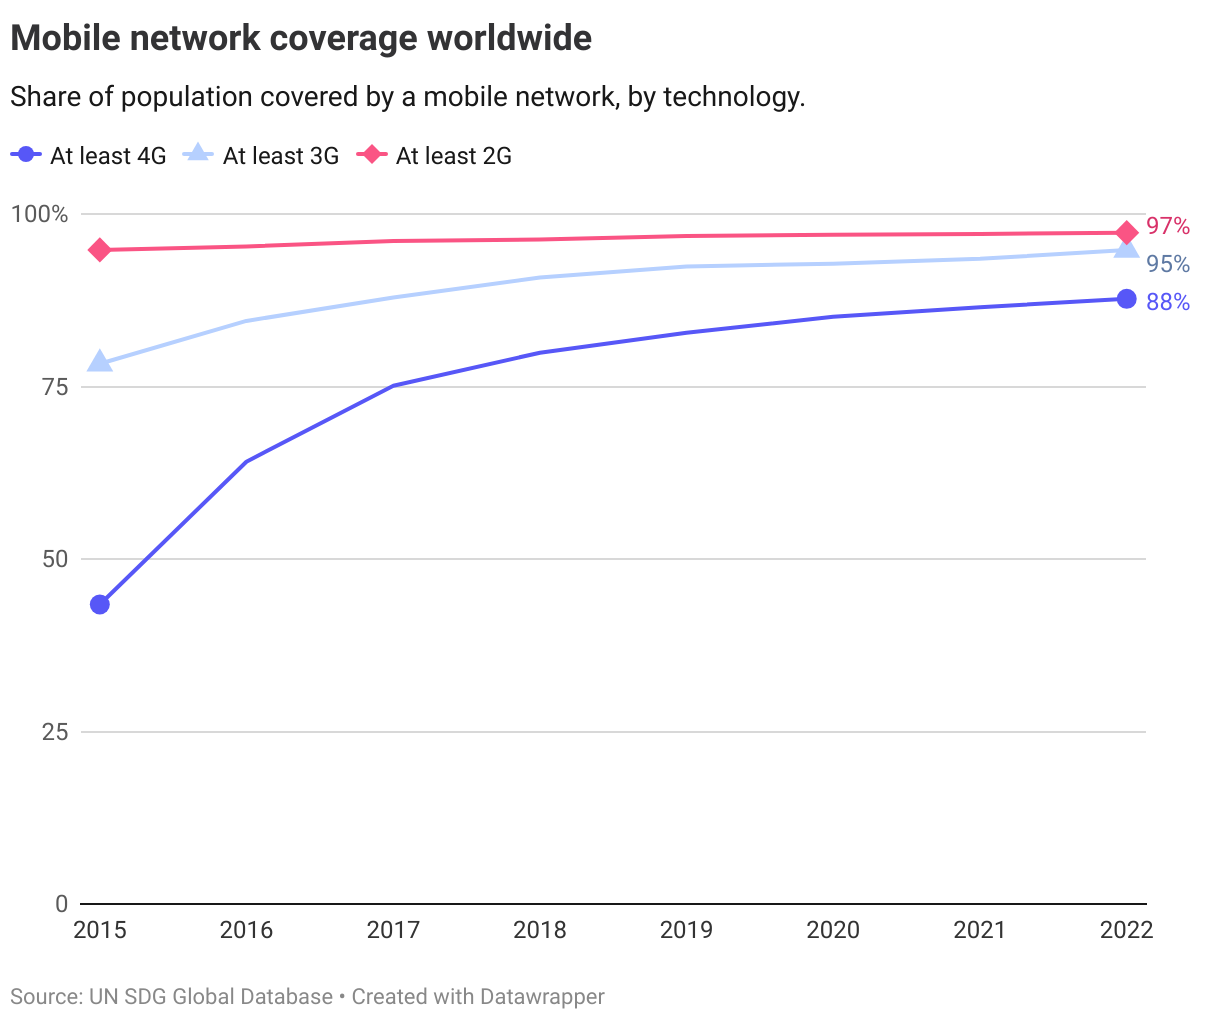
Over the past two decades, mobile network coverage has expanded rapidly. As of 2022, the vast majority of the world population has access to high-speed mobile networks. In just 7 years, 4G technology has increased from a 33% to 88% global coverage rate (no data is yet available on 5G from the SDG global indicator database).
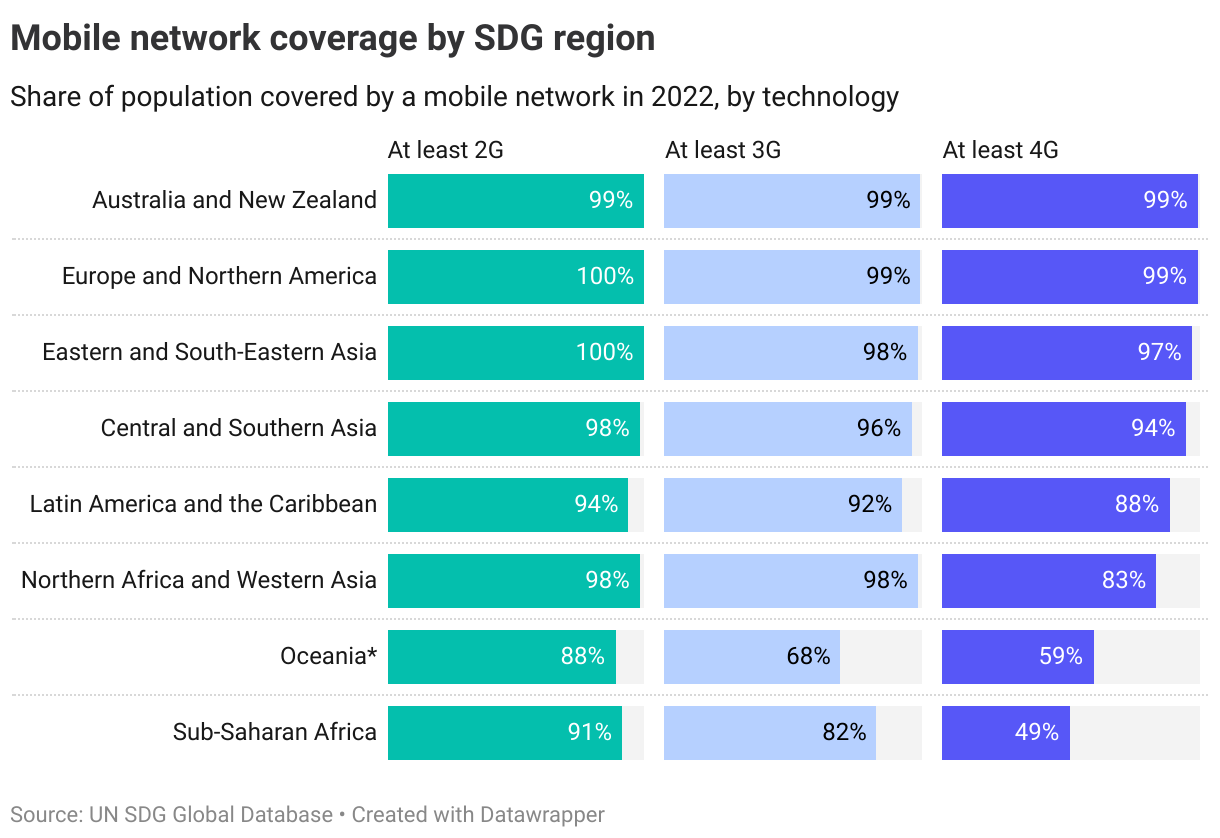
Importantly, there are still access gaps, with for example Sub-Saharan Africa having significantly lower coverage rates of 3G and 4G mobile networks.
The Nordics
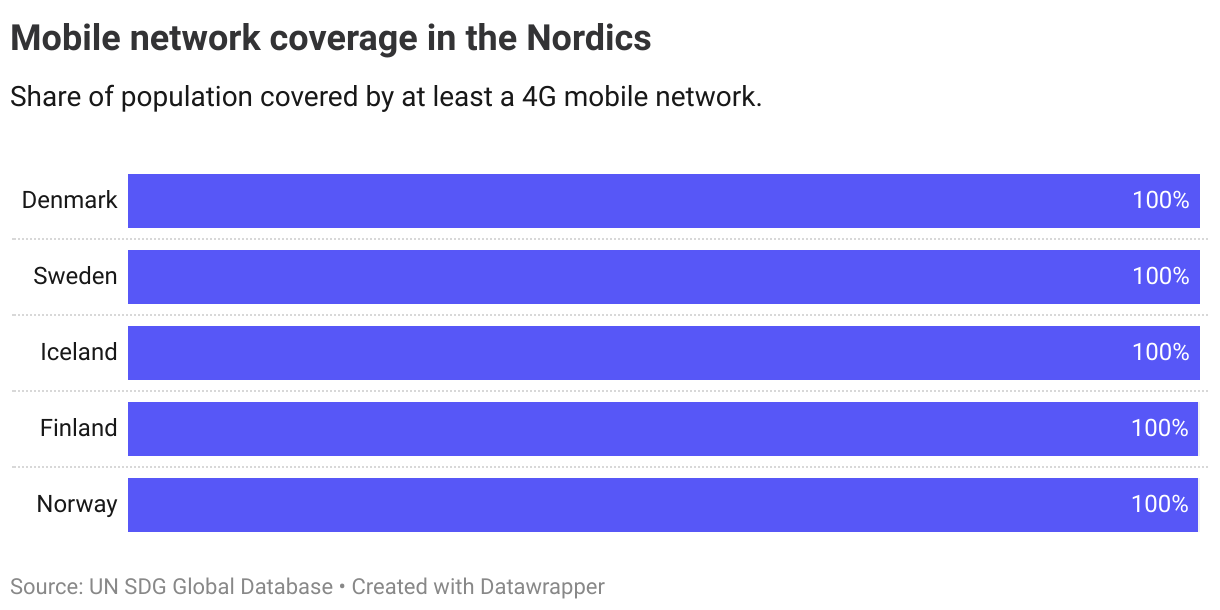
All Nordic countries have achieved universal high-speed mobile network coverage.
Denmark
Target is met
Finland
Target is met
Iceland
Target is met
Norway
Target is met
Sweden
Target is met