

Introduction
This data tracker analyses the Nordic countries’ progress towards achieving Sustainable Development Goal 8: Promote sustained, inclusive and sustainable economic growth, full and productive employment and decent work for all. The goal is comprised of 12 targets.
The Nordic countries – Denmark, Finland, Iceland, Norway and Sweden – are classified into one of five categories for each target:
Met: The country has already met the 2030 target.
On track: The country has not yet met the target but is on track to do so by 2030.
Short distance: The country has not met the target and is not projected to do so but is close to achieving it. This category also applies when the country currently meets the target but is projected to move away from it.
Long distance but progressing: The country is far from the target but is making progress towards it.
Long distance and not progressing: The country is far from the target and is not making progress towards reaching it.
Details on the methodology used, together with the overall assessment for all 17 goals, can be found on our overview page. Note that the analysis is currently work in progress.
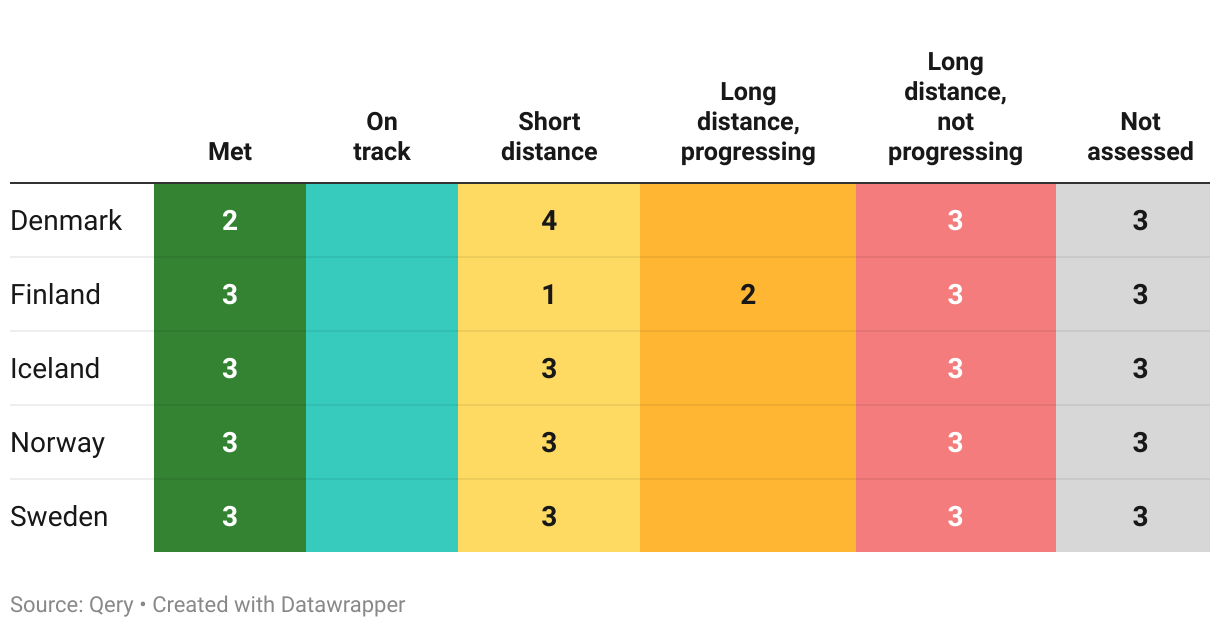
Overall assessment of progress
As of mid-2023, this is our assessment of the Nordic countries progress on the 12 targets part of SDG 8:
The Nordic countries’ performance on the different targets part of this goal can be explored further below. Each section follows the same structure:
- First, the official target text and related indicators is described and the latest global and regional trends are highlighted briefly.
- Second, where data is available, we then zoom in on the Nordic countries to describe how they are progressing, and assess their likelihood of achieving the target by the 2030 deadline.
- Note that both sections above strictly uses data from the UN SDG Global Database and/or the OECD.
Target 8.1
Sustain per capita economic growth in accordance with national circumstances and, in particular, at least 7 per cent gross domestic product growth per annum in the least developed countries
| 8.1.1 | Annual growth rate of real GDP per capita |
Global trends
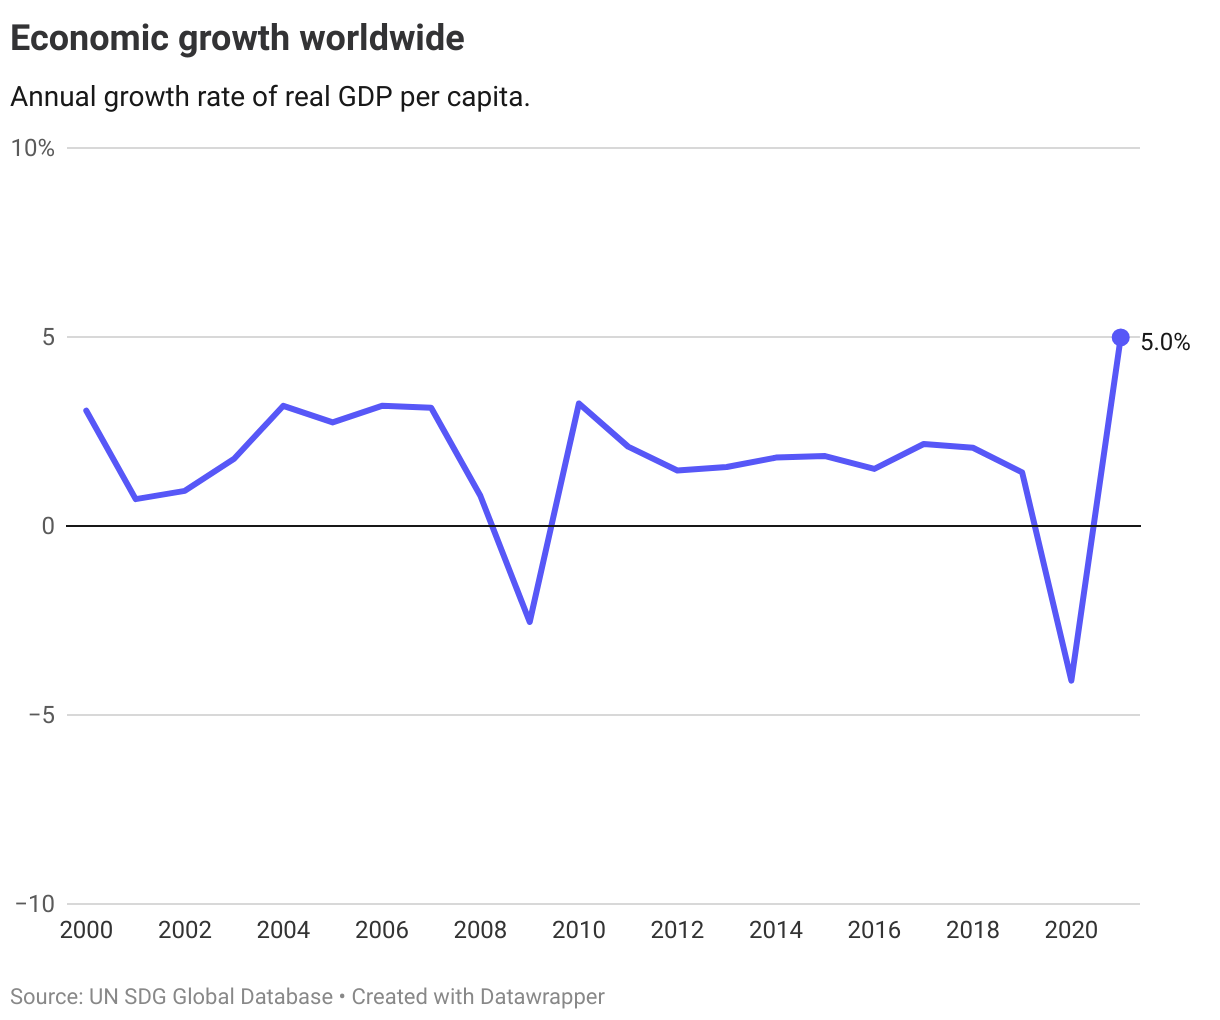
In 2020 global real GDP per capita fell by 4.4%, as the pandemic caused the biggest economic crisis in decades. Global economic growth picked up in 2021, and the trend is forecasted to continue in 2022 and 2023. Still, the pandemic will have lasting economic and social consequences that will take many years to recover from, and likely hamper progress on many SDGs.
With the pandemic a strong contributor, almost all SDG regions had lower average annual GDP per capita growth rates from 2016-2021 than they did from 2010-2015.
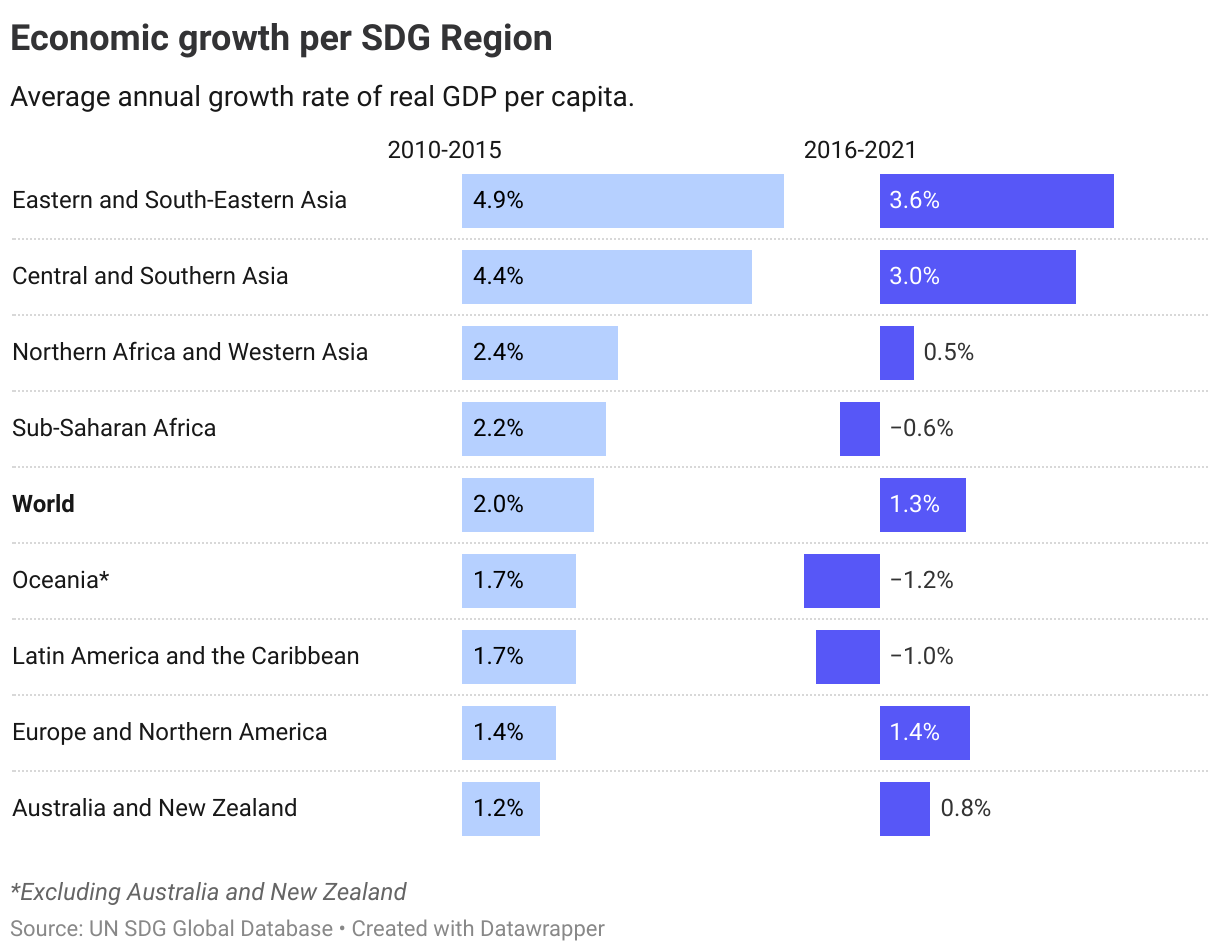
Note that there is no set numerical target in terms of annual growth rates, although the target text specificially mentions at least 7% for least developed countries (LDCs). According to the UN SDG Progress Report for 2023, growth in LDCs stood at 2.8% in 2021 and is expected to fall short of the 7% target in 2023 and 2024.
The Nordics
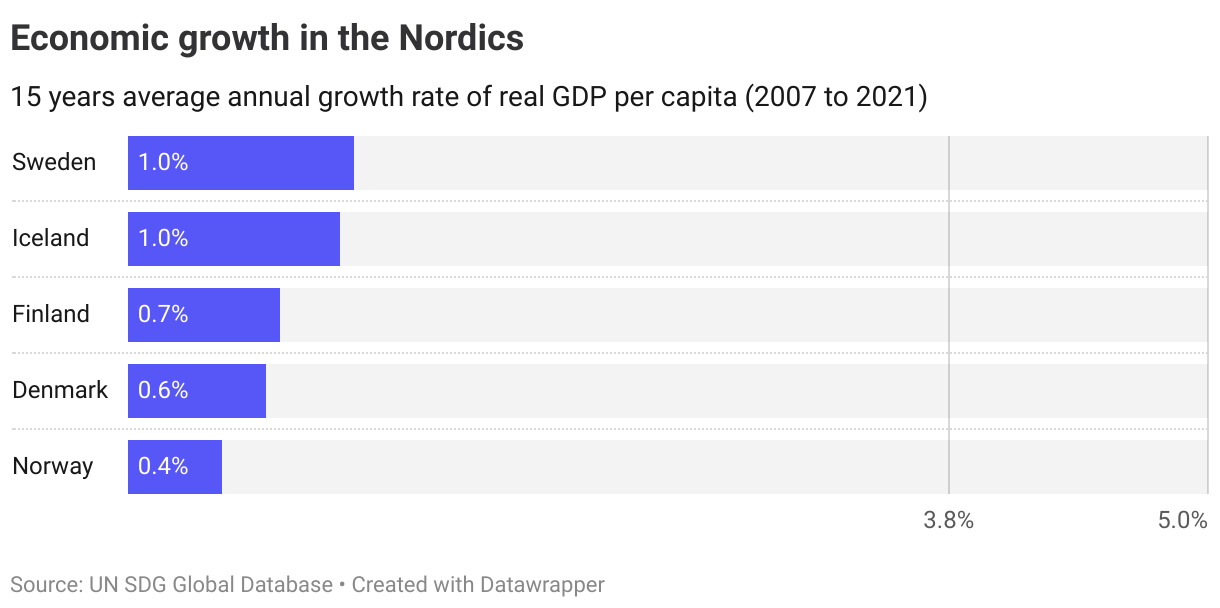
To operationalise this target for OECD countries, the OECD measures progress by looking at the average 15-year GDP per capita growth rate. The benchmark for 2030 is set as the average growth rate from 2000-2015 of the top 4 OECD performers, which gives a target GDP per capita growth rate of 3.8%.
Currently, none of the Nordic countries is close to achieving such growth rates. This is a trend they share with the majority of other OECD countries.
Denmark
Long distance to target, not progressing
Finland
Long distance to target, not progressing
Iceland
Long distance to target, not progressing
Norway
Long distance to target, not progressing
Sweden
Long distance to target, not progressing
Target 8.2
Achieve higher levels of economic productivity through diversification, technological upgrading and innovation, including through a focus on high-value added and labour-intensive sectors
| 8.2.1 | Annual growth rate of real GDP per employed person |
Global trends
While the pandemic caused a decline in labour productivity, it grew by over 2.4% in 2021. However, estimates are that it only increased by 0.5% in 2022.
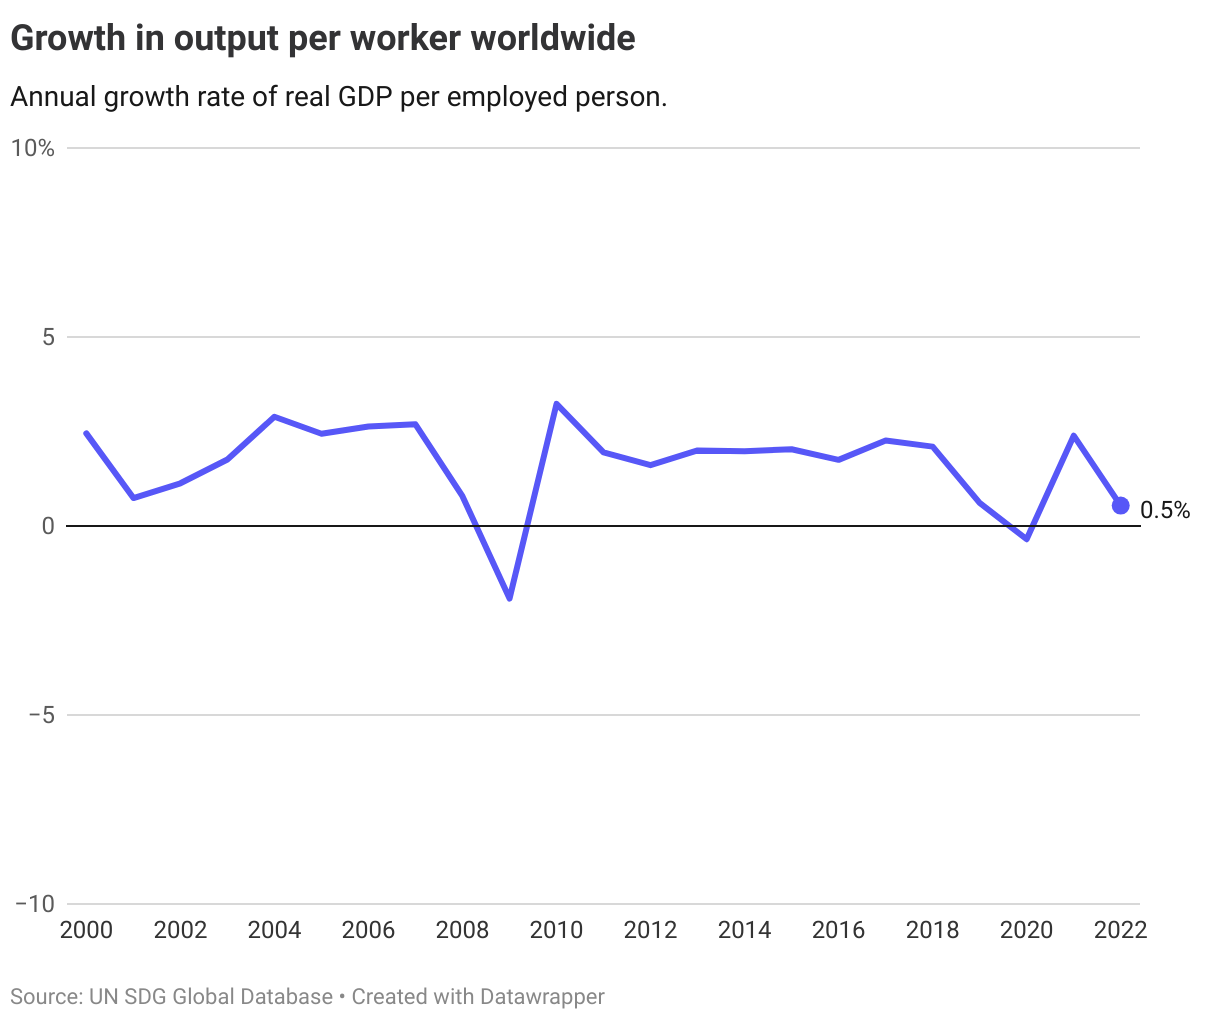
Regional labour productivity data show that Asian regions experienced the highest growth rates both between 2010-2015 and 2016-2021.
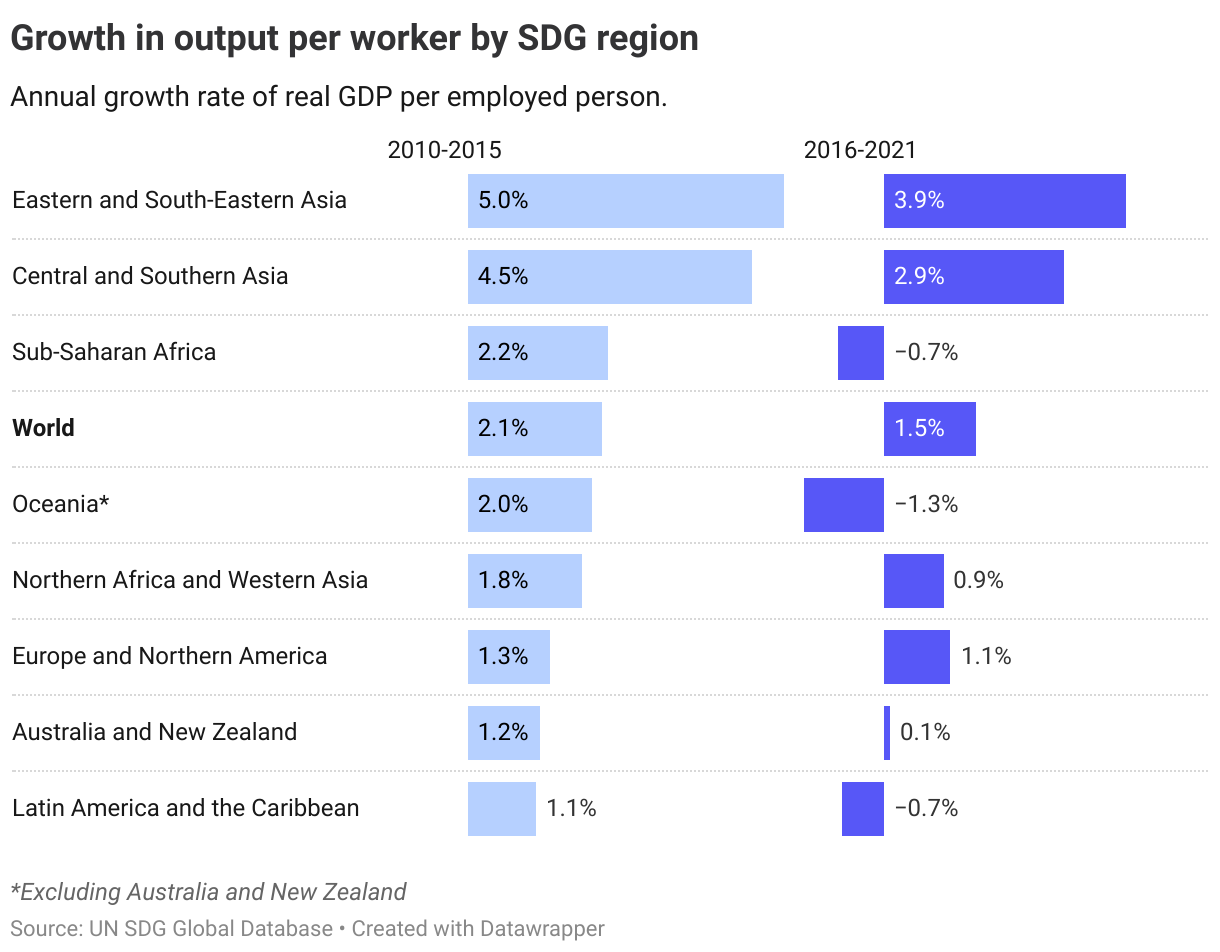
The Nordics
Similarly to target 8.1 on GDP growth per capita, the OECD operationalises the labour productivity target by comparing it against average annual growth rate of the top 4 OECD performers from 2000-2015. This gives a target labour productivity growth rate of 3.6% annually.
Based on the latest data all the Nordics are below this level. The overarching trend is that labour productivity growth has slowed over the past two decades, and it will be a challenge to reach the target level.
Denmark
Long distance to target, not progressing
Finland
Long distance to target, not progressing
Iceland
Long distance to target, not progressing
Norway
Long distance to target, not progressing
Sweden
Long distance to target, not progressing
Target 8.3
Promote development-oriented policies that support productive activities, decent job creation, entrepreneurship, creativity and innovation, and encourage the formalization and growth of micro-, small- and medium-sized enterprises, including through access to financial services
| 8.3.1 | Proportion of informal employment in total employment, by sector and sex |
Global trends
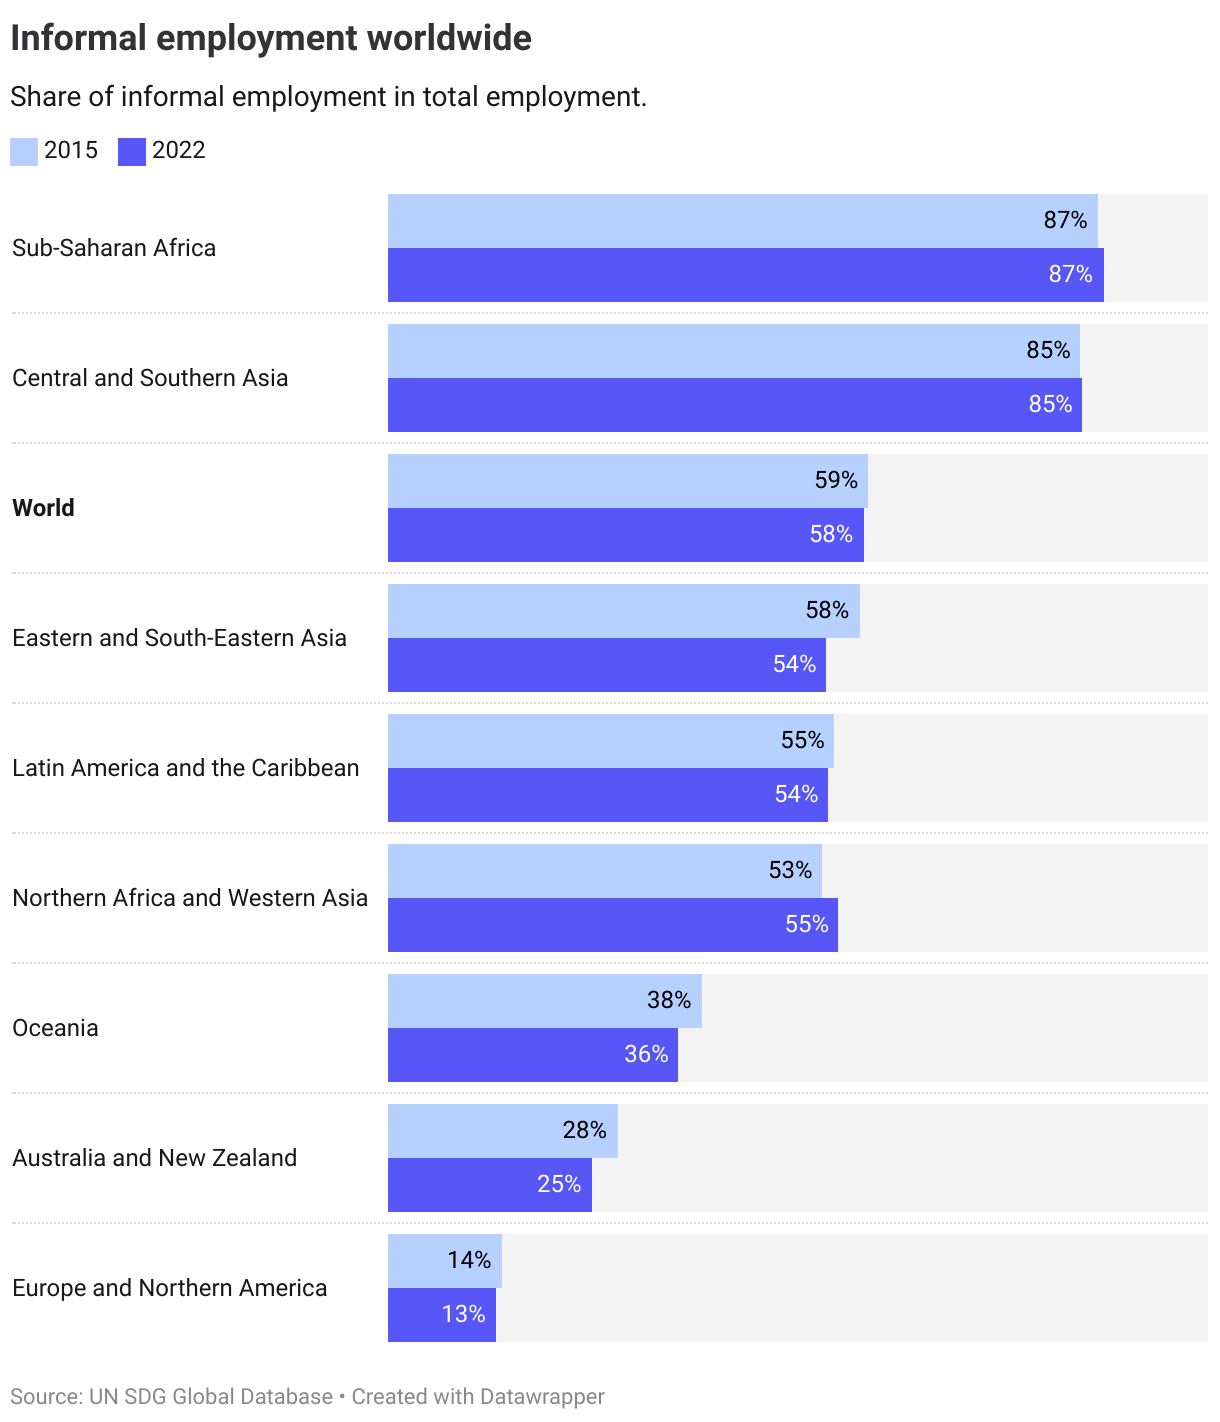
The latest UN data from 2022 shows the informal economy accounted for 58% of global employment, which entails that the majority of employed persons around the world work in the informal economy.
Compared to 2015, no region have seen substantial declines in the informal employment shares. The highest shares were found in Central and Southern Asia (86%), with the lowest in Europe and Northern America (19%).
Informal employment is especially prevalent in the agricultural, forestry and fishing sector, where 9 out of 10 employed persons worldwide work in the informal sector. Integrating more employees and business owners in the formal economy is essential to improve working life, job quality and give more people access to social protection systems.
The Nordics
The share of informal employment is lower in the Nordics than the average for Europe and Northern America. The latest data shows that it is highest in Denmark and lowest in Iceland. All countries have seen their rates decline since 2015.
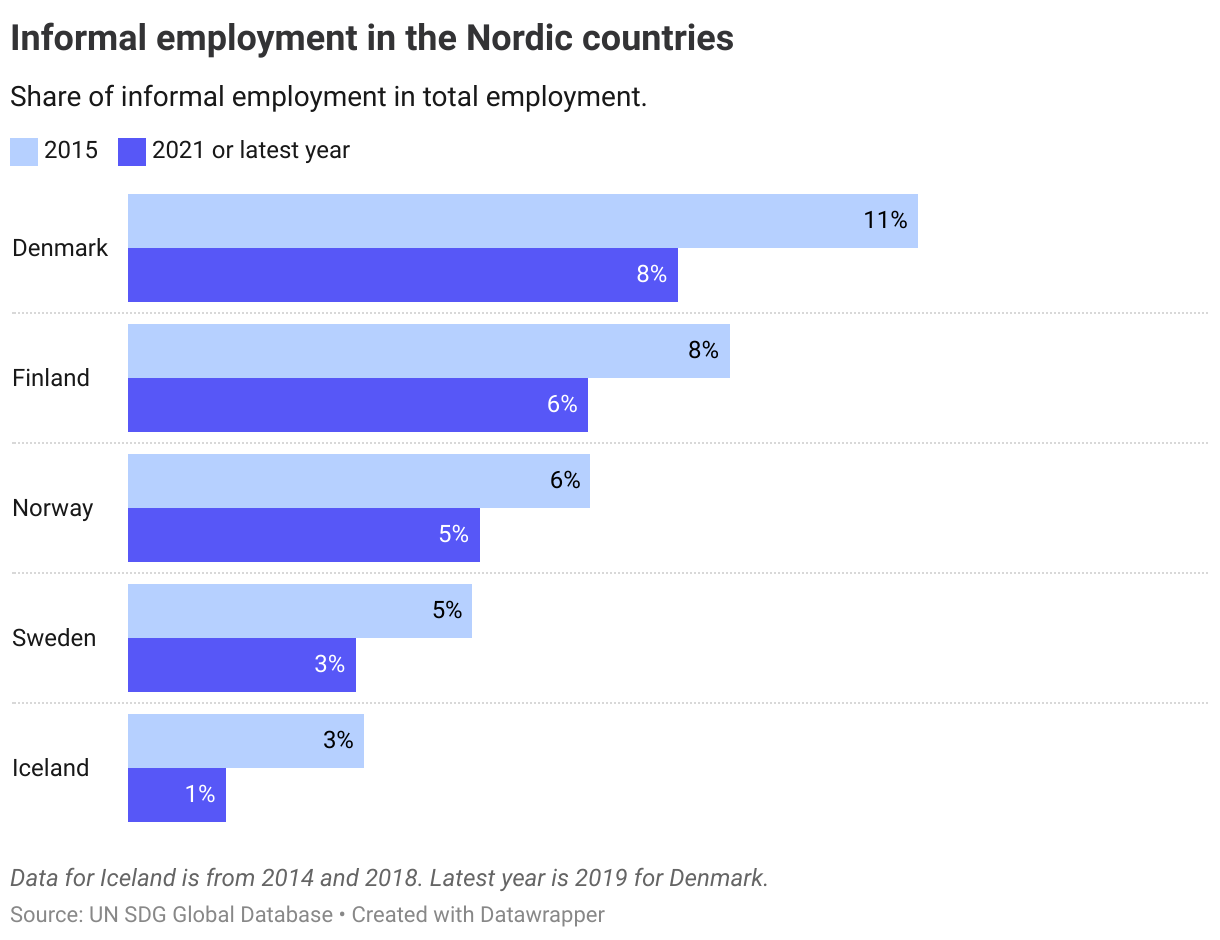
As there is no set target value, the target is operationalised as the average of the top three OECD performers in 2015 which gives a target level of 3%. Currently, only Iceland is on track to achieve the target level by 2030.
Denmark
Short distance to target
Finland
Short distance to target
Iceland
Target is met
Norway
Short distance to target
Sweden
Short distance to target
Target 8.4
Improve progressively, through 2030, global resource efficiency in consumption and production and endeavour to decouple economic growth from environmental degradation, in accordance with the 10-Year Framework of Programmes on Sustainable Consumption and Production, with developed countries taking the lead
| 8.4.1 | Material footprint, material footprint per capita, and material footprint per GDP |
| 8.4.2 | Domestic material consumption, domestic material consumption per capita, and domestic material consumption per GDP |
Global trends
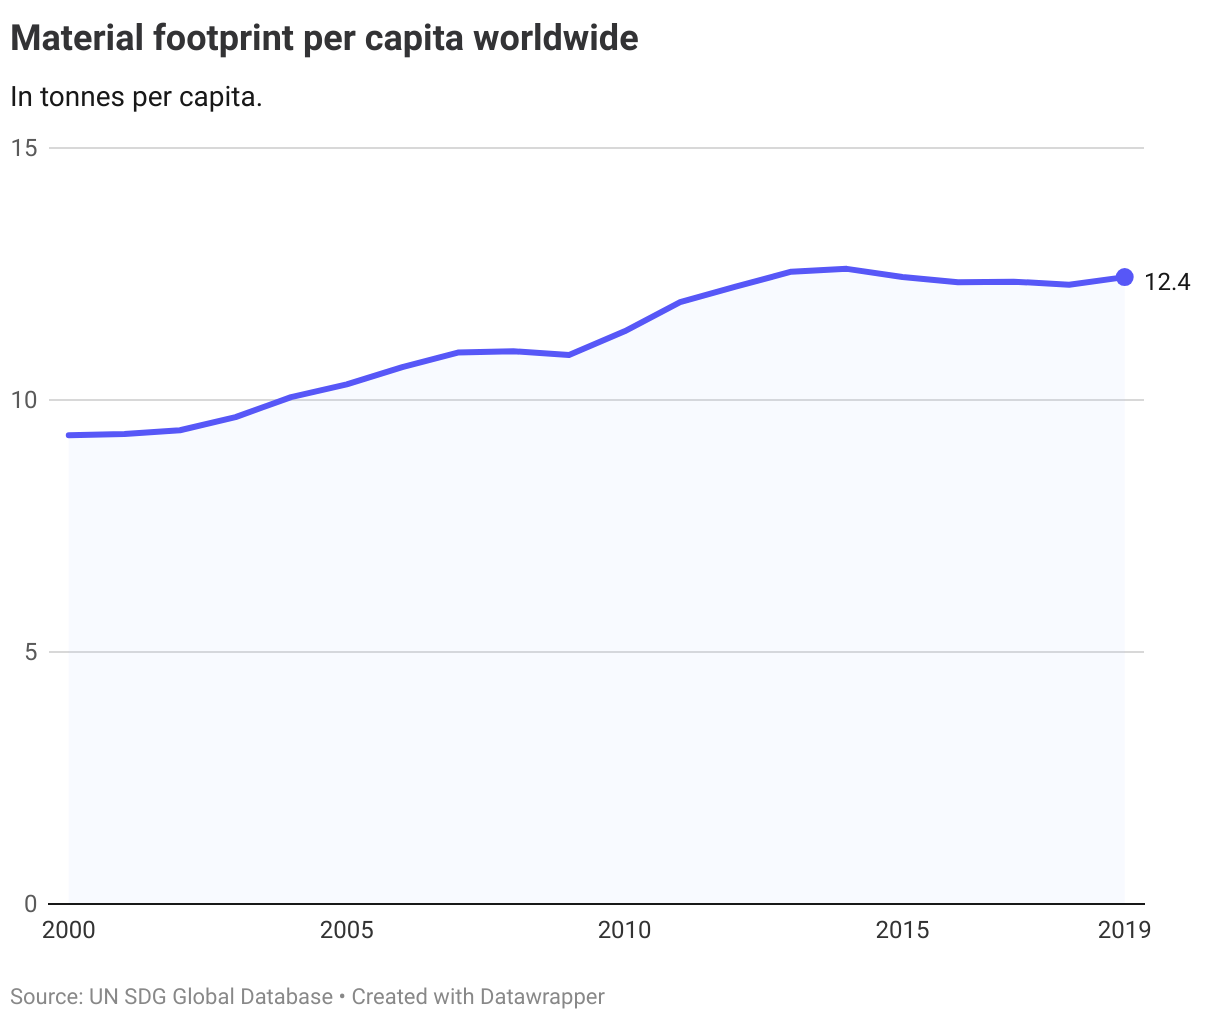
8.4.1. Global material footprint
The global material footprint is the total amount of raw materials extracted to meet final consumption demands. Over the past two decades, it has increased by almost 40 billion tonnes, reaching close to 100 billion tonnes in 2019.
A central challenge over the next decades is to achieve higher levels of resource efficiency so as to decrease the pressure on raw material extraction. Yet, since 2000 there have been only marginal improvements in the amount of raw materials needed per unit of wealth produced. In 2019 this stood at 1.1 kg of raw materials per unit of wealth produced.
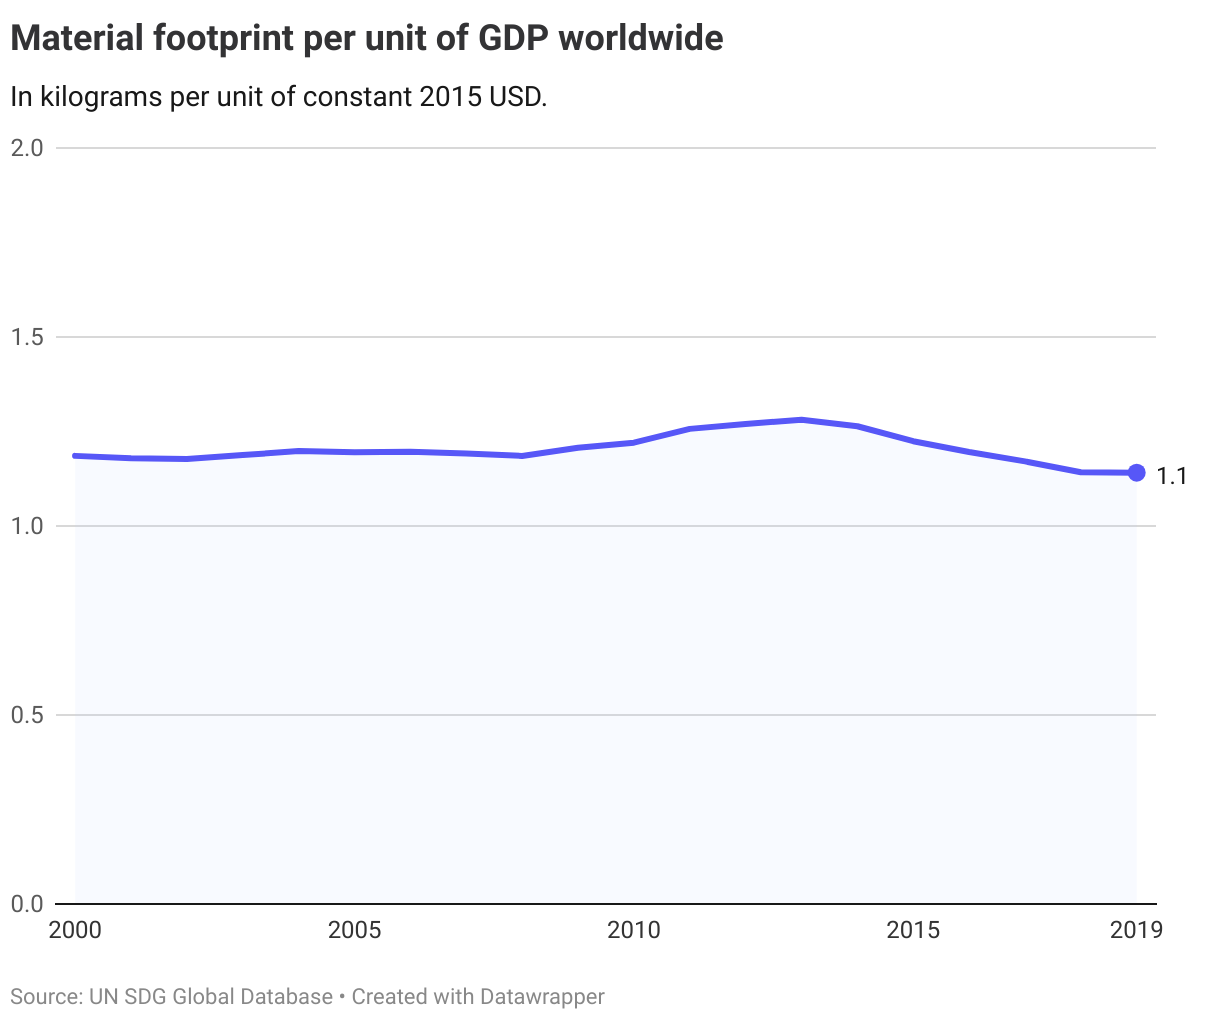
Over the same time period, material footprint per capita has increased by over 30% to 12,4 tonnes (global average) in 2019, which underscores that at the moment there is world is not moving towards improved global resource efficiency.
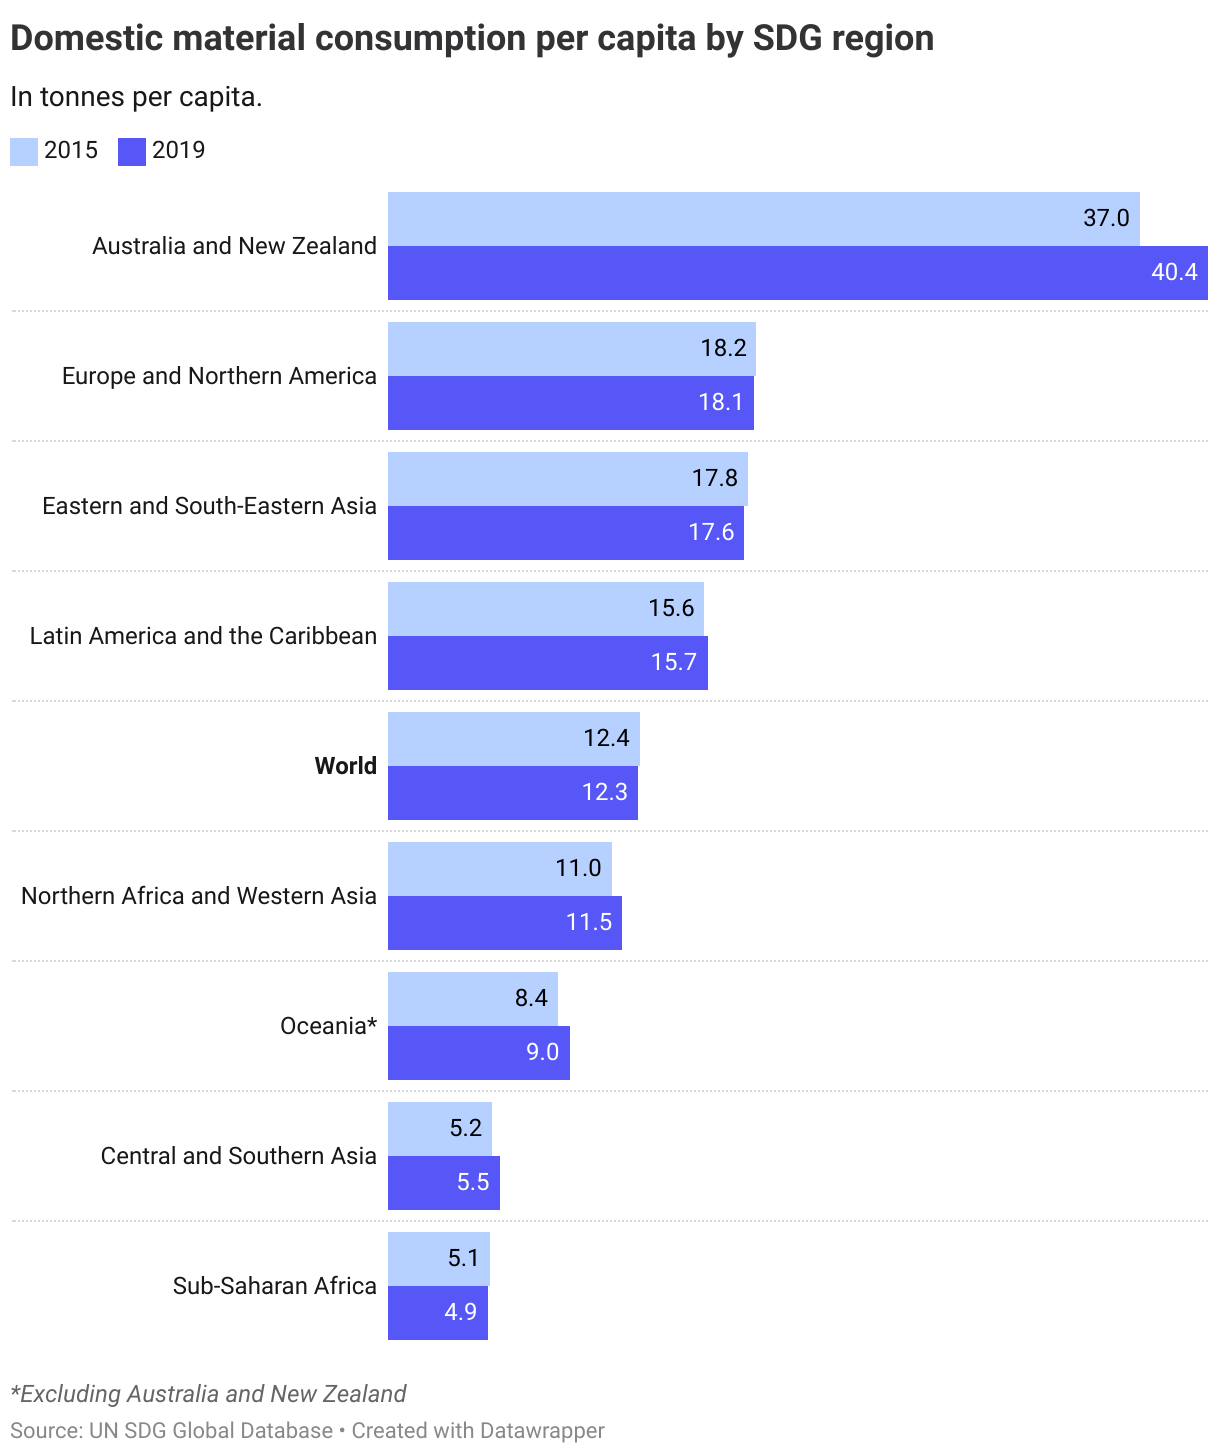
8.4.2 Domestic material consumption
While the first indicator looks at the material footprint at the global level, the second indicator looks at domestic material use. It thus takes into account direct material use inside a country's territory (as well as any direct material imports and exports).
The latest data comparing 2019 with 2015, shows that material productivity has improved slightly worldwide, i.e. less domestic material consumption per unit of wealth produced.
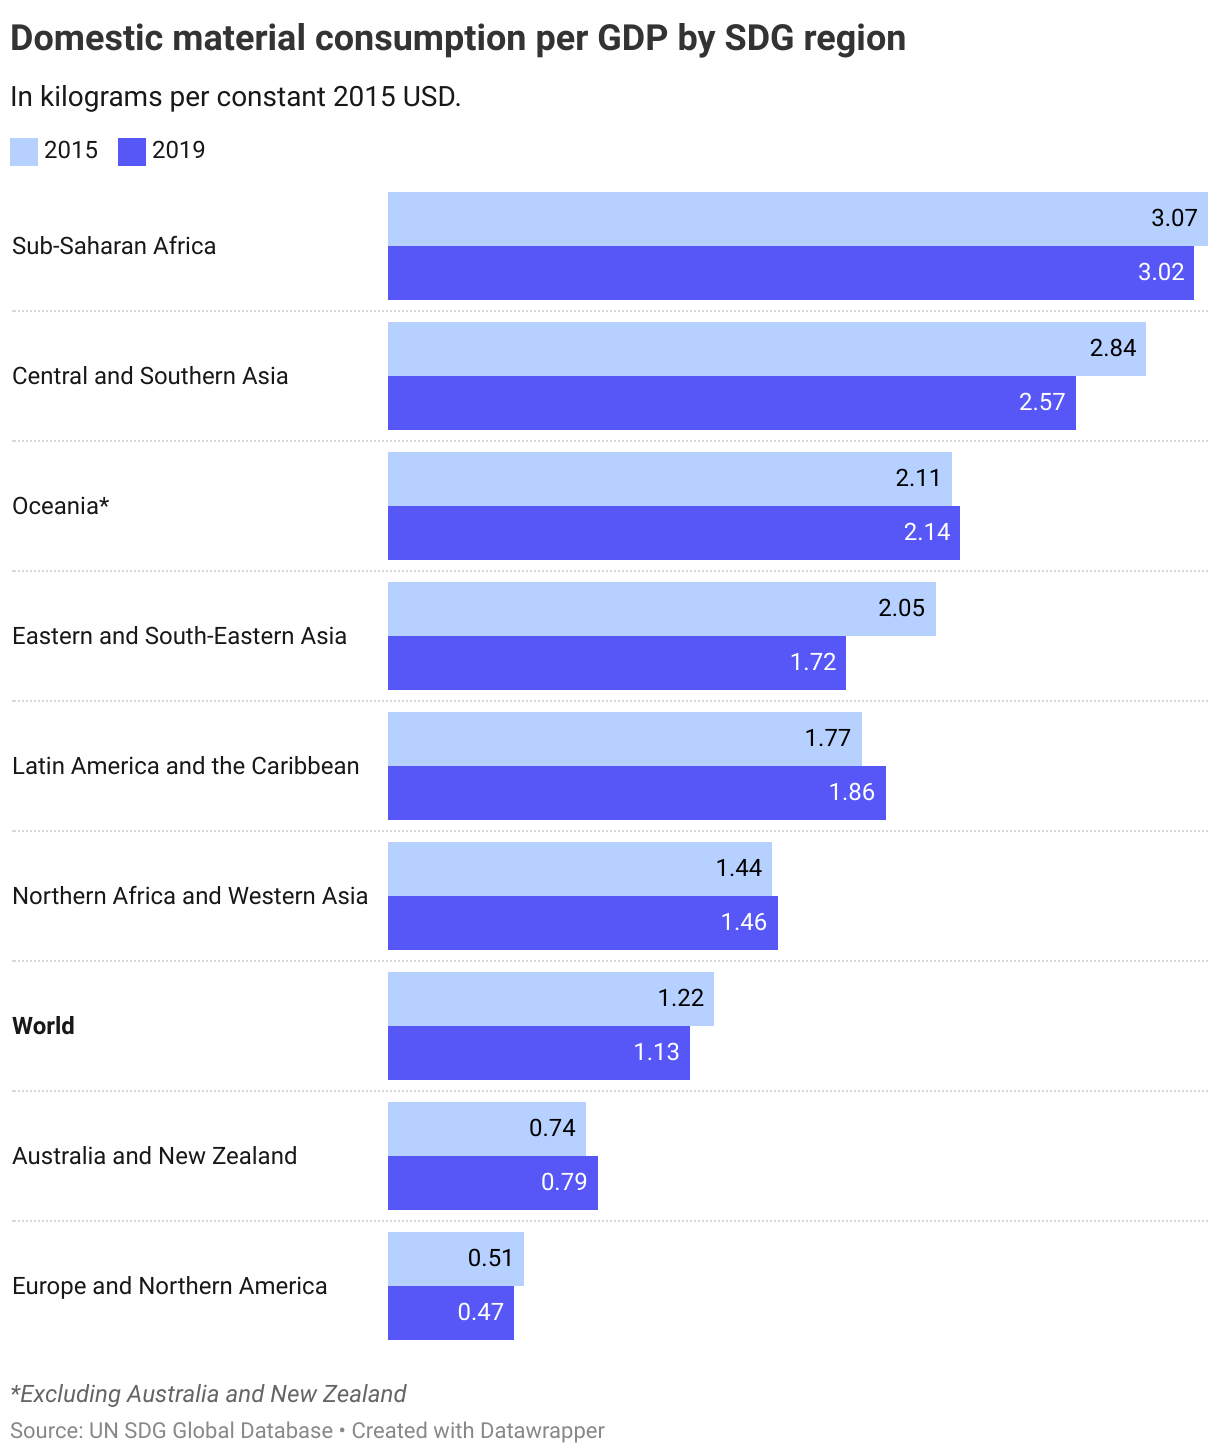
Despite improved material productivity, when measured per capita/per person, the global country-average domestic consumption is more or less unchanged since 2015.
The Nordics
Although the goal is to progressively improve global resource efficiency, there is currently no agreed target level set for 2030 on the indicators discussed above. The OECD has therefore operationalised the target for OECD-countries as the level of domestic material consumption of the top four performers in 2015 which was 0.143 kg per unit of GDP. The most recent data shows that none of the Nordic countries is at or below this level.
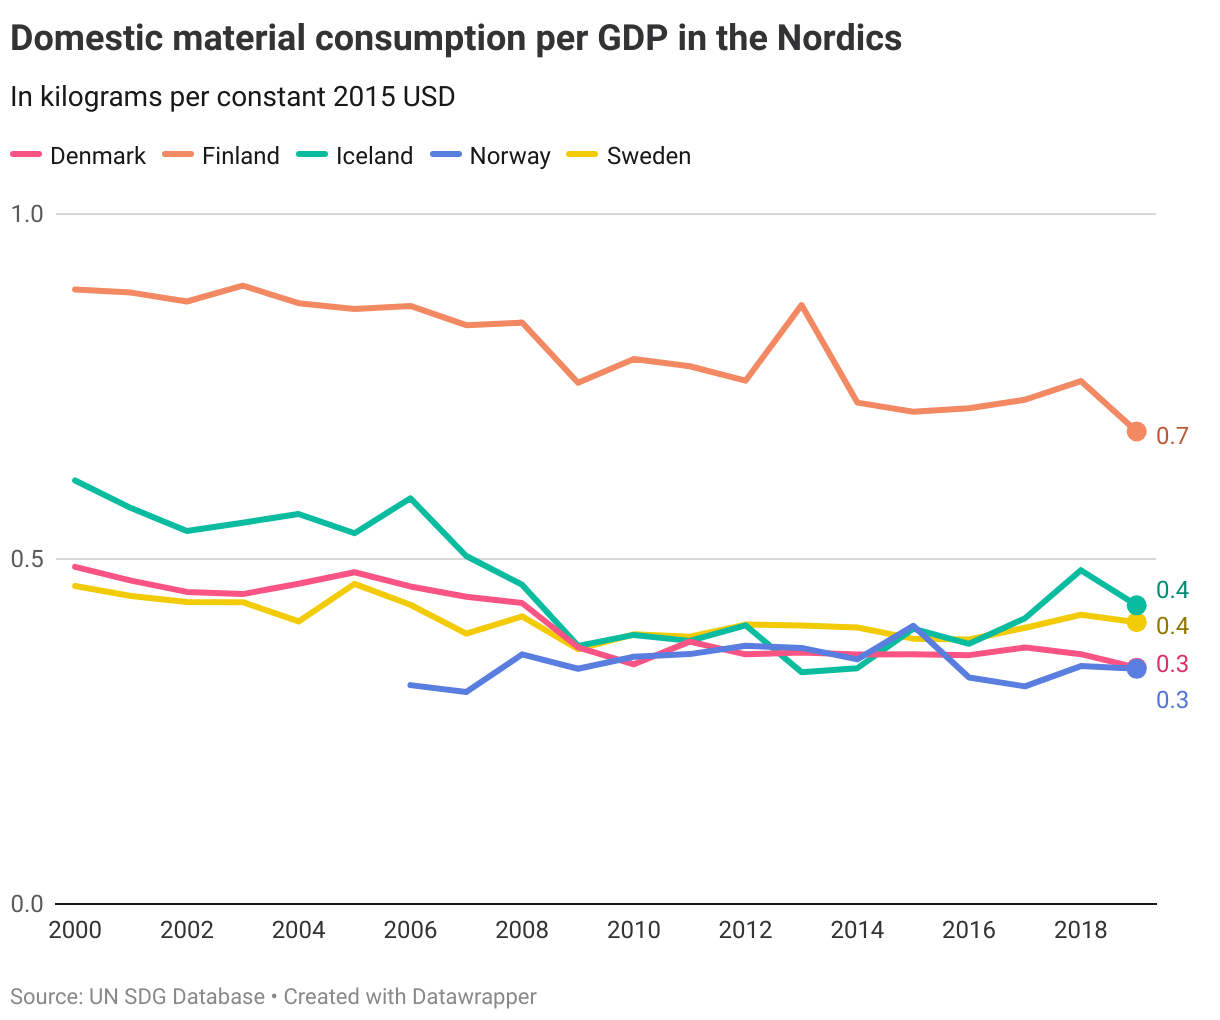
Overall, Denmark, Iceland, Norway and Sweden are at a short distance to the target (less than 0.5 OECD standard deviations away). Finland is at a long distance but is making progress.
Denmark
Short distance to target
Finland
Long distance to target but progressing
Iceland
Short distance to target
Norway
Short distance to target
Sweden
Short distance to target
Target 8.5
By 2030, achieve full and productive employment and decent work for all women and men, including for young people and persons with disabilities, and equal pay for work of equal value
| 8.5.1 | Average hourly earnings of female and male employees, by occupation, age and persons with disabilities |
| 8.5.2 | Unemployment rate, by sex, age and persons with disabilities |
Global trends
No data is available at the global or regional level for average hourly earnings.
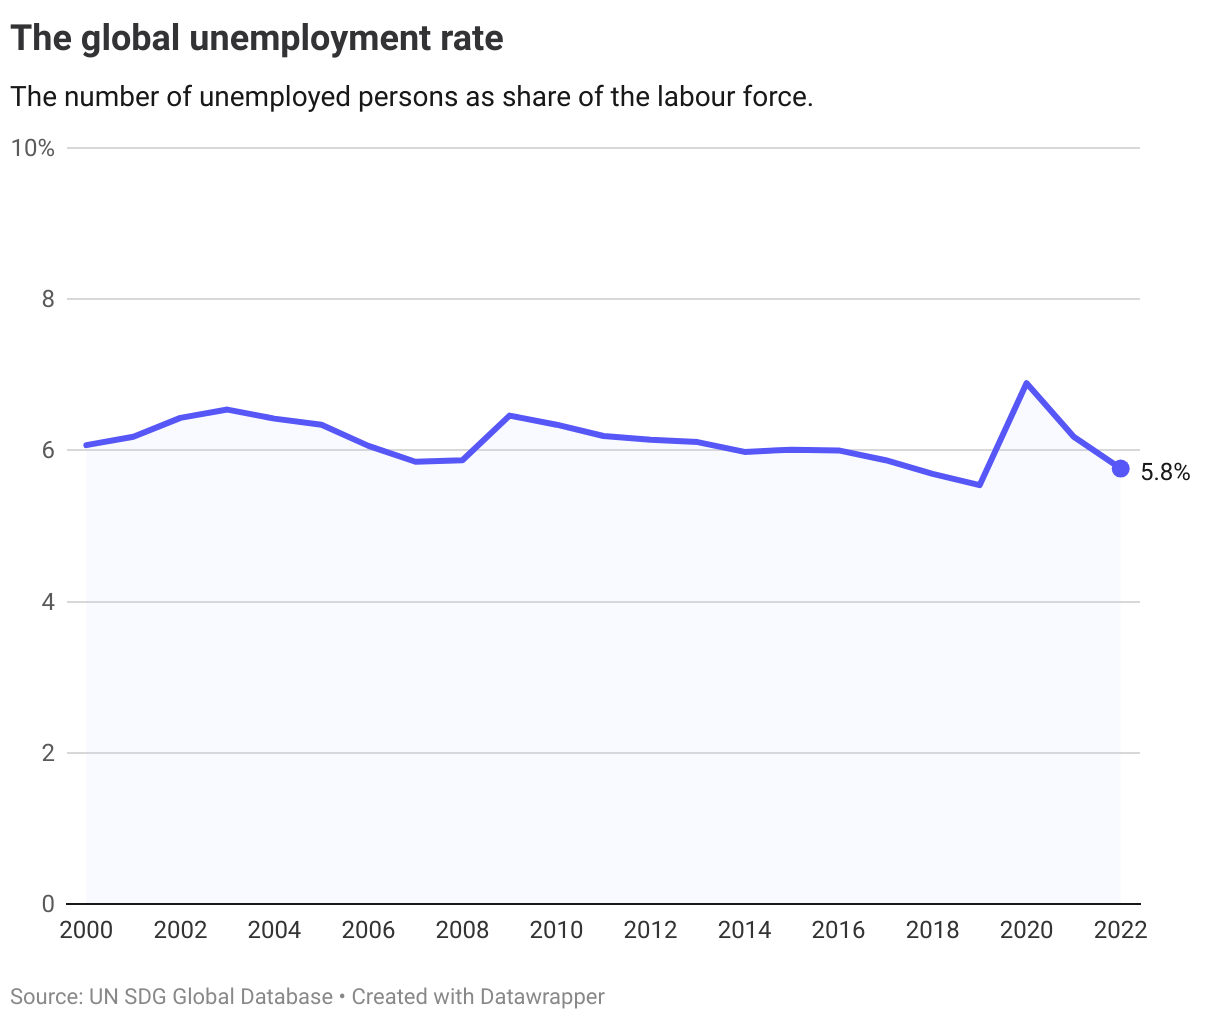
The pandemic pushed the global unemployment rate to its highest level for decades, reaching 6.9% in 2020. While it declined to 6.2% in 2021 and 5.8% in 2022, the pandemic will most likely have long-lasting effects on the labour market and it has pushed the world further away from the SDG target of achieving full employment by 2030.
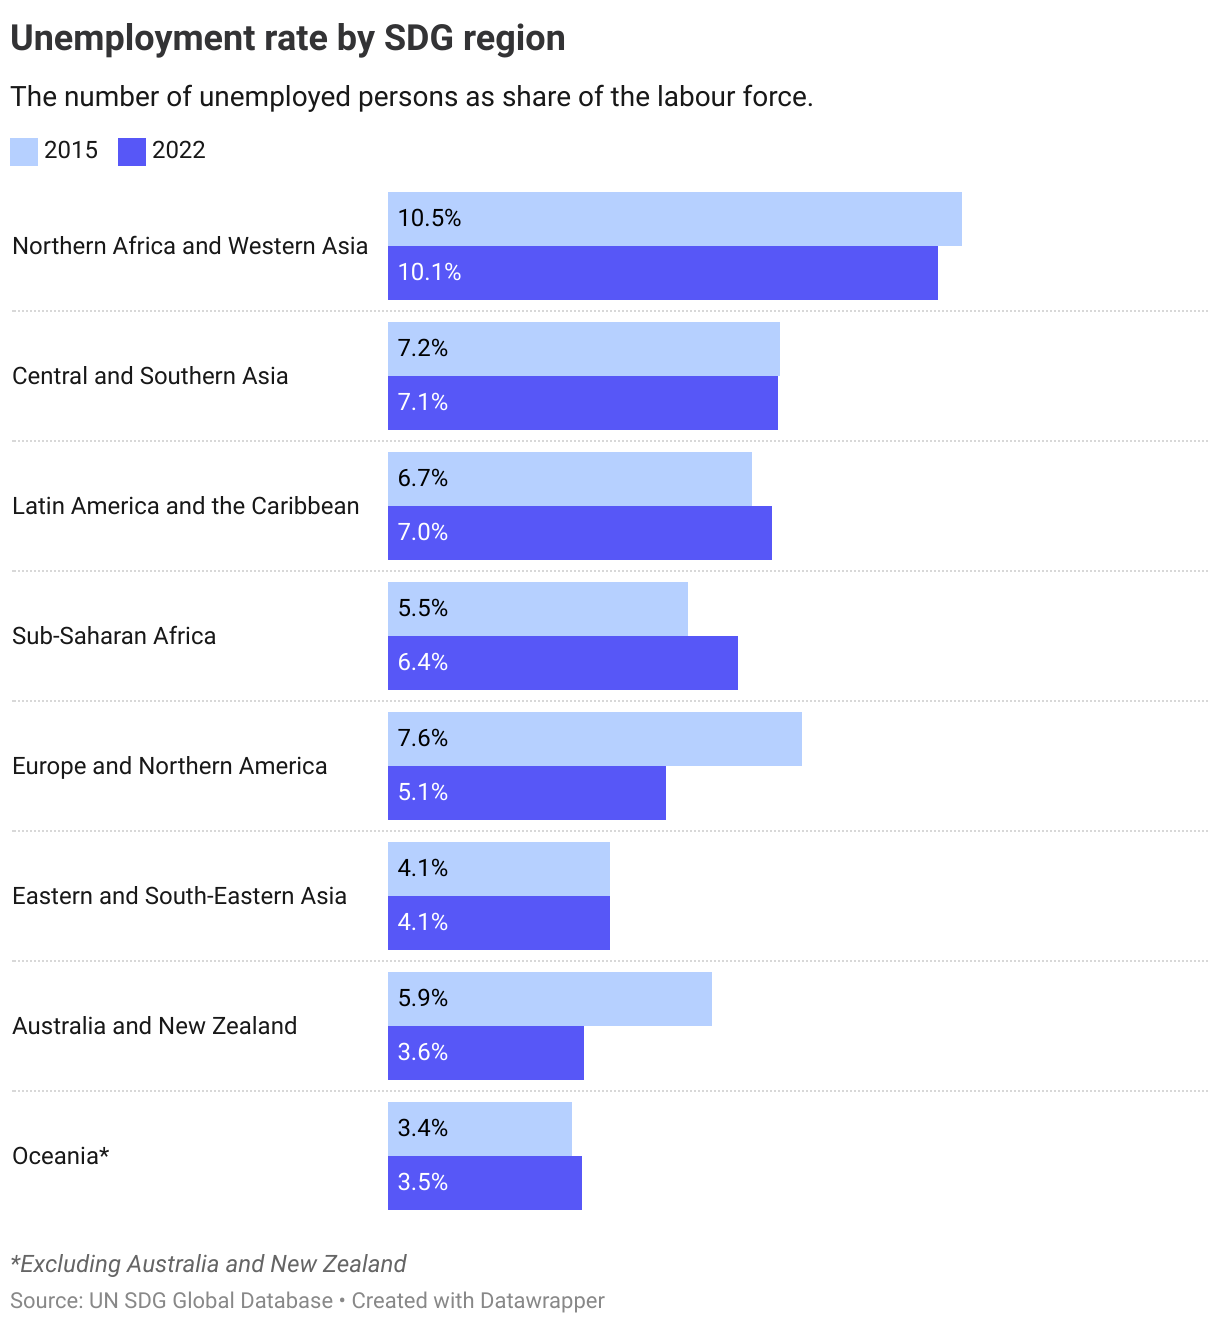
The most recent data shows a mixed picture across regions when compared to 2015. In Sub-Saharan Africa and Latin America, unemployment is higher, while it is lower in Europe and Northern America as well as in Australia and New Zealand. Northern Africa and Western Africa is currently the region with the highest unemployment rates.
The Nordics
Data is insufficient for cross-country comparisons on average hourly earnings (8.5.1).
Based on the target wording of "full employment" the OECD has operationalised the target unemployment rate in 2030 at 3% (indicator 8.5.2). While Iceland and Norway were close to this level before the pandemic, all the Nordics saw unemployment rise during 2020. Since then, the latest 2022 data shows a decline in unemployment rates decline again, with rates in Norway currently at a level lower than before the pandemic.
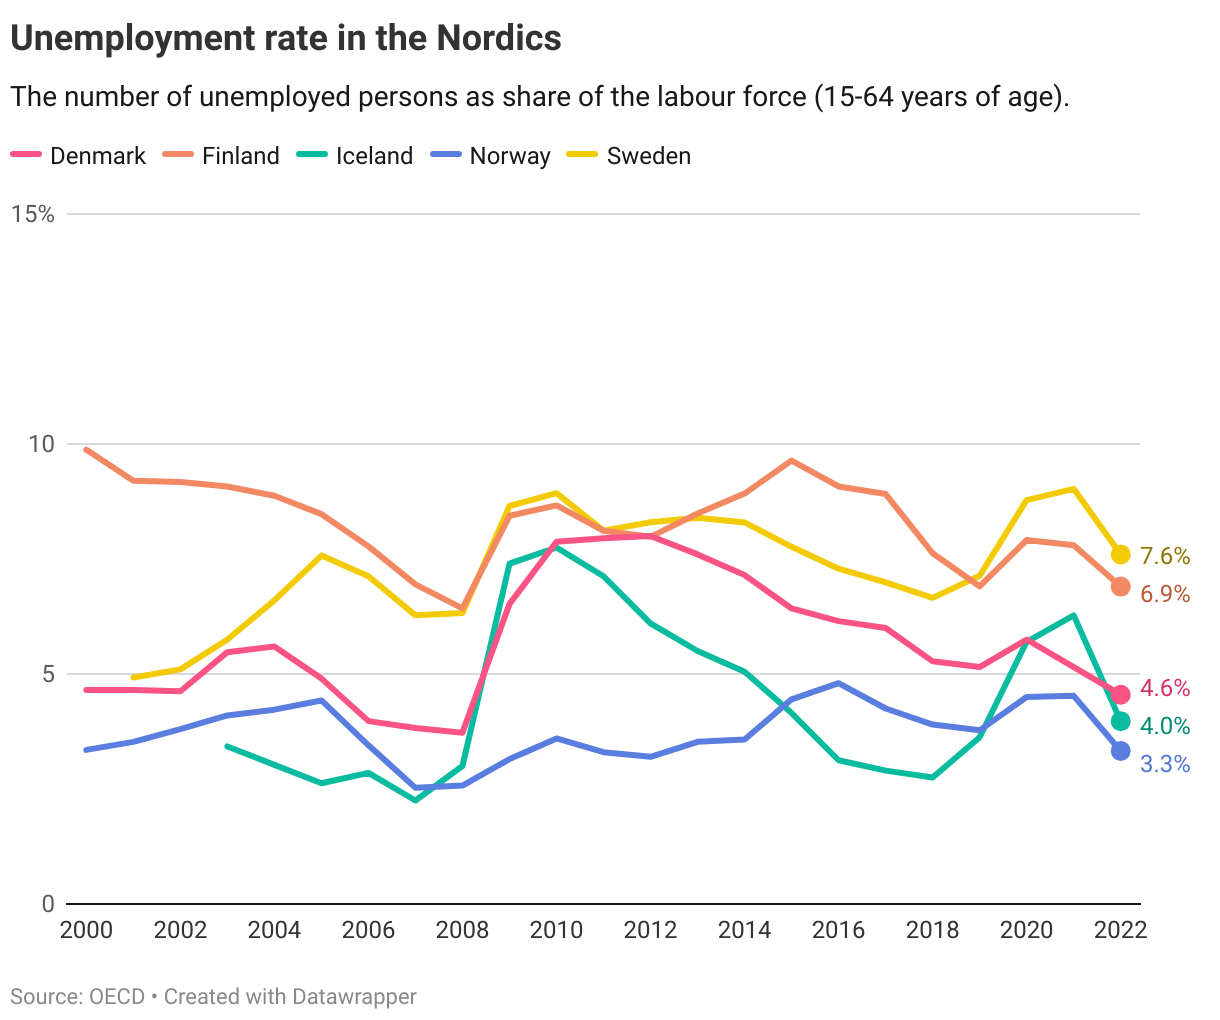
Given this, Finland and Sweden are all at a long distance to target, however Finland is progressing towards it. Denmark, Iceland and Norway are at a short distance from target.
Denmark
Short distance to target
Finland
Long distance to target but progressing
Iceland
Short distance to target
Norway
Short distance to target
Sweden
Long distance to target, not progressing
Target 8.6
By 2020, substantially reduce the proportion of youth not in employment, education or training
| 8.6.1 | Proportion of youth (aged 15-24 years) not in education, employment or training |
Global trends
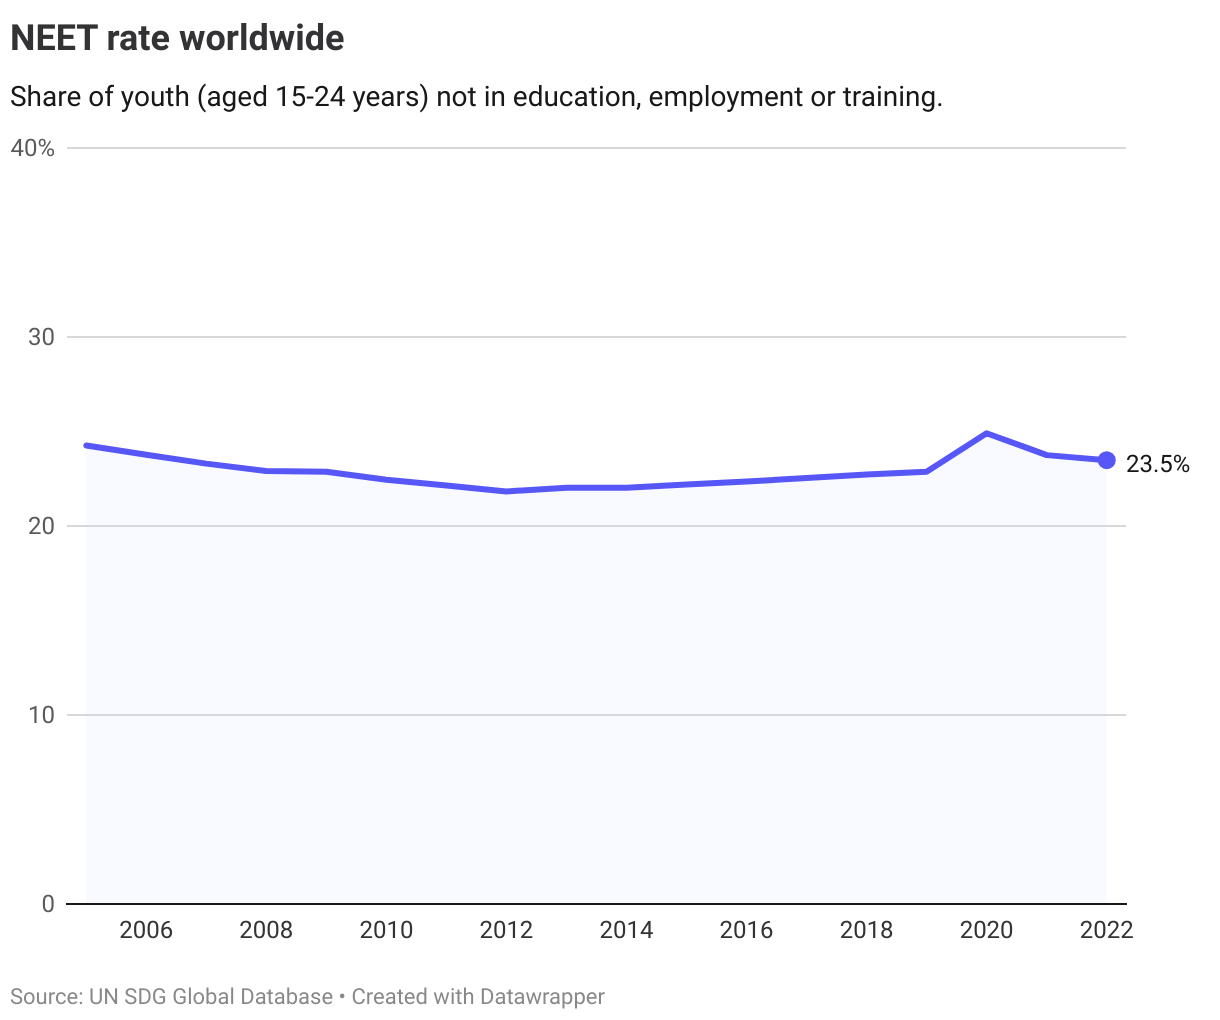
Even before the pandemic, the world was not making any significant progress towards reducing the share of youth not in education, employment or training (NEET). Data for 2022 shows that shares have declined, but are still above pre-pandemic level. Note that this target was to be achieved by 2020.
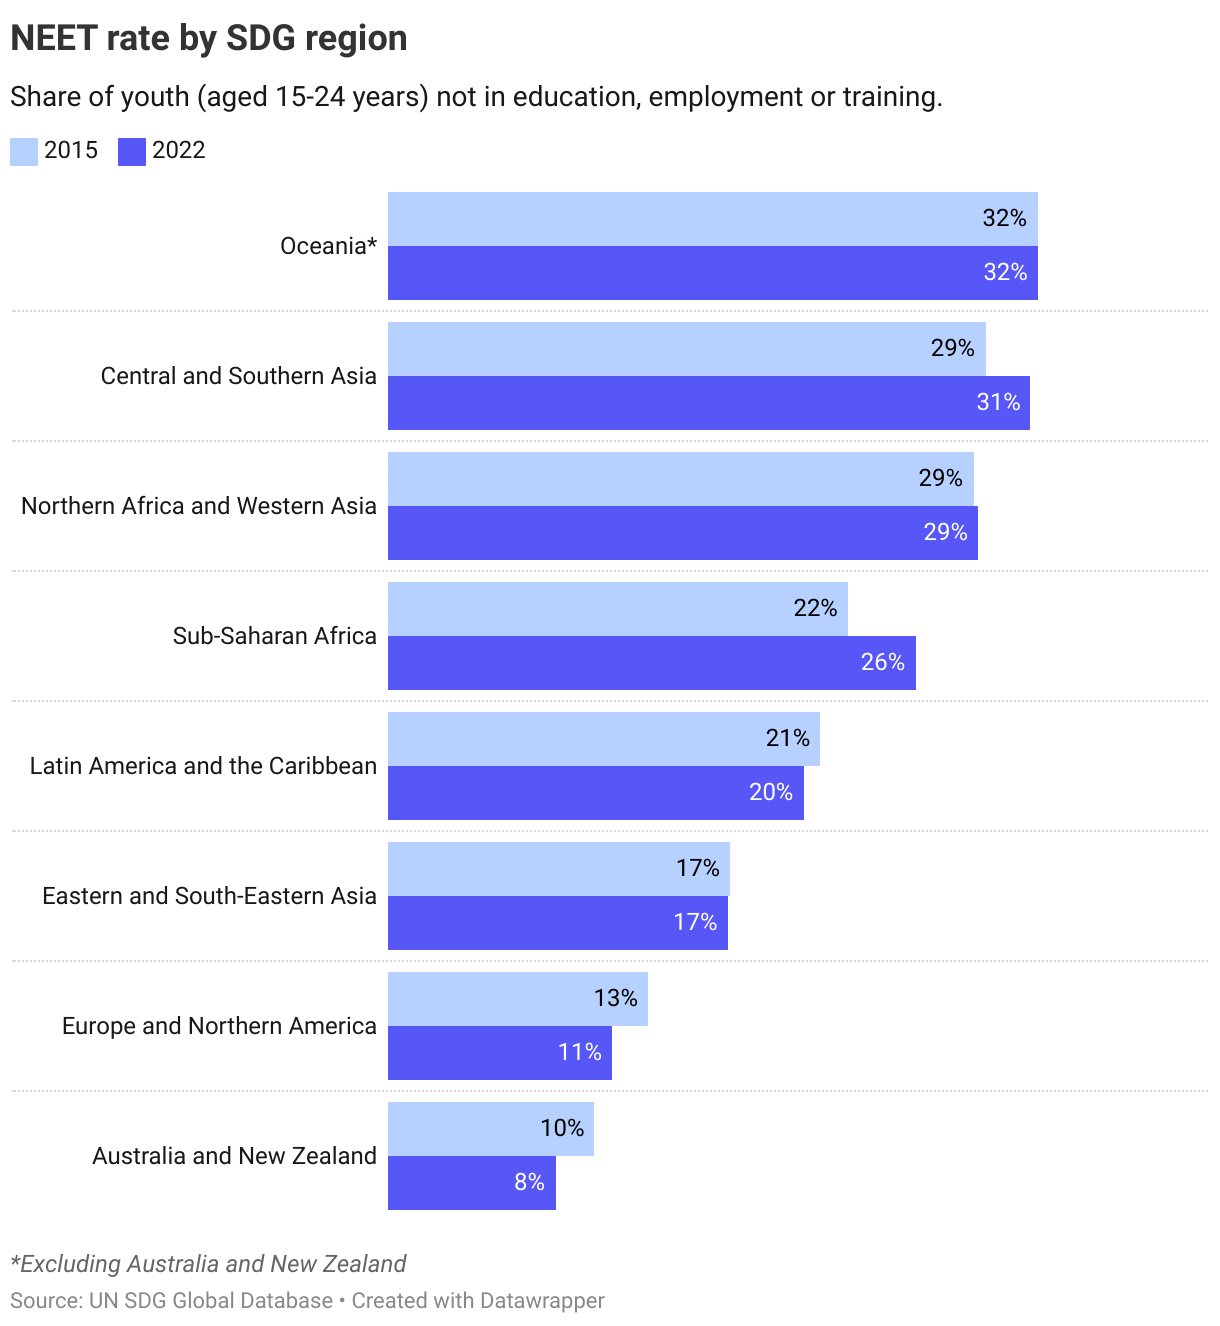
NEET-rates vary significantly between SDG regions. In 2022 they were highest in Oceania followed by Central and Southern Asia. Since 2015, few regions have managed to reduce the NEET-rate substantially. In Sub-Saharan Africa it has increased from 22% to 26% from 2015 to 2022.
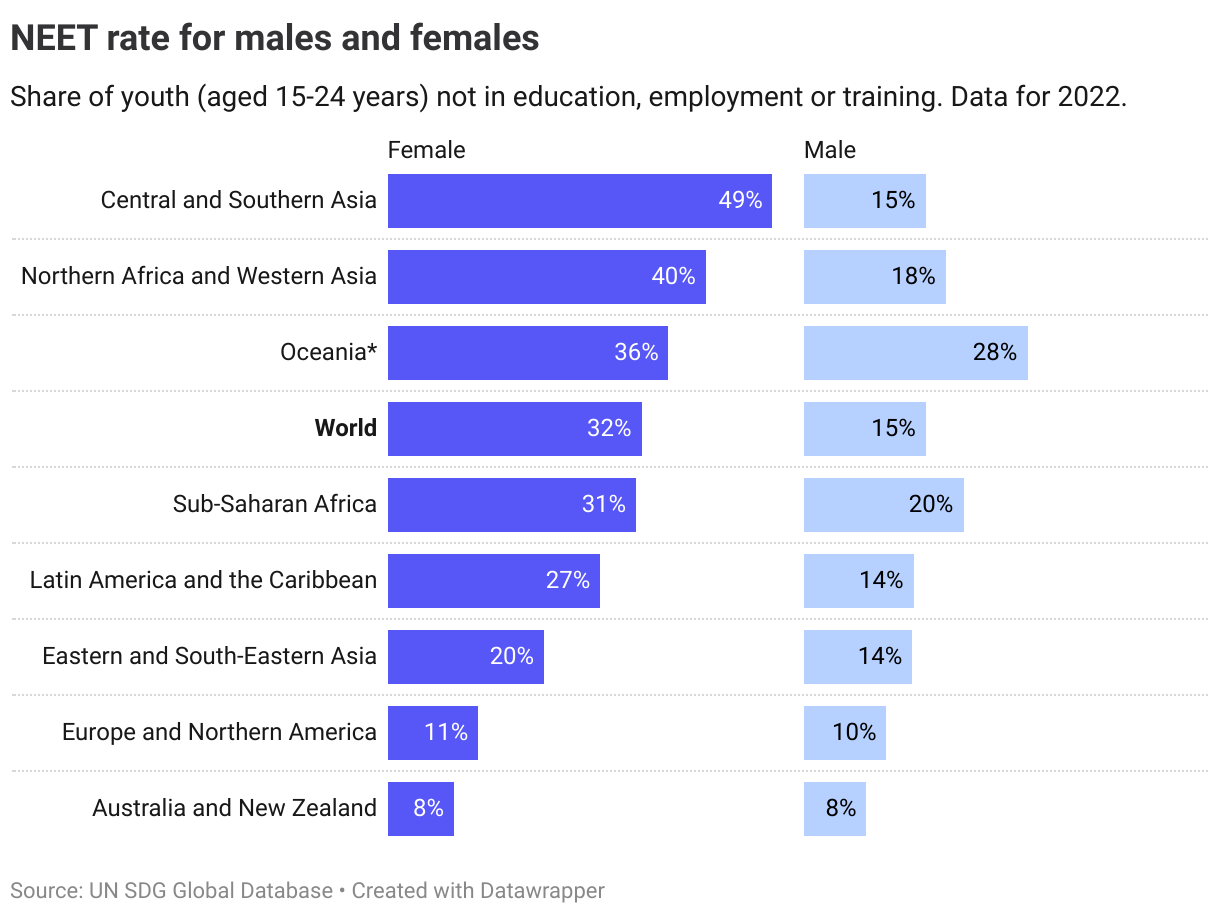
The NEET rate twice as high for young women as for young men. The gender gap is particularly large in Central and Southern Asia and Northern and Western Asia. In these two regions, 49% and 40% of women were where outside employment, education or training, compared to 15% and 18% of men respectively.
The Nordics
As with the unemployment rate (target 8.5), the OECD has operationalised the NEET-rate target at 3%. The latest data from 2021 shows that Iceland and Sweden are closest, with Finland the furthest away. Although NEET-rates in the Nordics are well below the European average, none of the Nordics are on a trajectory towards the 3% target, with only Iceland and Sweden at a short distance.
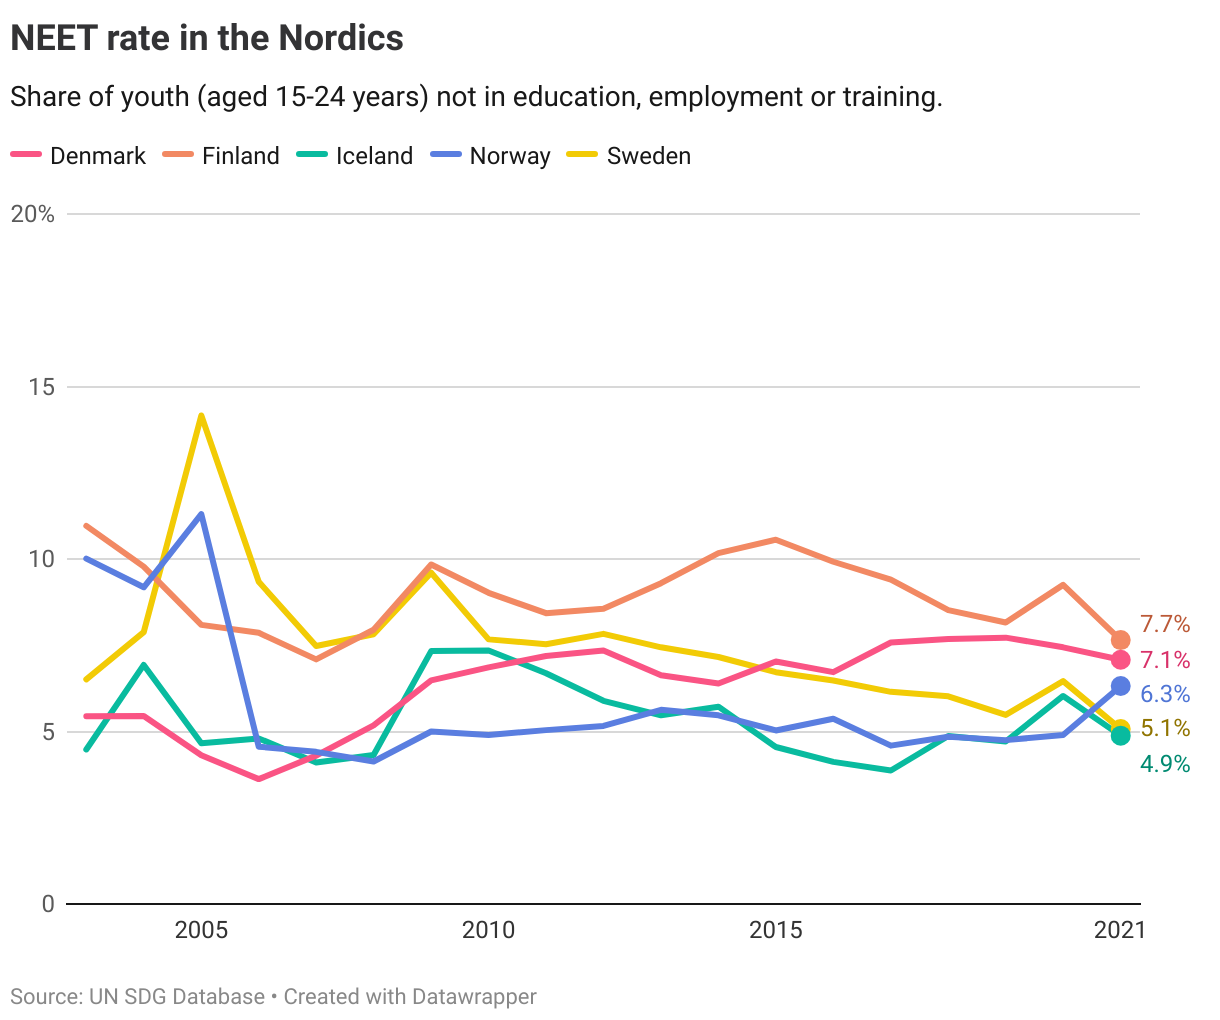
Denmark
Long distance to target, not progressing
Finland
Long distance to target, not progressing
Iceland
Short distance to target
Norway
Long distance to target, not progressing
Sweden
Short distance to target
Target 8.7
Take immediate and effective measures to eradicate forced labour, end modern slavery and human trafficking and secure the prohibition and elimination of the worst forms of child labour, including recruitment and use of child soldiers, and by 2025 end child labour in all its forms
| 8.7.1 | Proportion and number of children aged 5‑17 years engaged in child labour, by sex and age |
Global trends
Over 160 million children worldwide aged 5–17 years were engaged in child labour in 2020, according to the UN. This amounted to almost 1 in 10 of all children between 5-17 years of age, unchanged from 2016. In absolute numbers child labour has increased by over 8 million since 2016, putting the goal of ending child labour in all its forms by 2025 further out of reach. Child labour is most prevalent in Sub-Saharan Africa.
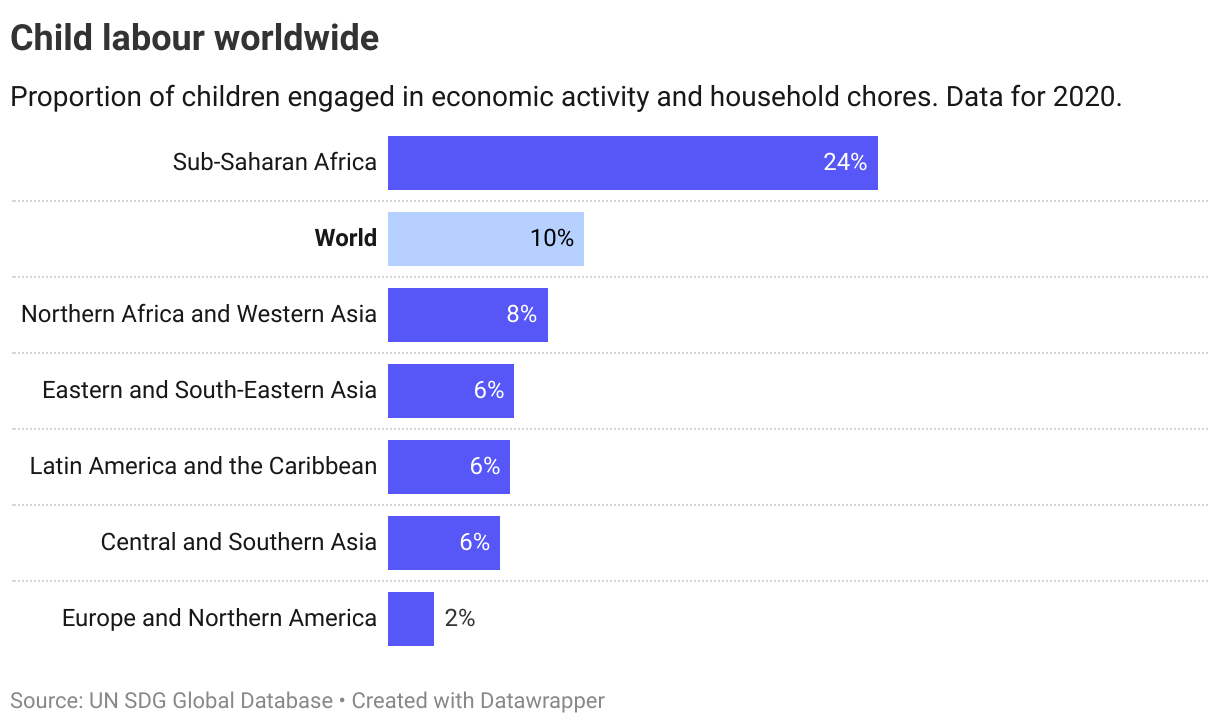
The Nordics
No data is available for the Nordic countries on this indicator.
Target 8.8
Protect labour rights and promote safe and secure working environments for all workers, including migrant workers, in particular women migrants, and those in precarious employment
| 8.8.1 | Fatal and non-fatal occupational injuries per 100,000 workers, by sex and migrant status |
| 8.8.2 | Level of national compliance with labour rights (freedom of association and collective bargaining) based on International Labour Organization (ILO) textual sources and national legislation, by sex and migrant status |
Global trends
No data is available at the global or regional level for fatal and non-fatal occupational injuries (indicator 8.8.1).
The level of compliance with labour rights has only seen a modest improvement globally since 2015. Compliance is measured by a score from 0 to 10 based on countries' compliance with freedom of association and the right to collective bargaining, with a lower score meaning a higher level of compliance. The world average has remain stable around 4.5 from 2015 to 2021. The most significant improvements regionally were seen in Asia, although the level of compliance is still low compared to the best-performing regions (Oceania, Europe and Northern America.)
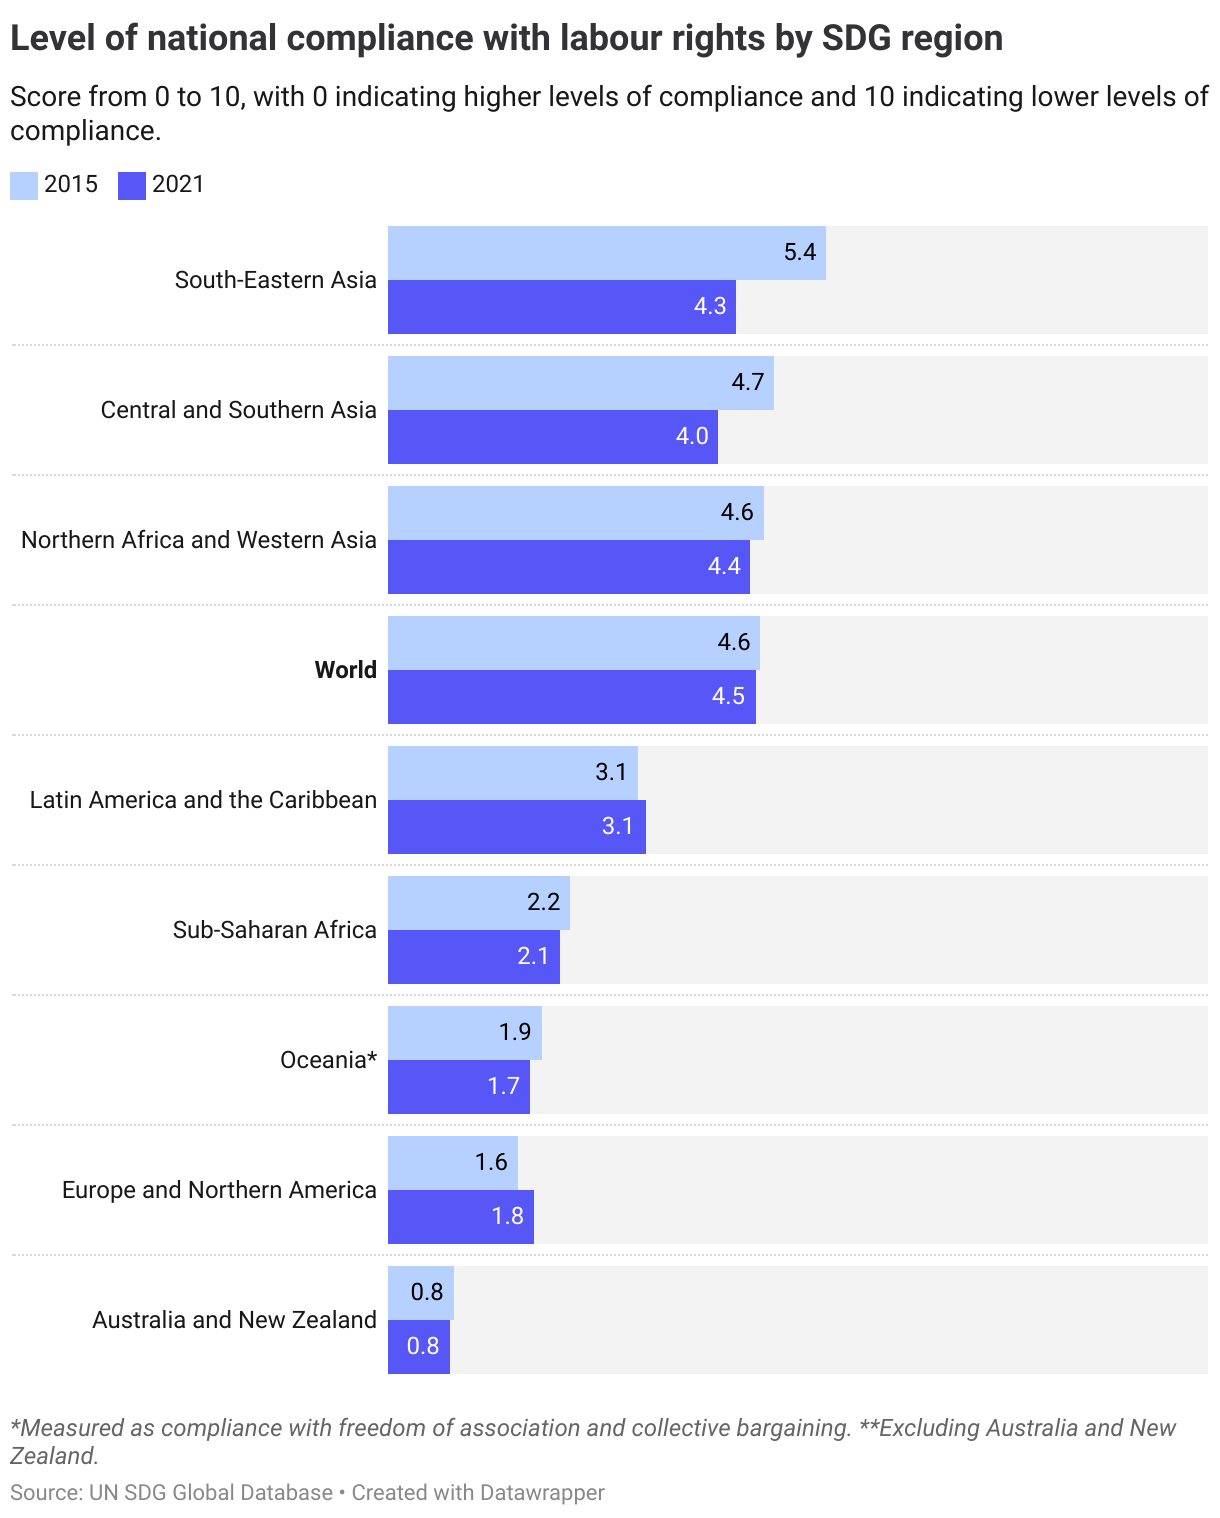
The Nordics
There is a lack of recent data for occupational injuries (indicator 8.8.1), with the most recent data from 2015.
All the Nordic countries have high levels of compliance with labour rights (indicator 8.8.2). According to the ILO, Finland, Iceland, Norway and Sweden, all have full compliance (score of 0). Denmark has a compliance score of 0.2, a decline from 0.7 in 2015. All the Nordics, except Denmark, have thus already met the target.
Denmark
Short distance to target
Finland
Target is met
Iceland
Target is met
Norway
Target is met
Sweden
Target is met
Target 8.9
By 2030, devise and implement policies to promote sustainable tourism that creates jobs and promotes local culture and products
| 8.9.1 | Tourism direct GDP as a proportion of total GDP and in growth rate |
Global trends
This indicator captures only the size of the tourism sector, providing limited insight into sustainability, jobs and the promotion of local culture/products.
The tourism sector was one of the hardest hit sectors during the pandemic, with its global share of GDP declining from 4.0% in 2019 to 2.4% in 2020 and 2.5% in 2021.
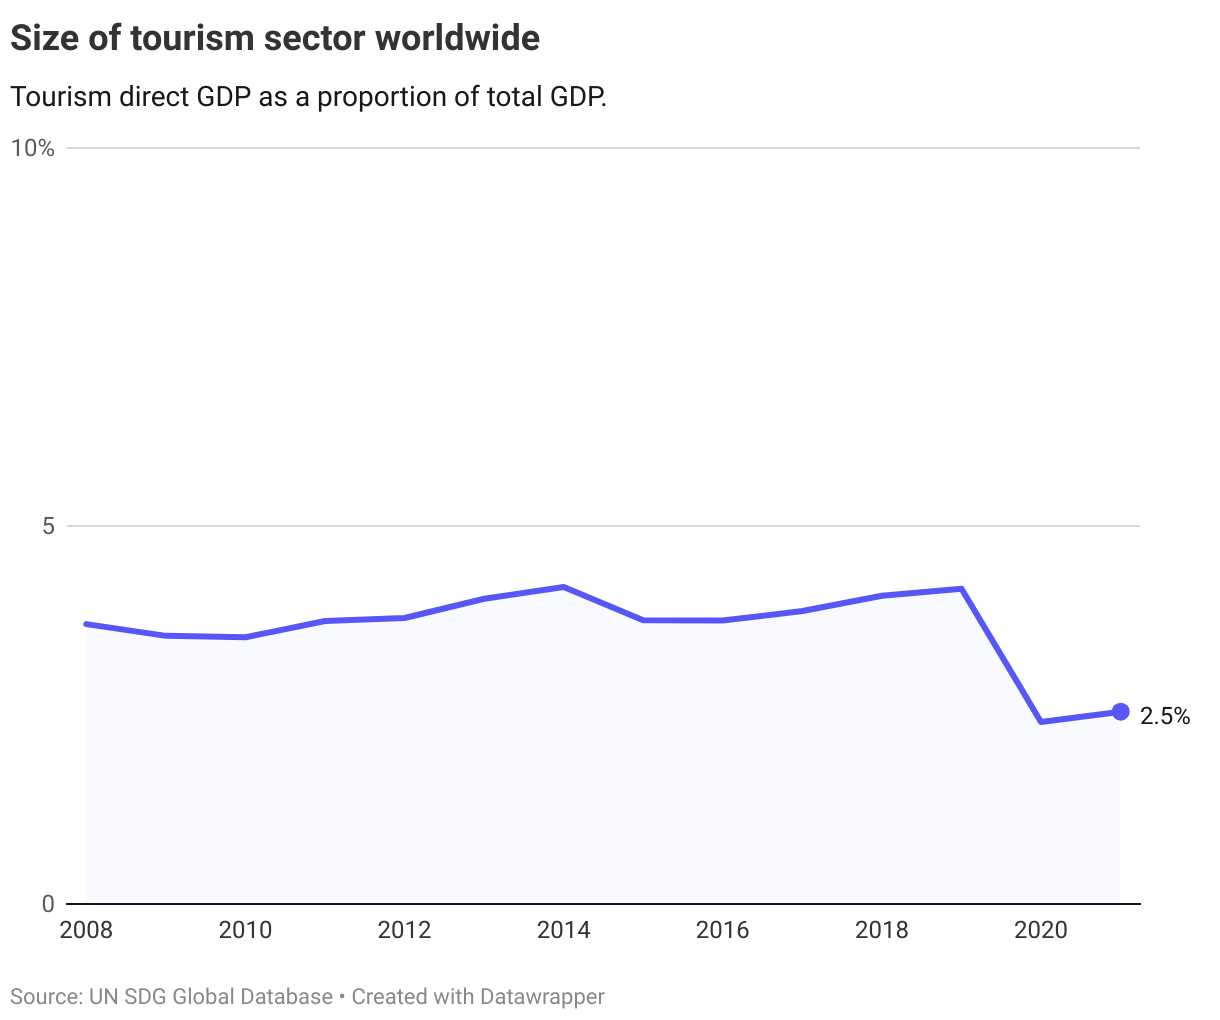
For all regions where 2021 data is available, show a decline in the GDP share of the tourism sector compared to pre-pandemic levels. Currently, the highest shares can be found in Oceania followed by Latin America and the Caribbean.
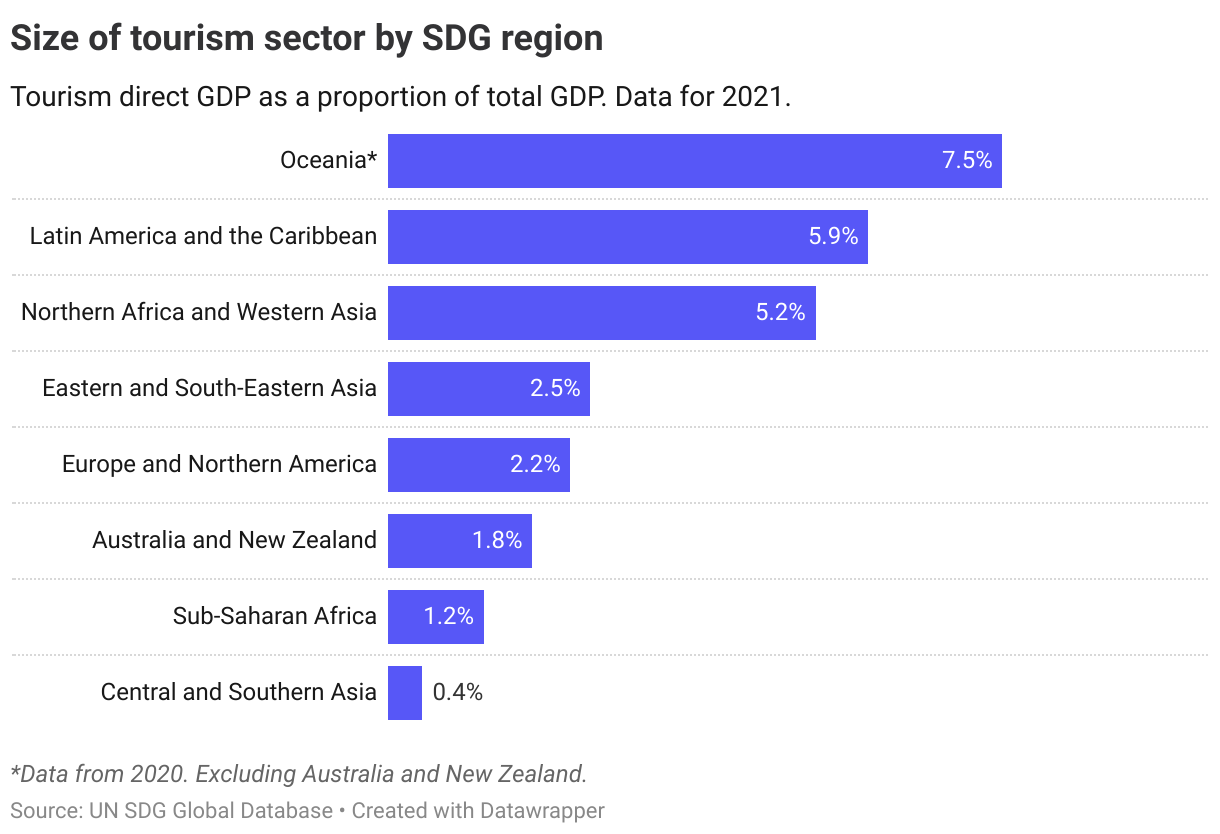
The Nordics
In the Nordics, Iceland has the highest share of contribution to GDP for the tourism sector. While all countries saw a decline in 2020, preliminary data for Sweden show a slight increase in 2021.
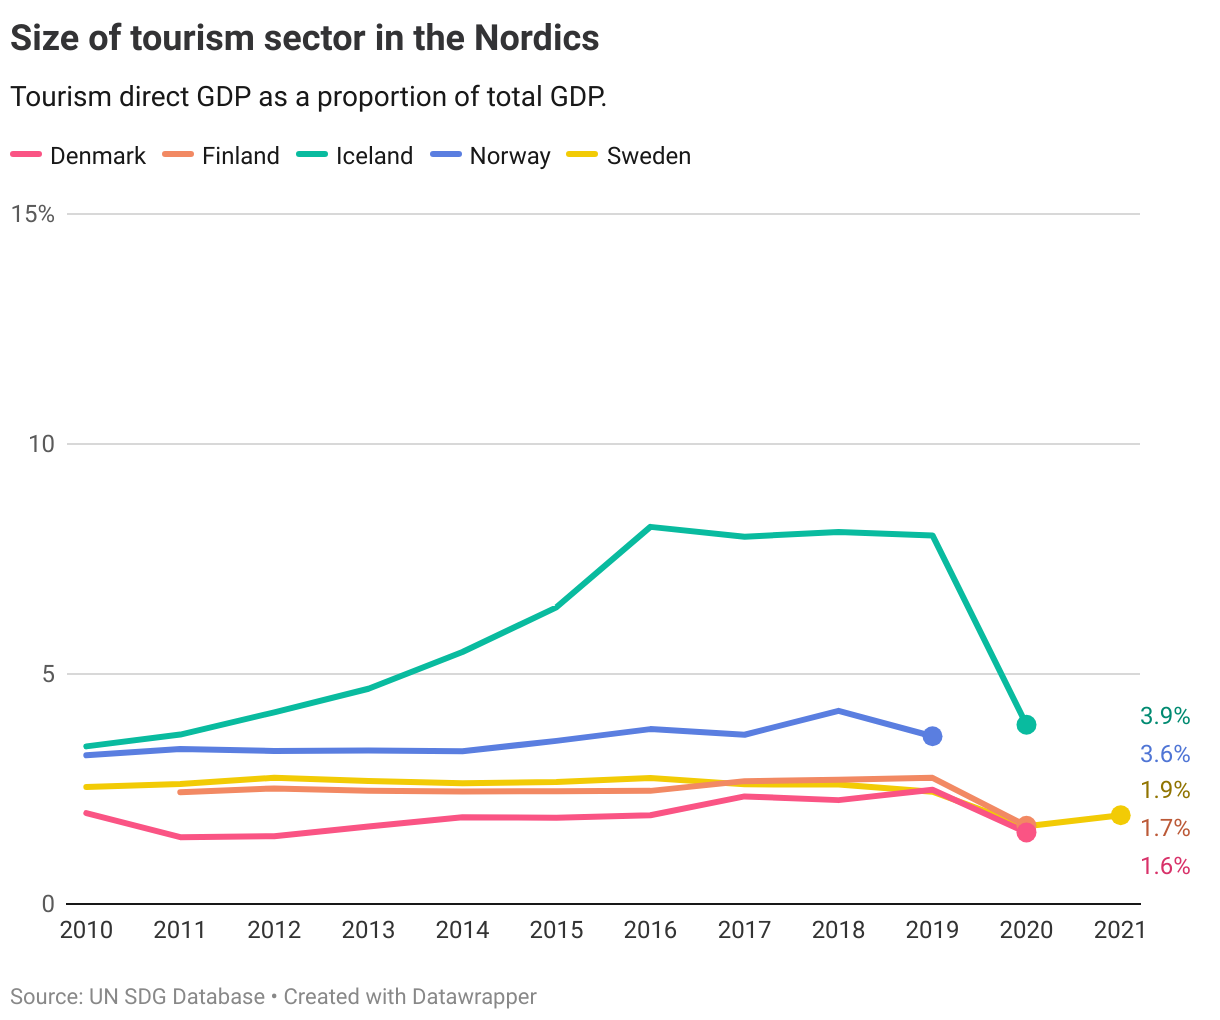
As this indicator is only considered contextual, no progress assessment is performed for the Nordic countries.
Target 8.10
Strengthen the capacity of domestic financial institutions to encourage and expand access to banking, insurance and financial services for all
| 8.10.1 | (a) Number of commercial bank branches per 100,000 adults and (b) number of automated teller machines (ATMs) per 100,000 adults |
| 8.10.2 | Proportion of adults (15 years and older) with an account at a bank or other financial institution or with a mobile-money-service provider |
Global trends
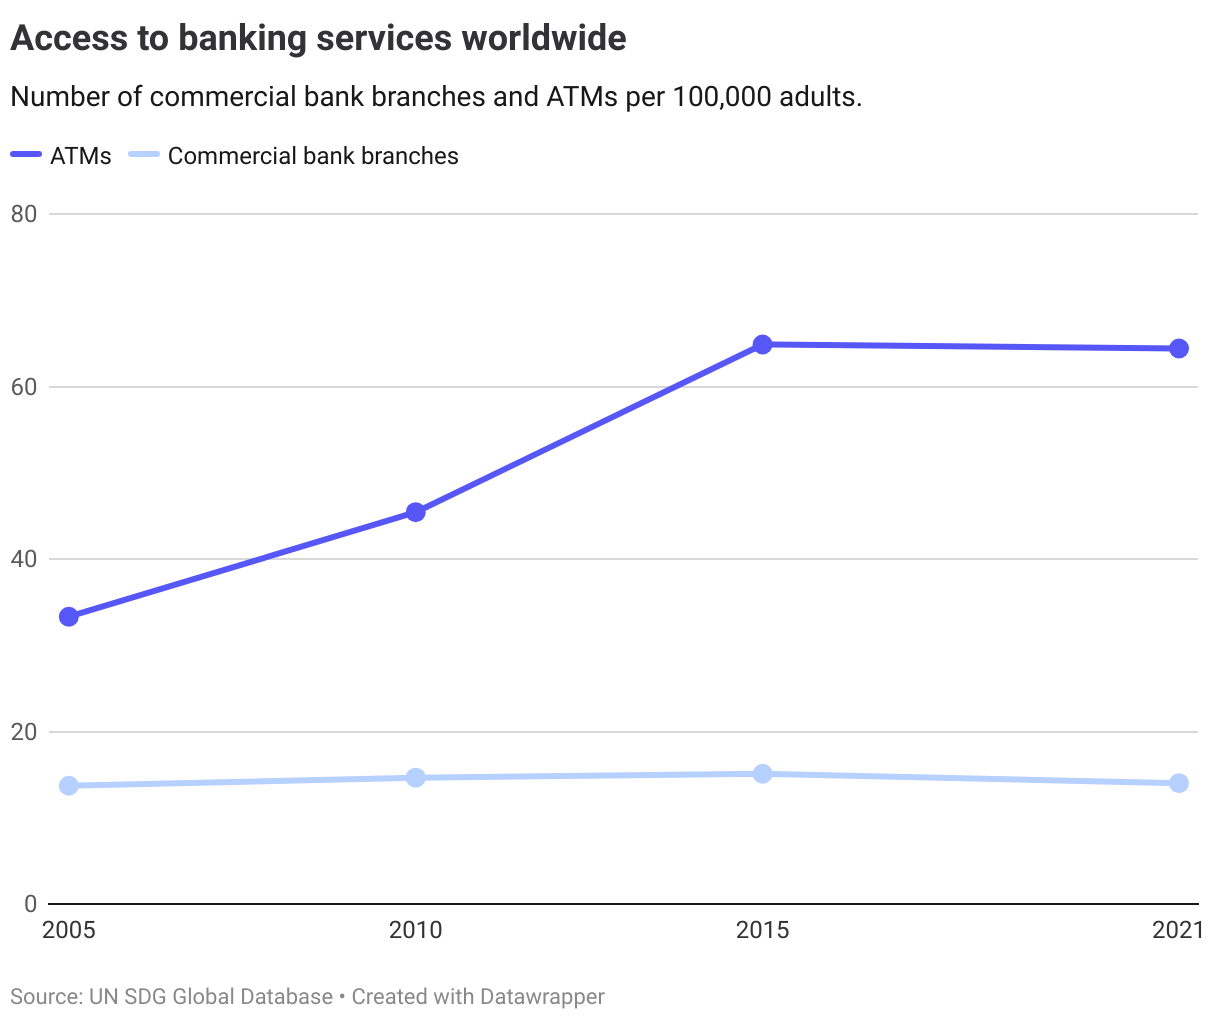
The number of ATMs (per 100,000 adults) has increased in since 2000, but remained stable since 2015. The number of commercial bank branches (per 100,000 adults) has remained stable.
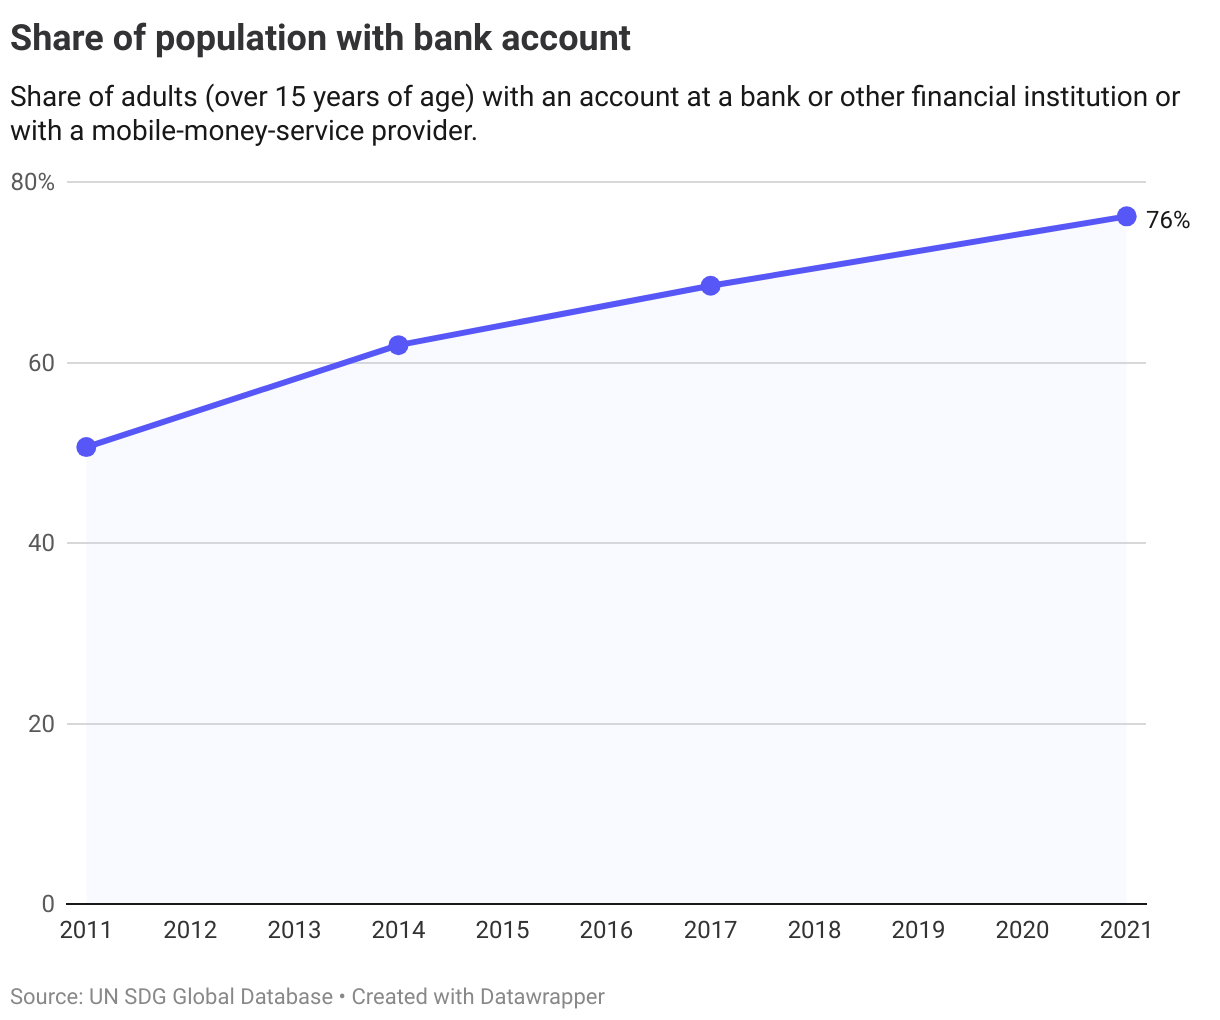
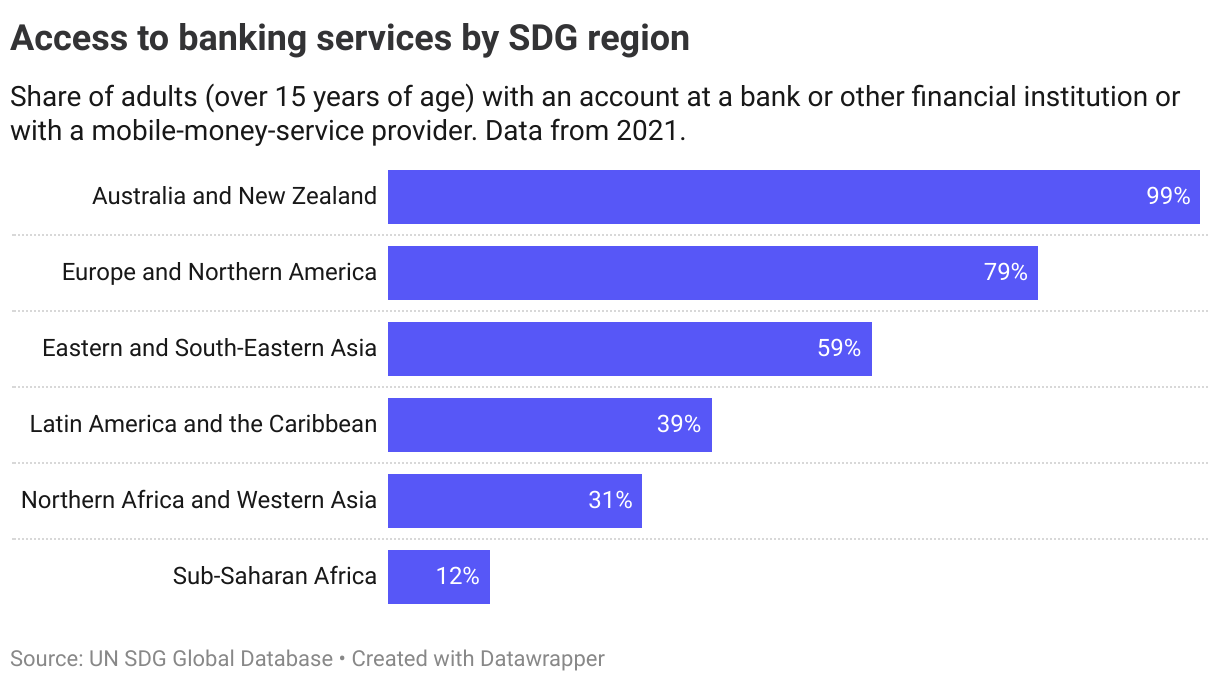
Access to finance has also increased over the past decade, with the number of people with an account at a bank or mobile money service growing from 62% in 2014 to 76% in 2021.
Access to finance varies significantly between regions, with close to the full population over 15 years of age having an account in Australia and New Zealand, while in Northern Africa and Western Asia as well as in Sub-Saharan Africa under half of the population had an account.
The Nordics
All the Nordics have full coverage of banking services according to the latest data from 2021. This target is thus already met.
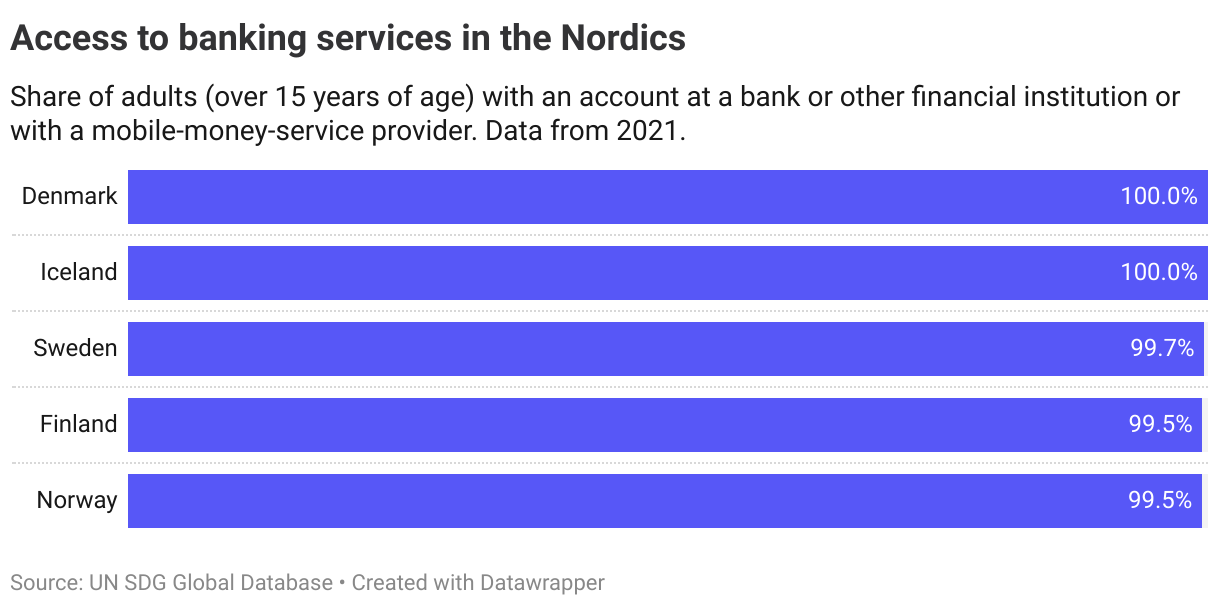
Denmark
Target is met
Finland
Target is met
Iceland
Target is met
Norway
Target is met
Sweden
Target is met
Target 8.a
Increase Aid for Trade support for developing countries, in particular least developed countries, including through the Enhanced Integrated Framework for Trade-Related Technical Assistance to Least Developed Countries
| 8.a.1 | Aid for Trade commitments and disbursements |
Global trends
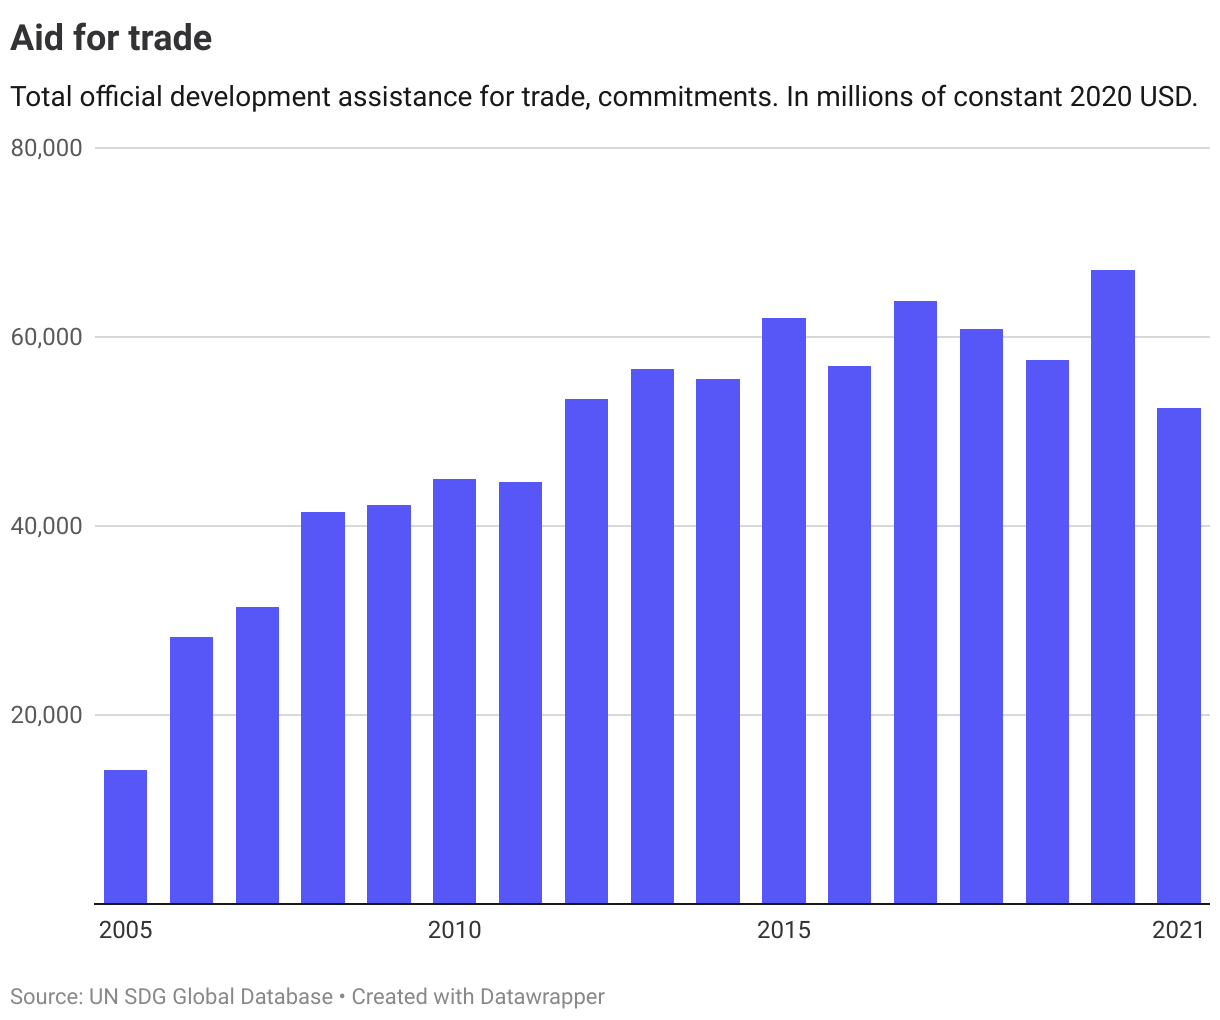
While the target sets out a commitment to increase Aid for Trade support, there is no set numerical target. OECD data shows that total official development assistance for trade has increased over time and reached over 67 billion in 2020. However, from 2020 to 2021 it has declined to 53 billion, its lowest level since 2012.
No progress assessment is performed for the Nordic countries as the distribution of international flows will depend on the national context.
Target 8.b
By 2020, develop and operationalize a global strategy for youth employment and implement the Global Jobs Pact of the International Labour Organization
| 8.b.1 | Existence of a developed and operationalized national strategy for youth employment, as a distinct strategy or as part of a national employment strategy |
Global trends
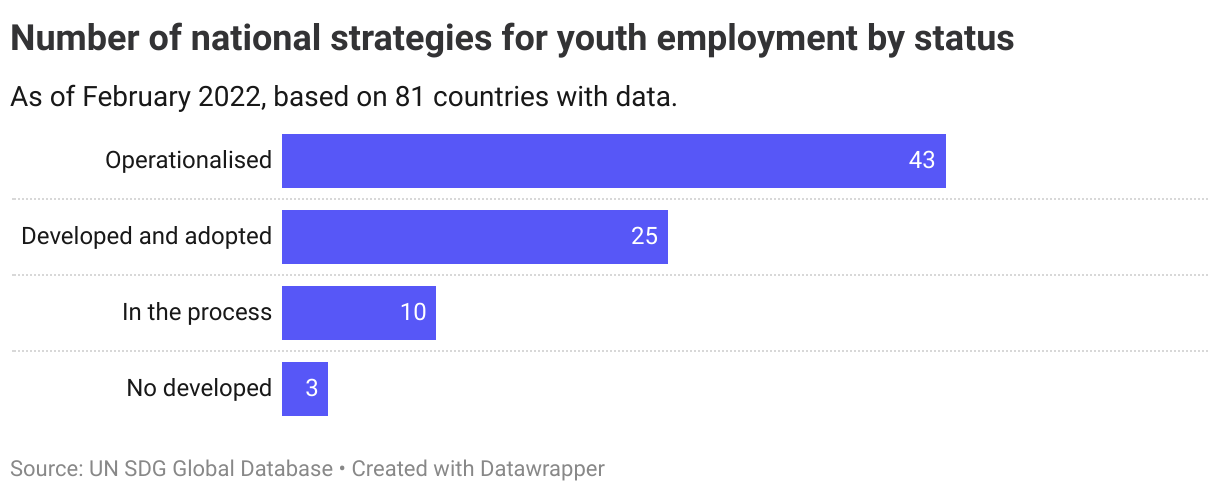
As of 2022, data on youth employment strategies is available for 81 countries. About half of those have operationalised such strategies, while the remaining countries are in the process of developing or have developed/adopted such strategies.
The Nordics
Denmark, Finland, Norway and Sweden have all implemented such strategies. Iceland is listed as one of the countries that has not developed a strategy.
Denmark
Target is met
Finland
Target is met
Iceland
Long distance to target, not progressing
Norway
Target is met
Sweden
Target is met