
Introduction
This data tracker analyses the Nordic countries’ progress towards achieving Sustainable Development Goal 6: Ensure availability and sustainable management of water and sanitation for all. The goal is comprised of 8 targets.
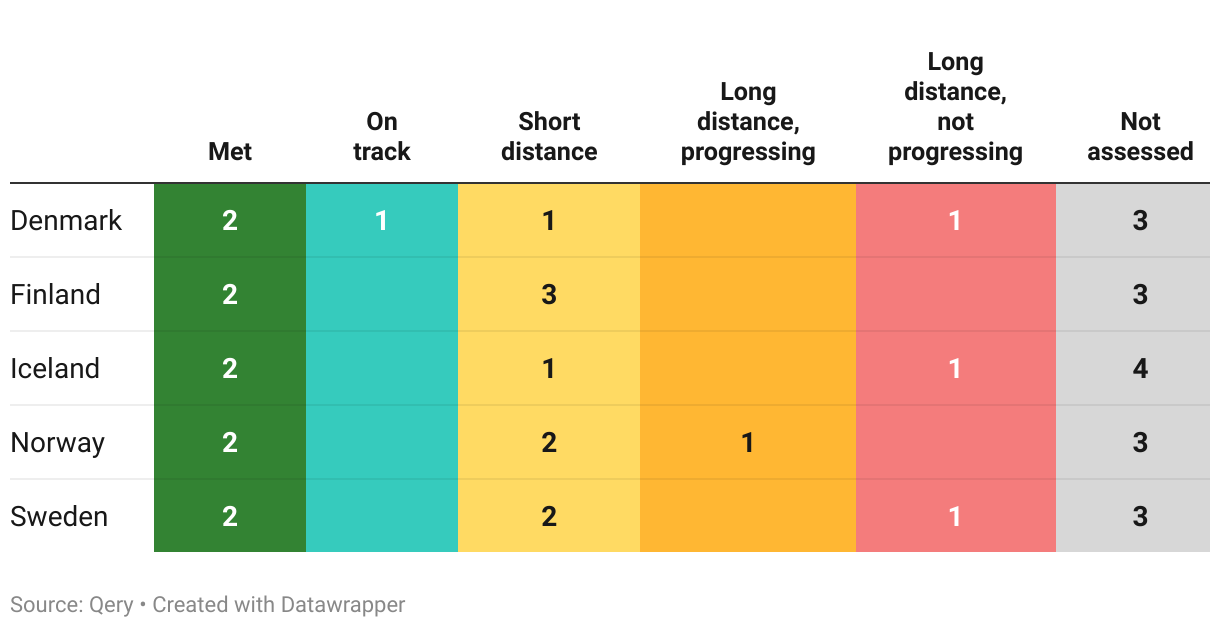
The Nordic countries – Denmark, Finland, Iceland, Norway and Sweden – are classified into one of five categories for each target:
Met: The country has already met the 2030 target.
On track: The country has not yet met the target but is on track to do so by 2030.
Short distance: The country has not met the target and is not projected to do so but is close to achieving it. This category also applies when the country currently meets the target but is projected to move away from it.
Long distance but progressing: The country is far from the target but is making progress towards it.
Long distance and not progressing: The country is far from the target and is not making progress towards reaching it.
Details on the methodology used, together with the overall assessment for all 17 goals, can be found on our overview page. Note that the analysis is currently work in progress.
Overall assessment of progress
As of mid-2023, this is our assessment of the Nordic countries progress on the 8 targets part of SDG 6:
The Nordic countries’ performance on the different targets part of this goal can be explored further below. Each section follows the same structure:
- First, the official target text and related indicators is described and the latest global and regional trends are highlighted briefly.
- Second, where data is available, we then zoom in on the Nordic countries to describe how they are progressing, and assess their likelihood of achieving the target by the 2030 deadline.
- Note that both sections above strictly uses data from the UN SDG Global Database and/or the OECD.
Target 6.1
By 2030, achieve universal and equitable access to safe and affordable drinking water for all
| 6.1.1 | Proportion of population using safely managed drinking water services |
Global trends
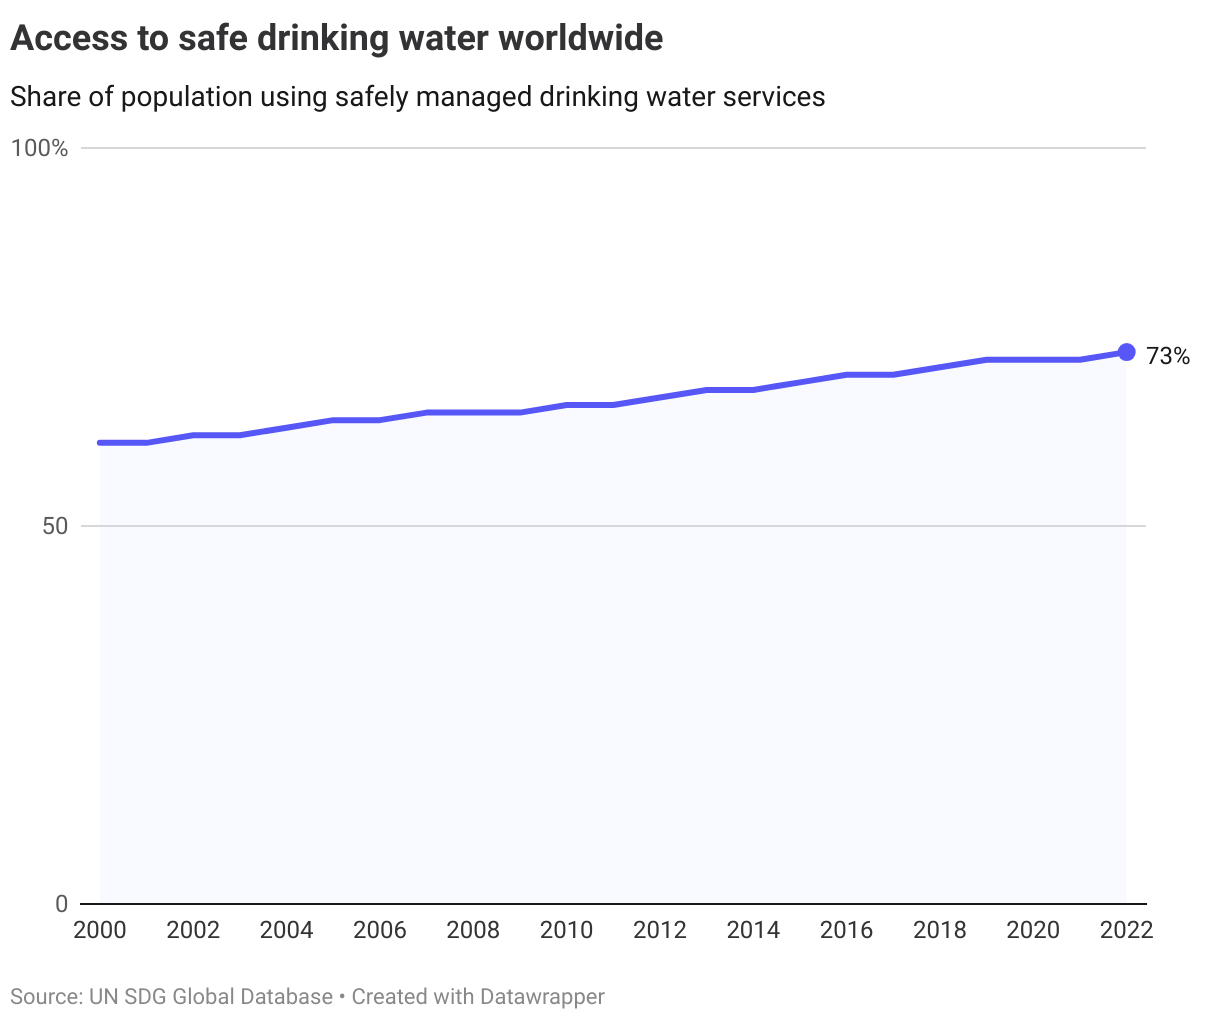
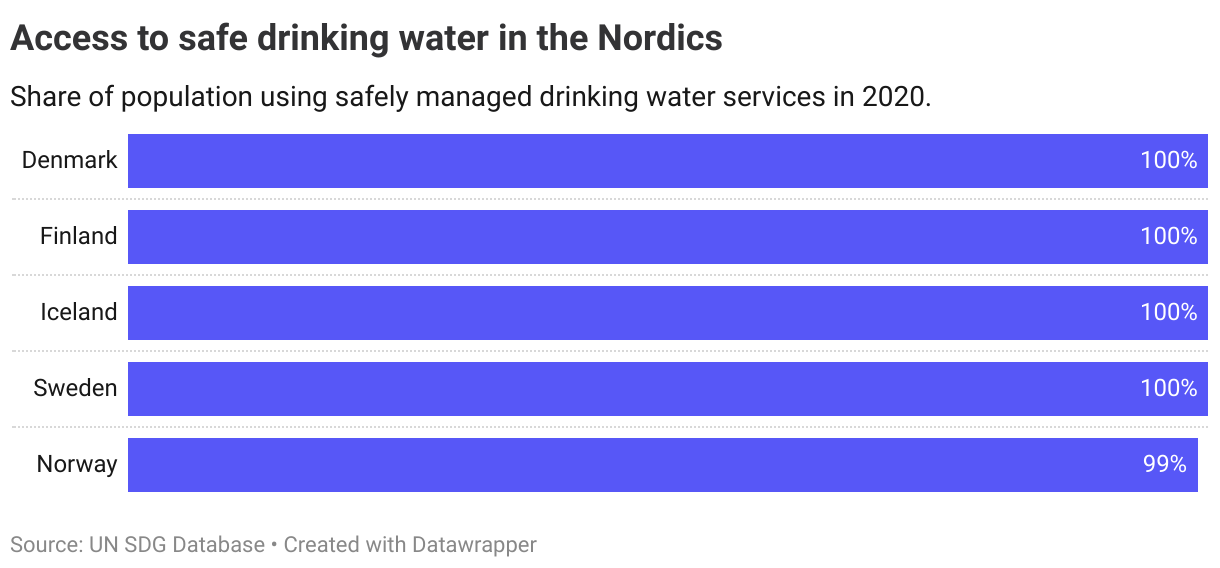
Safely managed drinking water services are defined by the UN as drinking water from an improved source that is accessible on premises, available when needed and free from faecal and priority chemical contamination. Improved water sources include piped water, boreholes or tubewells, protected dug wells, protected springs, rainwater, and packaged or delivered water.
In 2022, 73% of the world population had access to safely managed drinking water services, an increase from 61% in 2000 and 69% in 2015. This means that 2.2 billion people are still without such services in 2022.
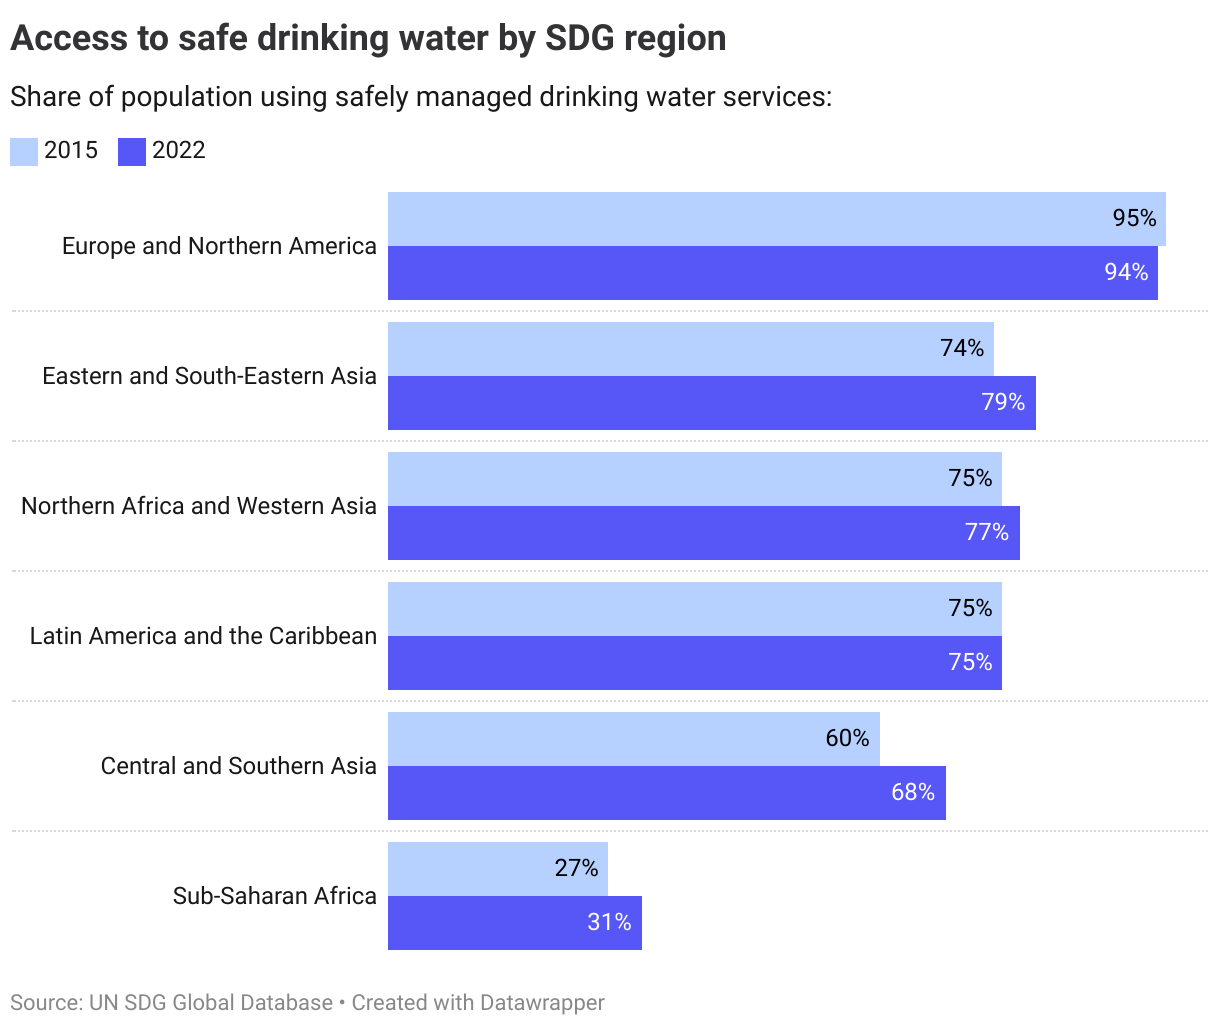
Regionally the situation is most pressing in Sub-Saharan Africa, where only 1 of 3 people have access to safely managed drinking water services. In the region, access rates have increased marginally from 27% to 31% since 2015.
The Nordics
All the Nordic countries have full access to safely managed drinking water services, and have already achieved the target for 2030.
Denmark
Target is met
Finland
Target is met
Iceland
Target is met
Norway
Target is met
Sweden
Target is met
Target 6.2
By 2030, achieve access to adequate and equitable sanitation and hygiene for all and end open defecation, paying special attention to the needs of women and girls and those in vulnerable situations
| 6.2.1 | Proportion of population using (a) safely managed sanitation services and (b) a hand-washing facility with soap and water |
Global trends
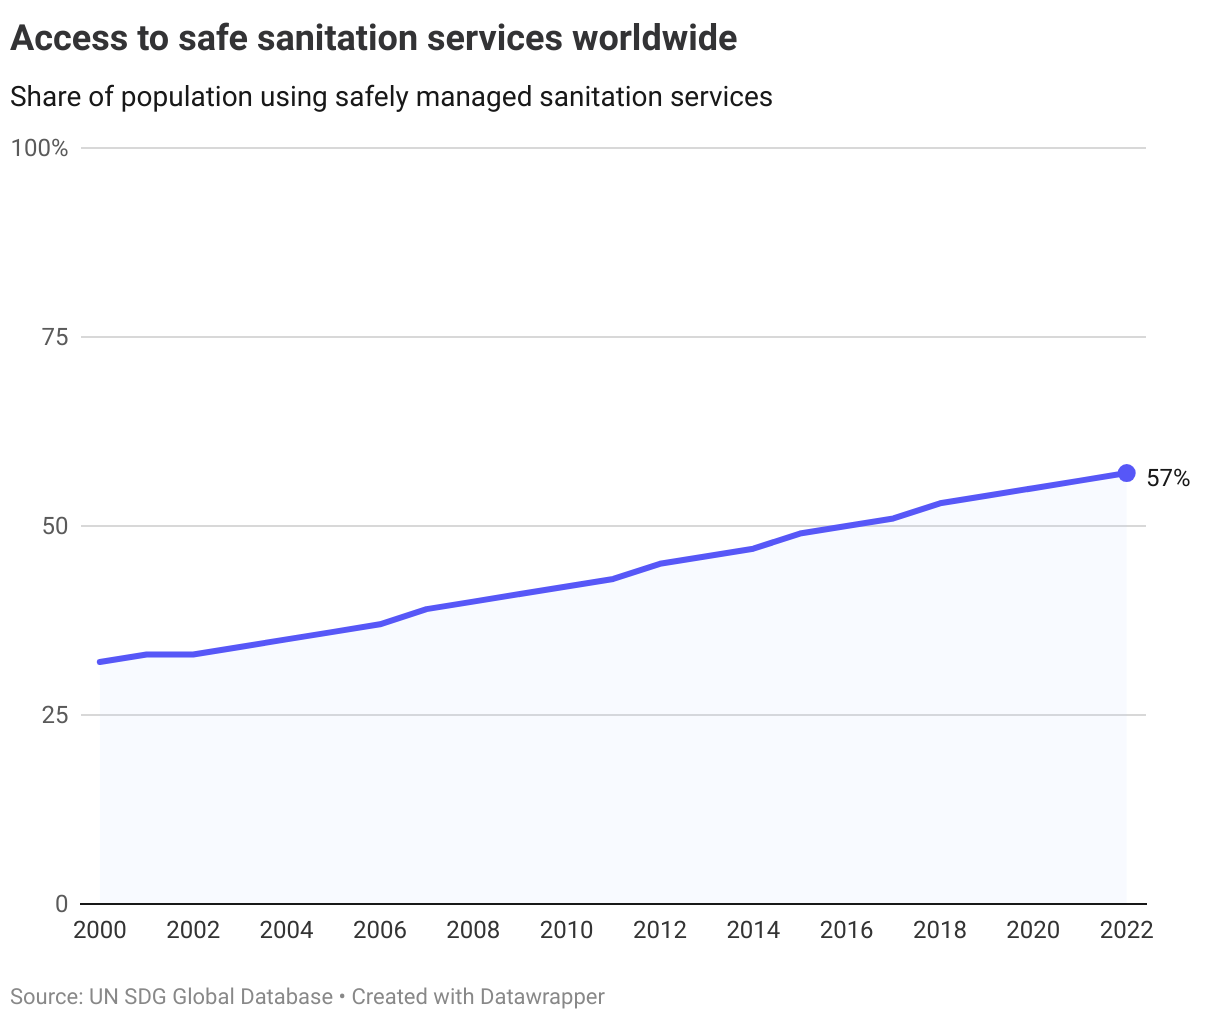
Safely managed sanitation services is defined by the UN as sanitation facilities that are not shared with other households, and include flush/pour flush toilets connected to piped sewer systems, septic tanks or pit latrines; pit latrines with slabs (including ventilated pit latrines), and composting toilets.
As of 2022, 57% of the world’s population has access to safely managed sanitation services compared to 32% in 2000 and 49% in 2015.
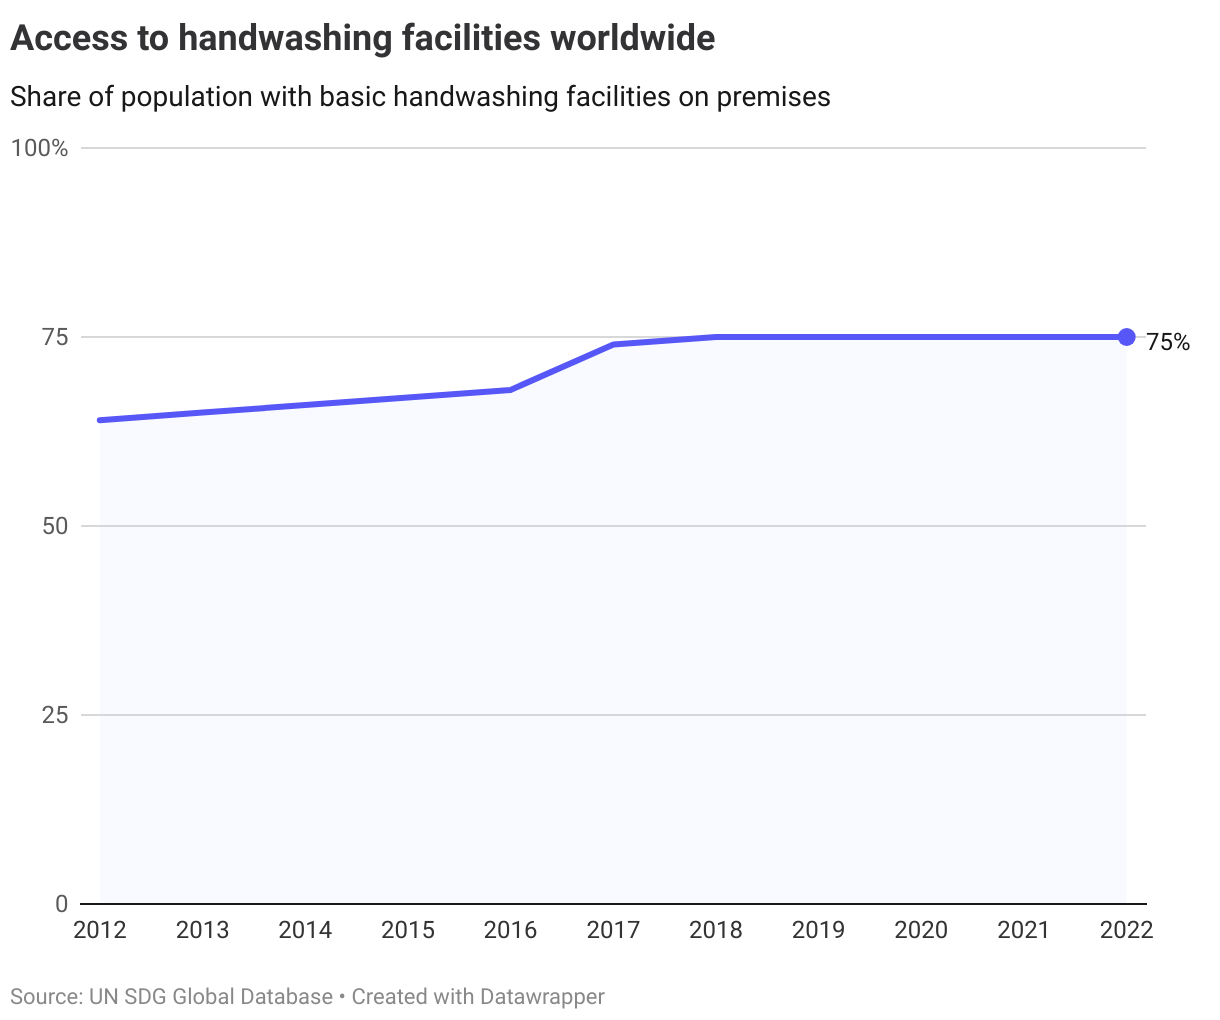
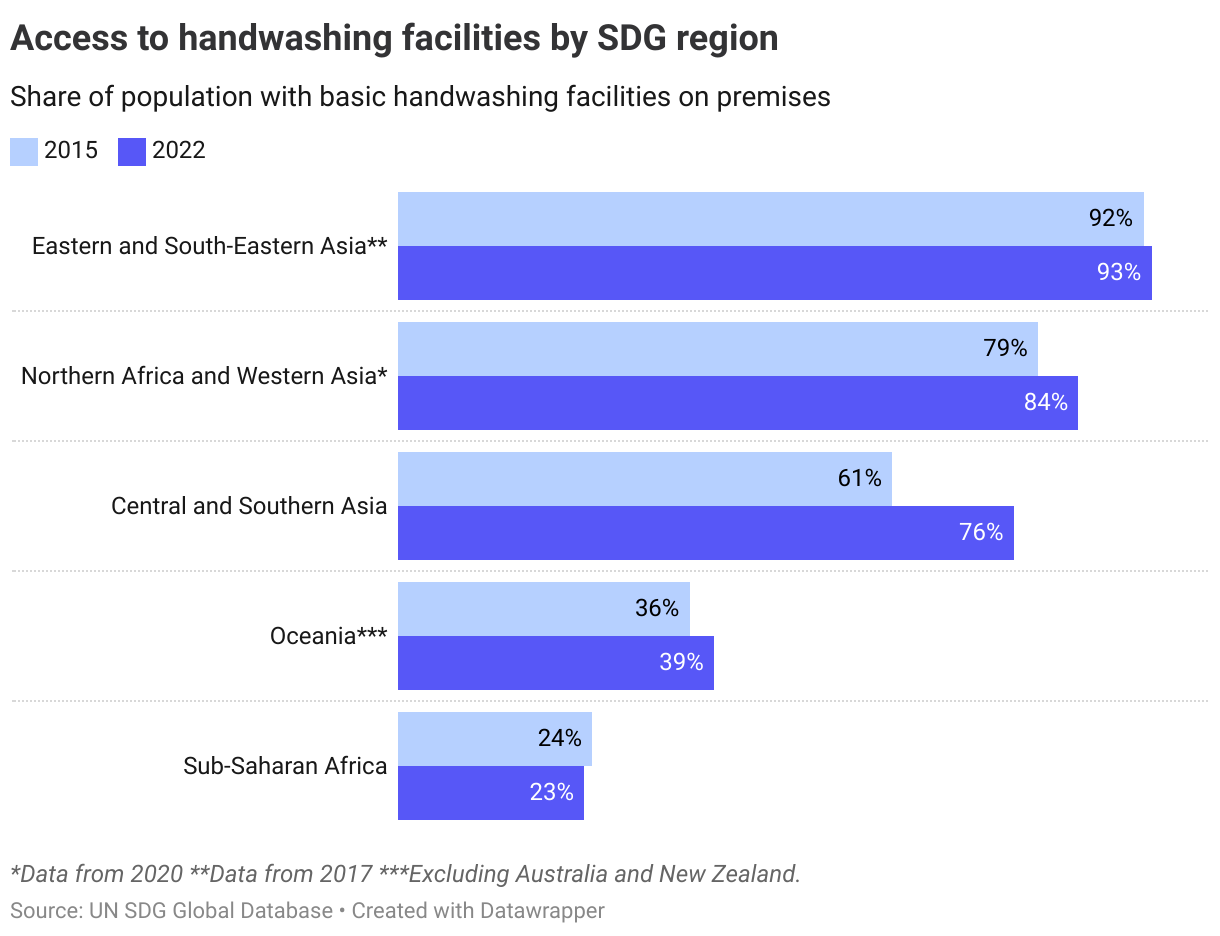
With regards to basic handwashing services, access has also increased over the past few years, with 75% of the worlds population defined as having a handwashing facility with soap and water at home.
Still, the rate of progress for both hand washing and sanitation services needs to increase by three to six times if the target of universal coverage is to be achieved globally by 2030, according to the UN.
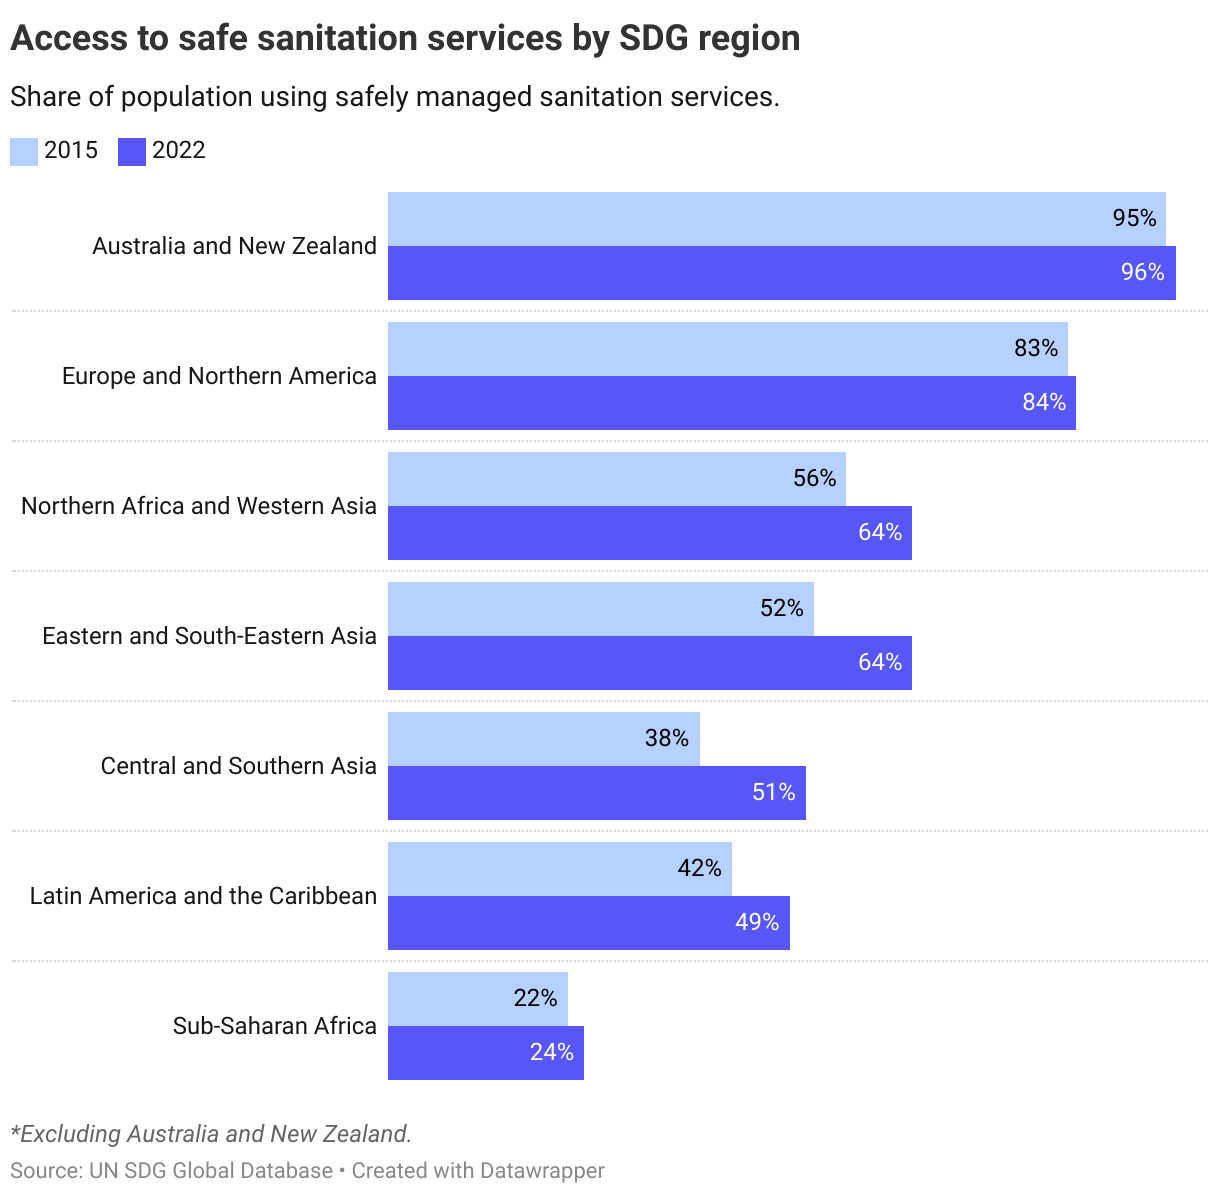
Regionally, Sub-Saharan Africa has the lowest share of the population with access with regards to both safe sanitation services and handwashing services. All regions for which data is available have seen access rates increase since 2015.
The Nordics
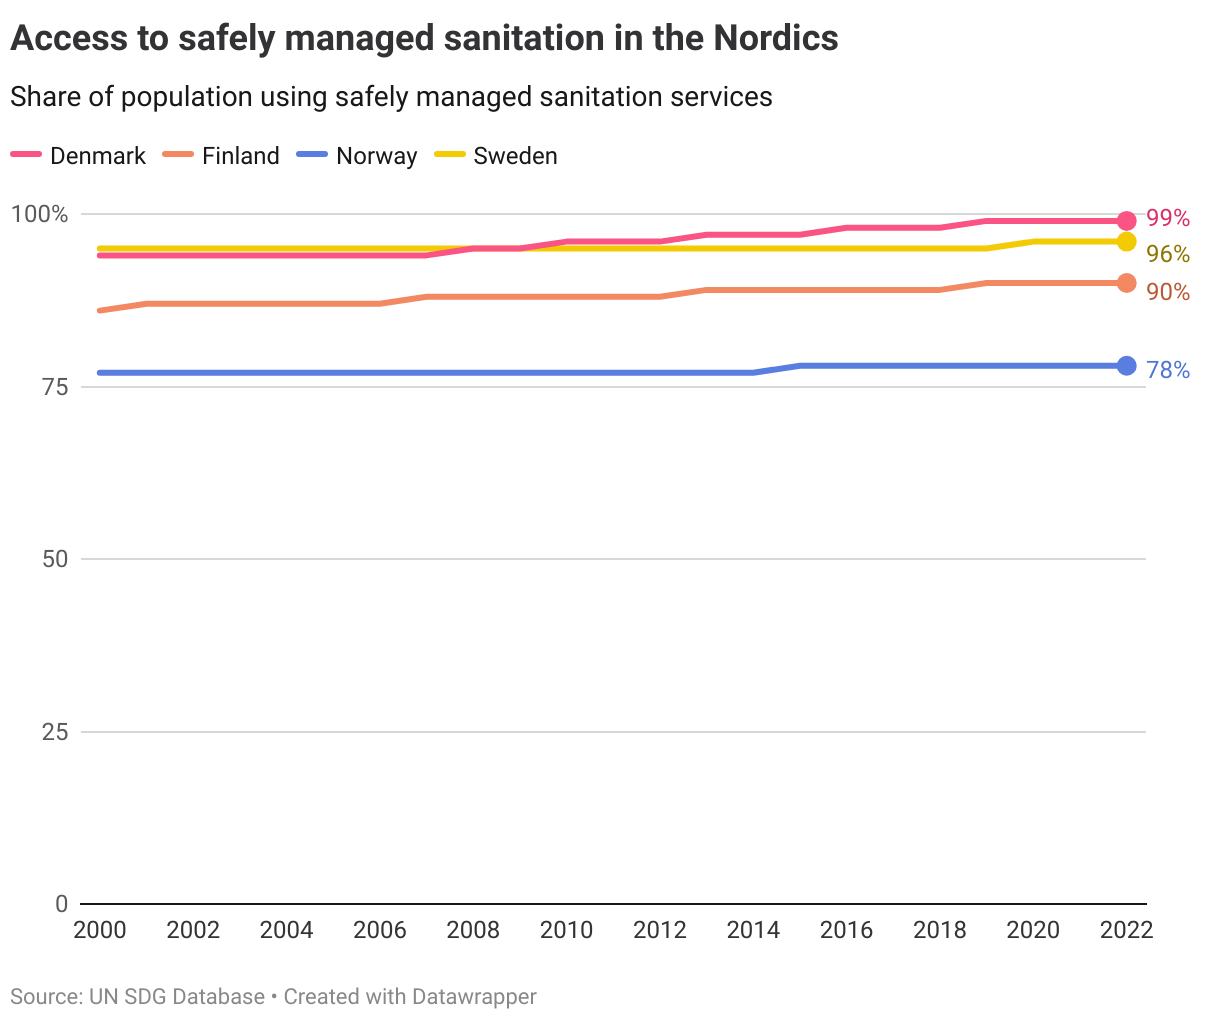
Data for the Nordic countries on the share of the population with access to safely managed sanitation services shows that only Denmark has achieved universal access (operationalised at above 97%), with Sweden and Finland within short distance.
As noted by the OECD, national contexts could mean that the levels achieved are close to the economic and technical limits of connection to water and sanitation services, with small and isolated communities served in other ways.
Denmark
Target is on track
Finland
Short distance to target
Iceland
Data not available
Norway
Long distance to target but progressing
Sweden
Short distance to target
Target 6.3
By 2030, improve water quality by reducing pollution, eliminating dumping and minimizing release of hazardous chemicals and materials, halving the proportion of untreated wastewater and substantially increasing recycling and safe reuse globally
| 6.3.1 | Proportion of domestic and industrial wastewater flows safely treated |
| 6.3.2 | Proportion of bodies of water with good ambient water quality |
Global trends
6.3.1. Wastewater flows
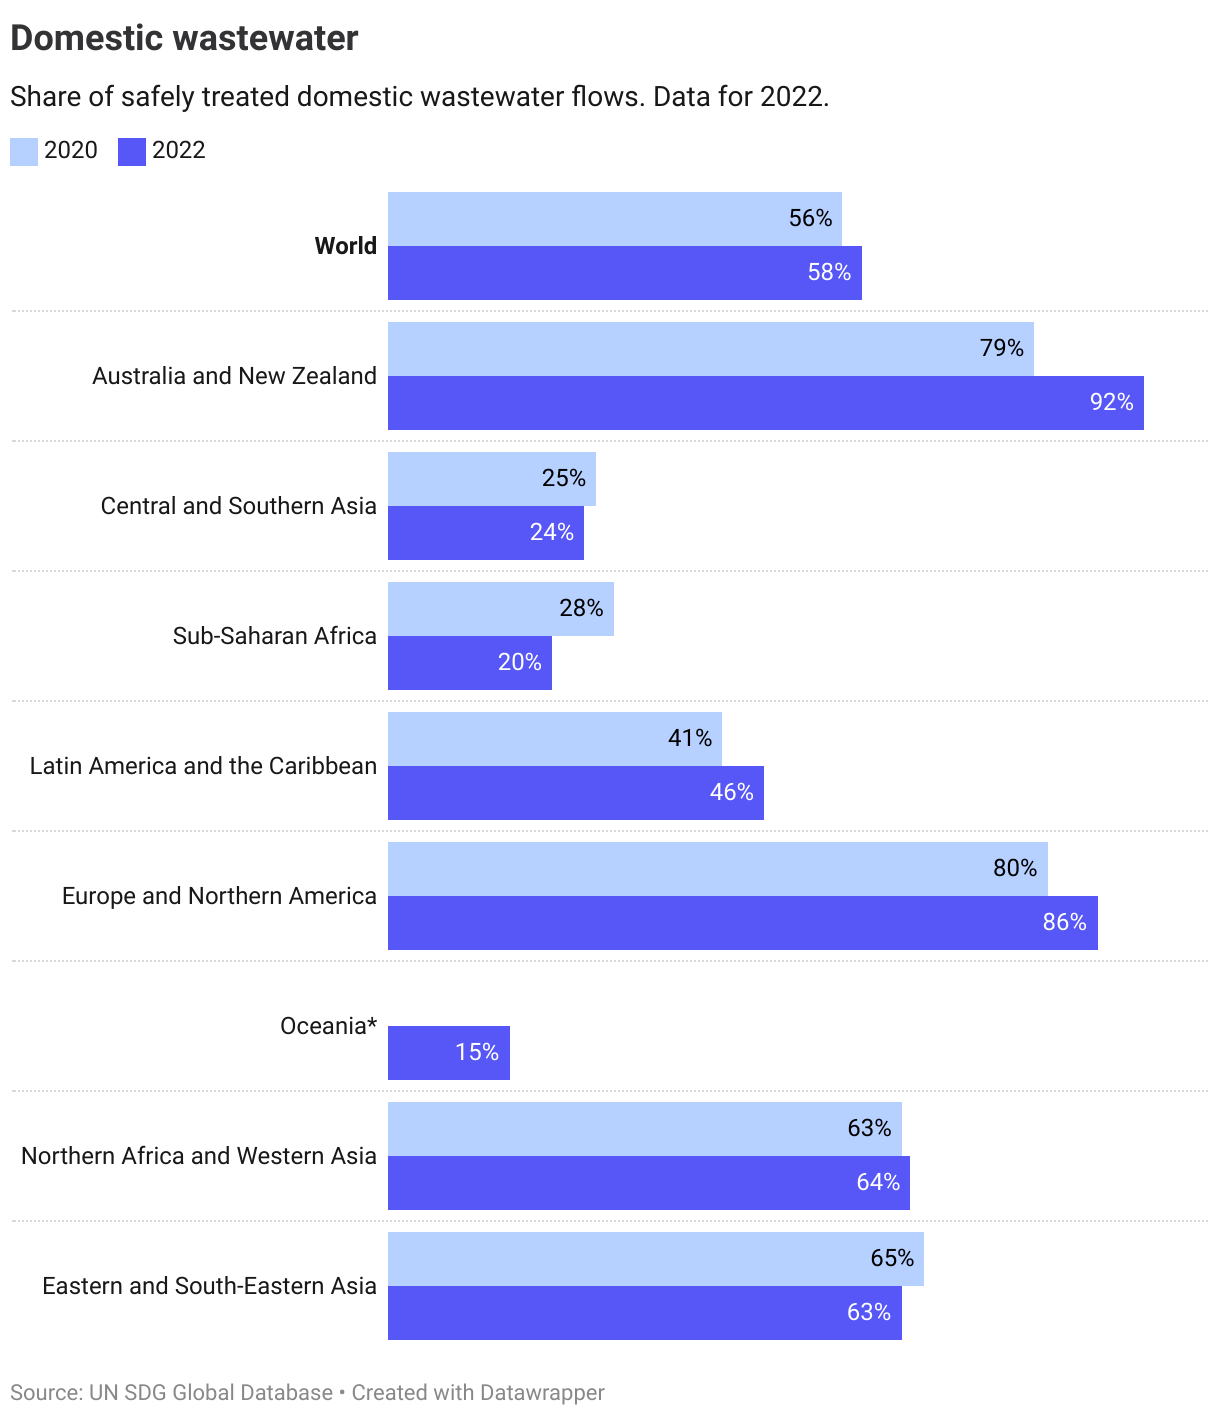
The latest data from 2022 on domestic wastewater flows shows that globally 58% of wastewater is safely treated before discharge into the environment. Data is only available for 2020 and 2022, showing an increase from 56% in 2020. Regionally, the highest rates are found in Australia and New Zealand and the lowest in the rest of Oceania.
There is a lack of data on industrial wastewater. The UN has previously estimated that only a third of industrial wastewater was safely treated (based on data from 2015). However, the data sample included only 42 countries (covering 18% of the world population), illustrating the urgent need for more accurate data.
6.3.2. Water quality
Data on water quality is also lacking. The most recent UN estimate based on data from a sample of 97 countries, showed that only 60% of water was of good ambient quality. However, only 1% of the water bodies included in the sample were in the poorest countries. As the UN notes in the SDG 2023 progress report:
a lack of data poses a risk to more than 3 billion people living in
areas where the quality of freshwater is unknown.
The Nordics
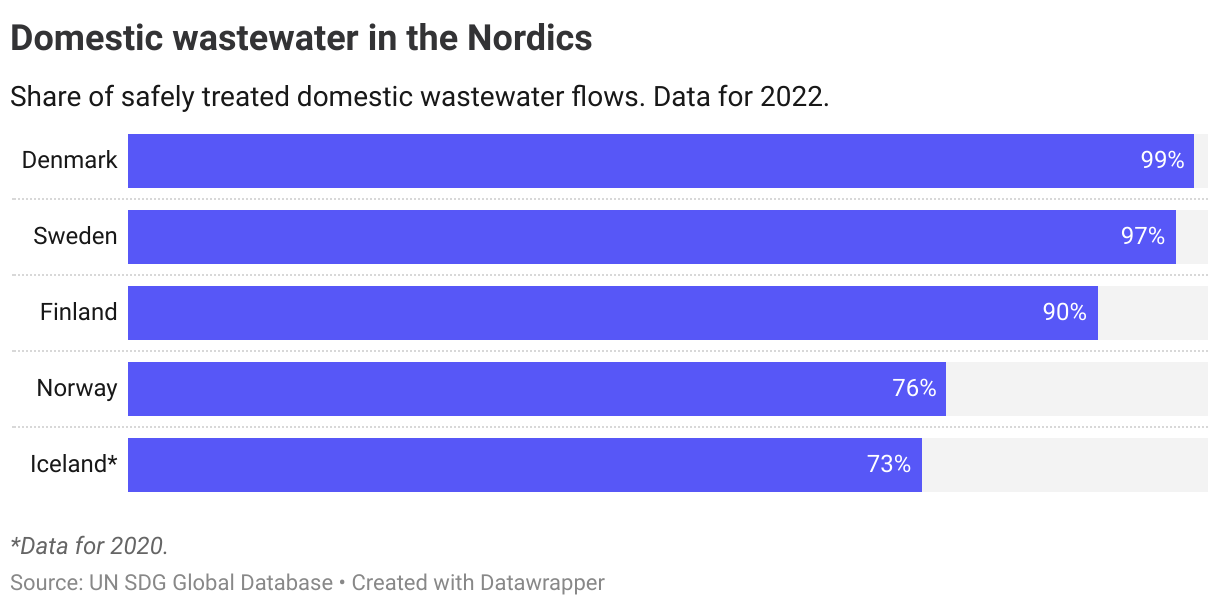
Denmark, Sweden and Finland all have close to full safe treatment of all domestic wastewater, while Norway and Iceland are below the European average of 80%.
The available data on water quality shows that, on average, Norway, Finland and Iceland have a high share with good ambient water quality.
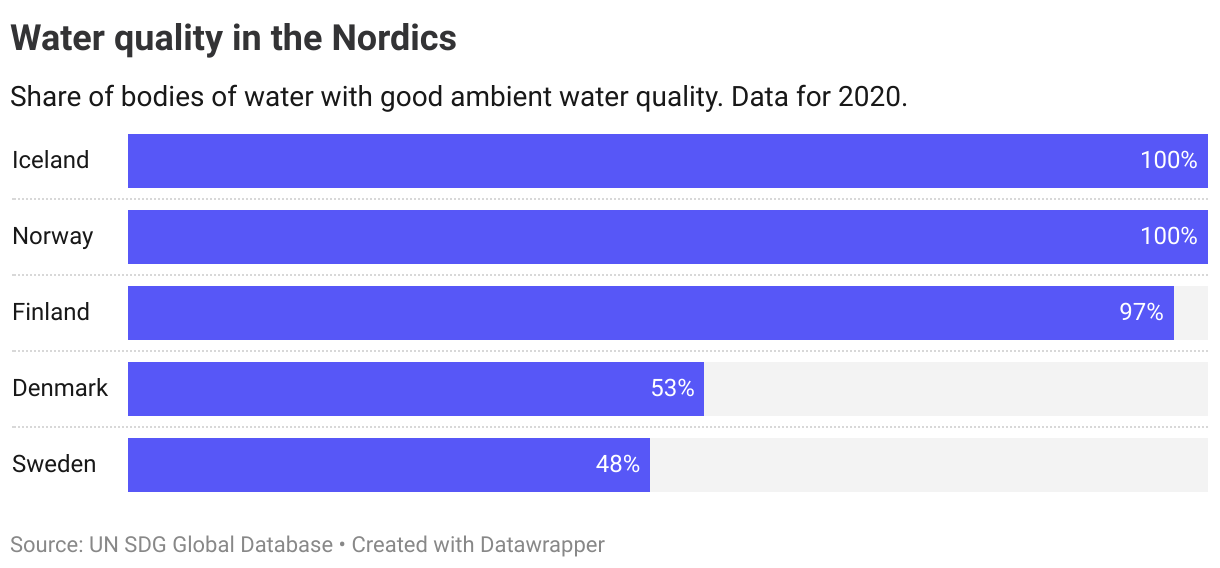
A combined assessment of all the indicators covered shows that Norway and Iceland have met the target, with Finland at short distance and Sweden and Denmark both at a long distance away from the target.
Denmark
Long distance to target, not progressing
Finland
Short distance to target
Iceland
Target is met
Norway
Target is met
Sweden
Long distance to target, not progressing
Target 6.4
By 2030, substantially increase water-use efficiency across all sectors and ensure sustainable withdrawals and supply of freshwater to address water scarcity and substantially reduce the number of people suffering from water scarcity
| 6.4.1 | Change in water-use efficiency over time |
| 6.4.2 | Level of water stress: freshwater withdrawal as a proportion of available freshwater resources |
Global trends
6.4.1. Water-use efficiency
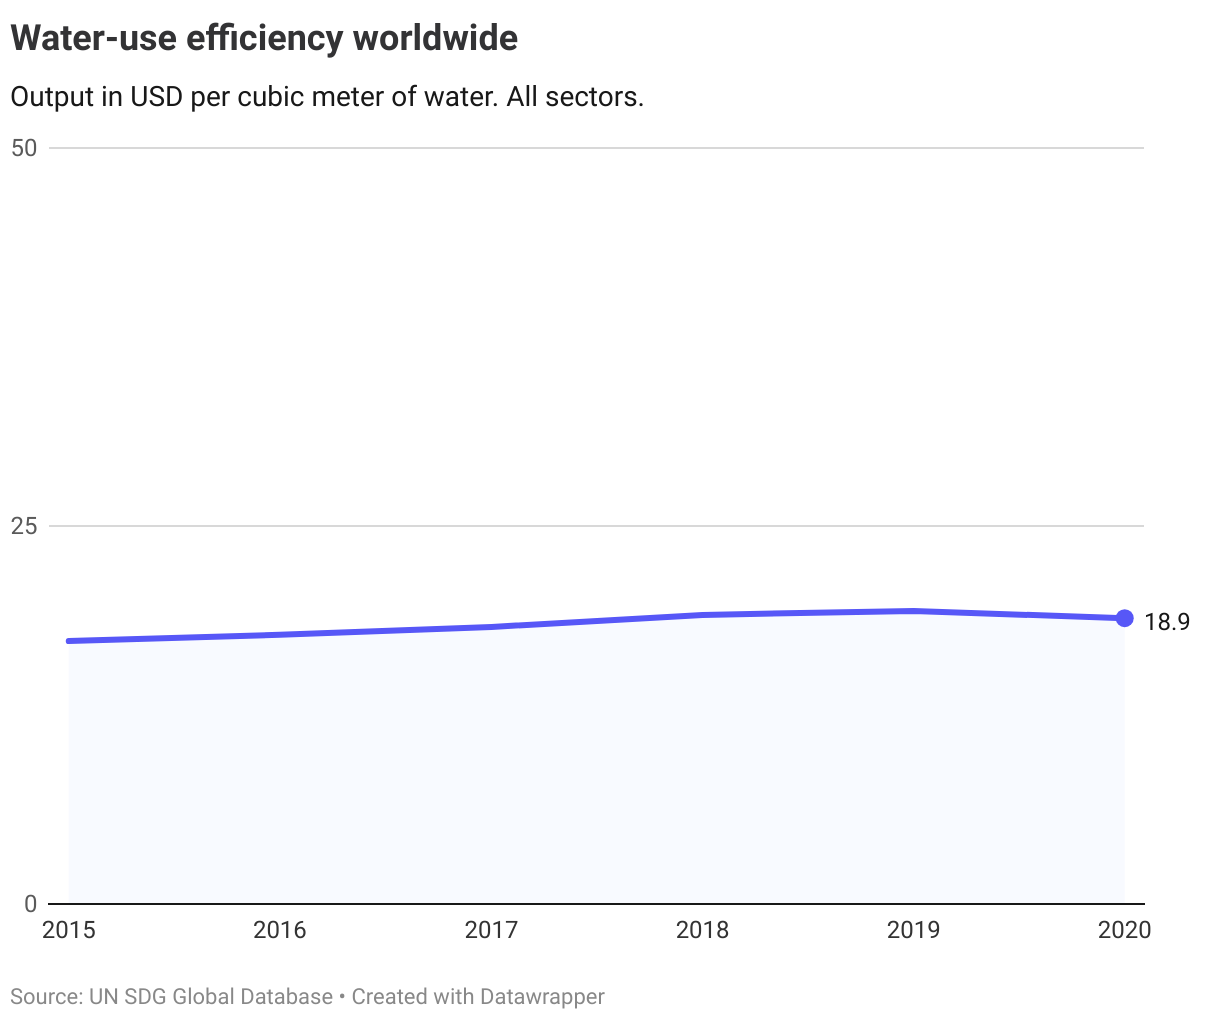
Water-use efficiency (WUE) is defined as the value added of a given major sector divided by the volume of water used. Globally, WUE increased from 17.4 USD per cubic meter of water in 2015 to 18.9 USD in 2020. The increase means that water-use efficiency rose by around 8% as more output was produced per cubic meter of water.
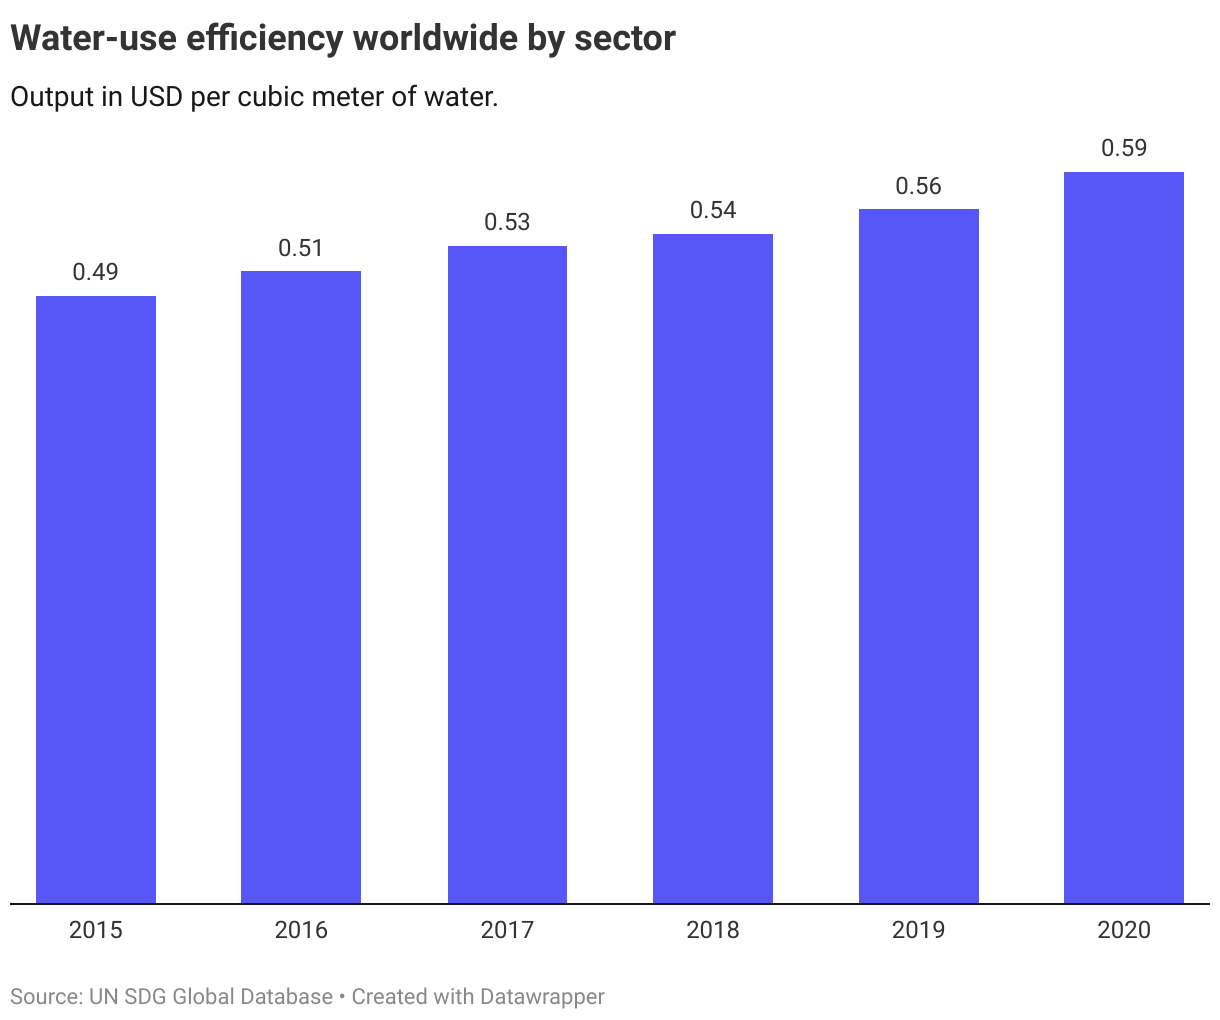
Water-use efficiency varies significantly between sectors. Agriculture is the largest water-use sector, but the water-use efficiency was only 0.59 USD per cubic meter of water in 2020, up from 0.49 USD in 2015.
All sectors have increased their water-use efficiency compared to 2015. Further improving efficiency, especially in the agricultural sector, is a key challenge in light of the increased demand for water driven by population growth and economic growth.
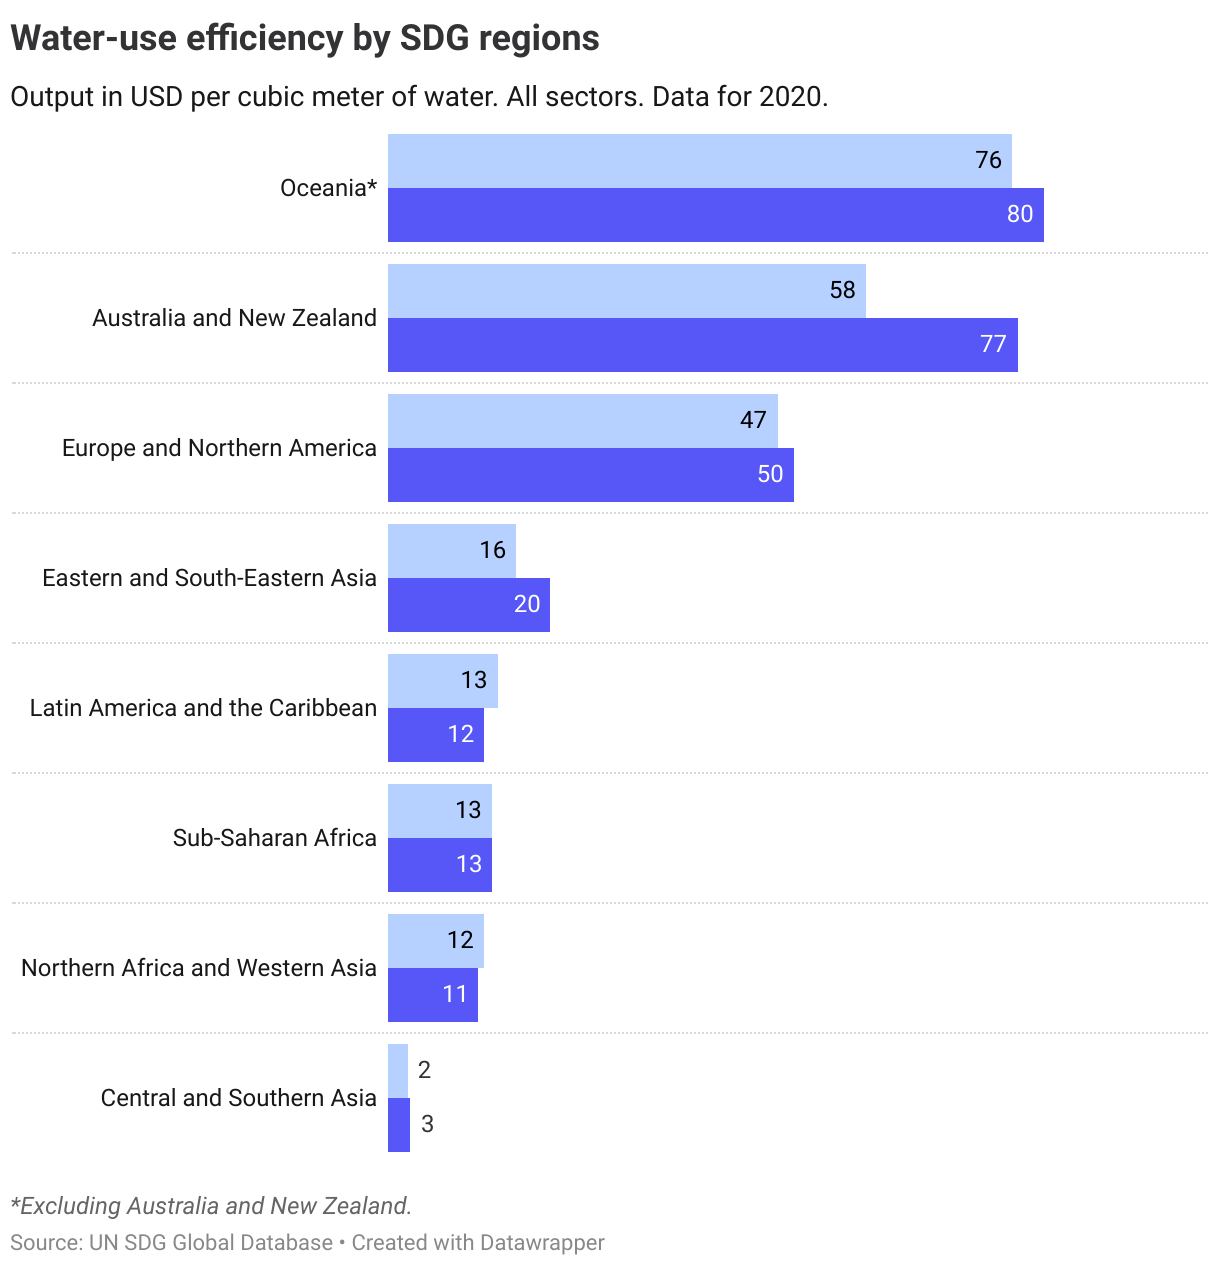
Regionally, water-use efficiency ranges from 3 USD in Central and Southern Asia to 80 USD in Oceania. Most regions with the lowest efficiency rates have seen only marginal changes since 2015.
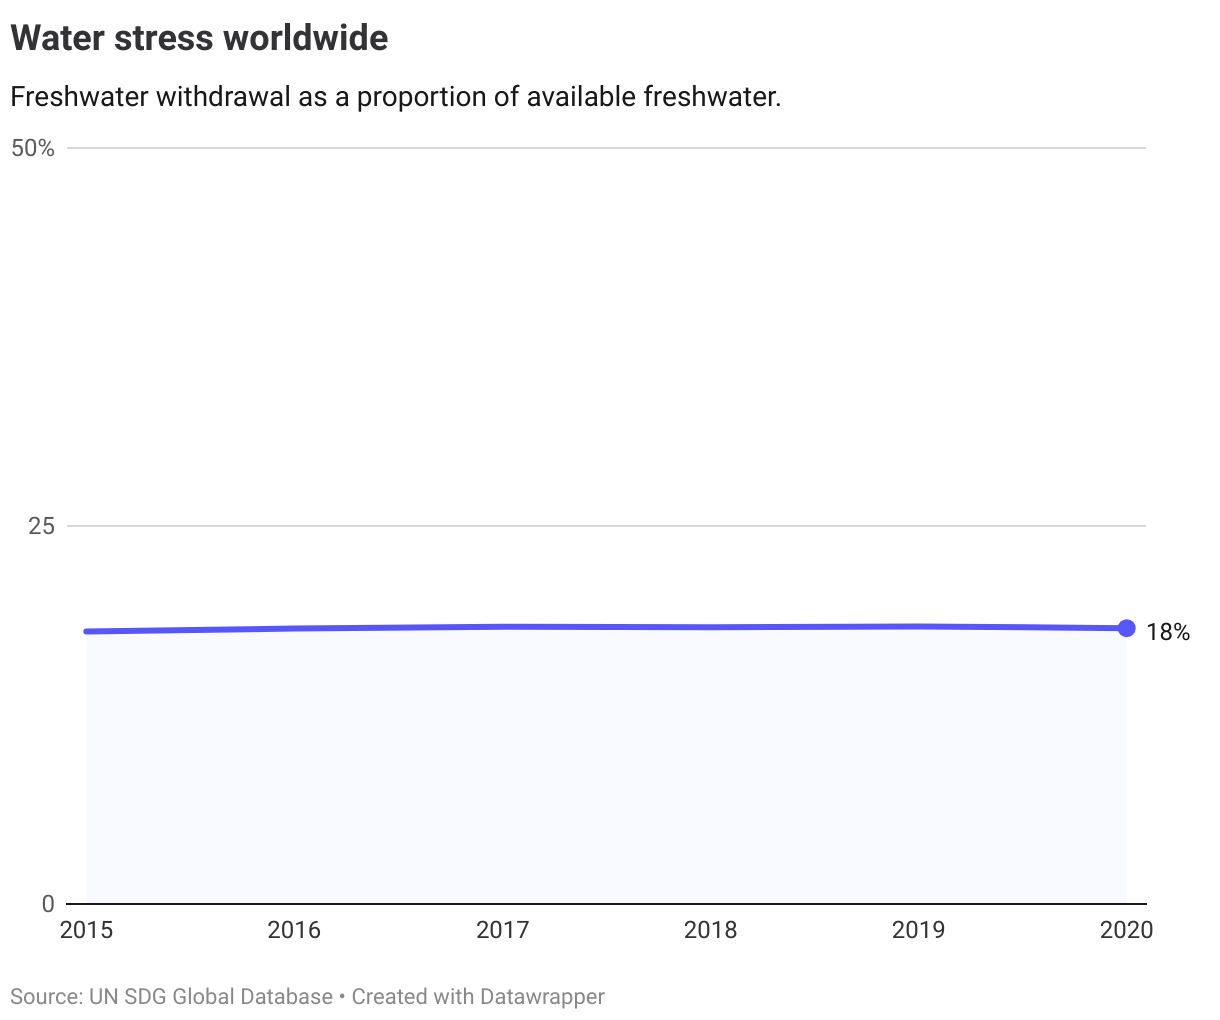
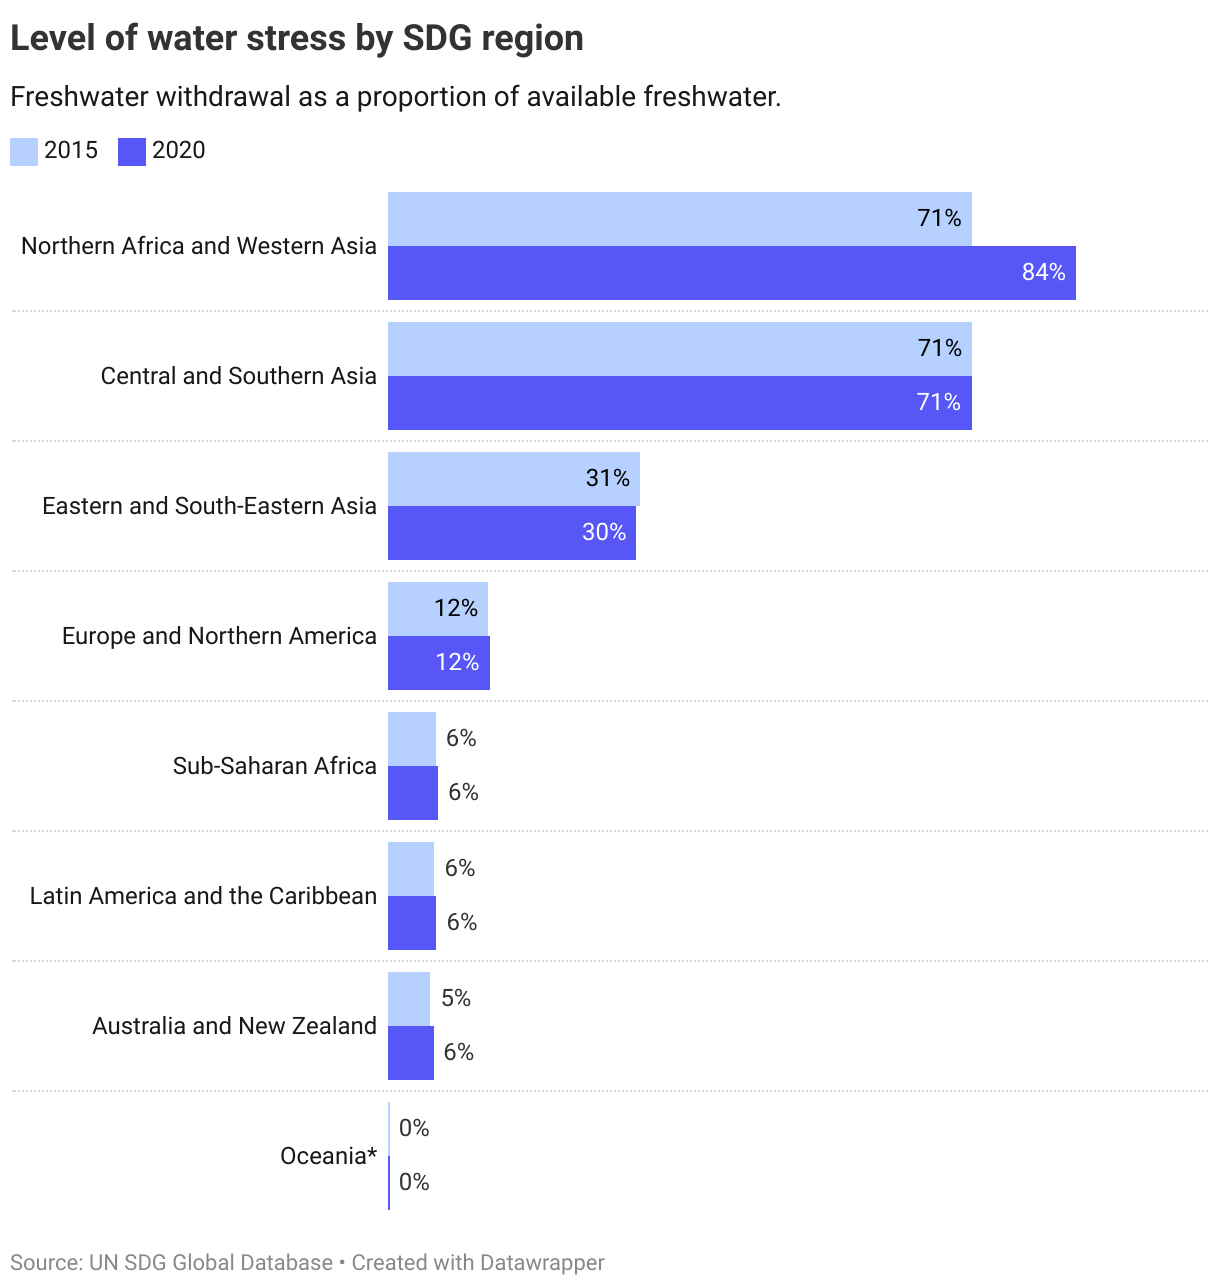
6.4.2. Water stress
Water stress is defined as occuring when more than 25% of available freshwater resources are withdrawn. Globally, the current ratio is at 18%, unchanged from 2015. Global water stress can thus be said to be below the “water-stress” threshold.
Northern Africa and Western Asia, is the only region were water stress is classified as being at a high level (between 75-100%), with over 84% of available freshwater resources withdrawn in 2020, an increase from 71% in 2015.
The Nordics
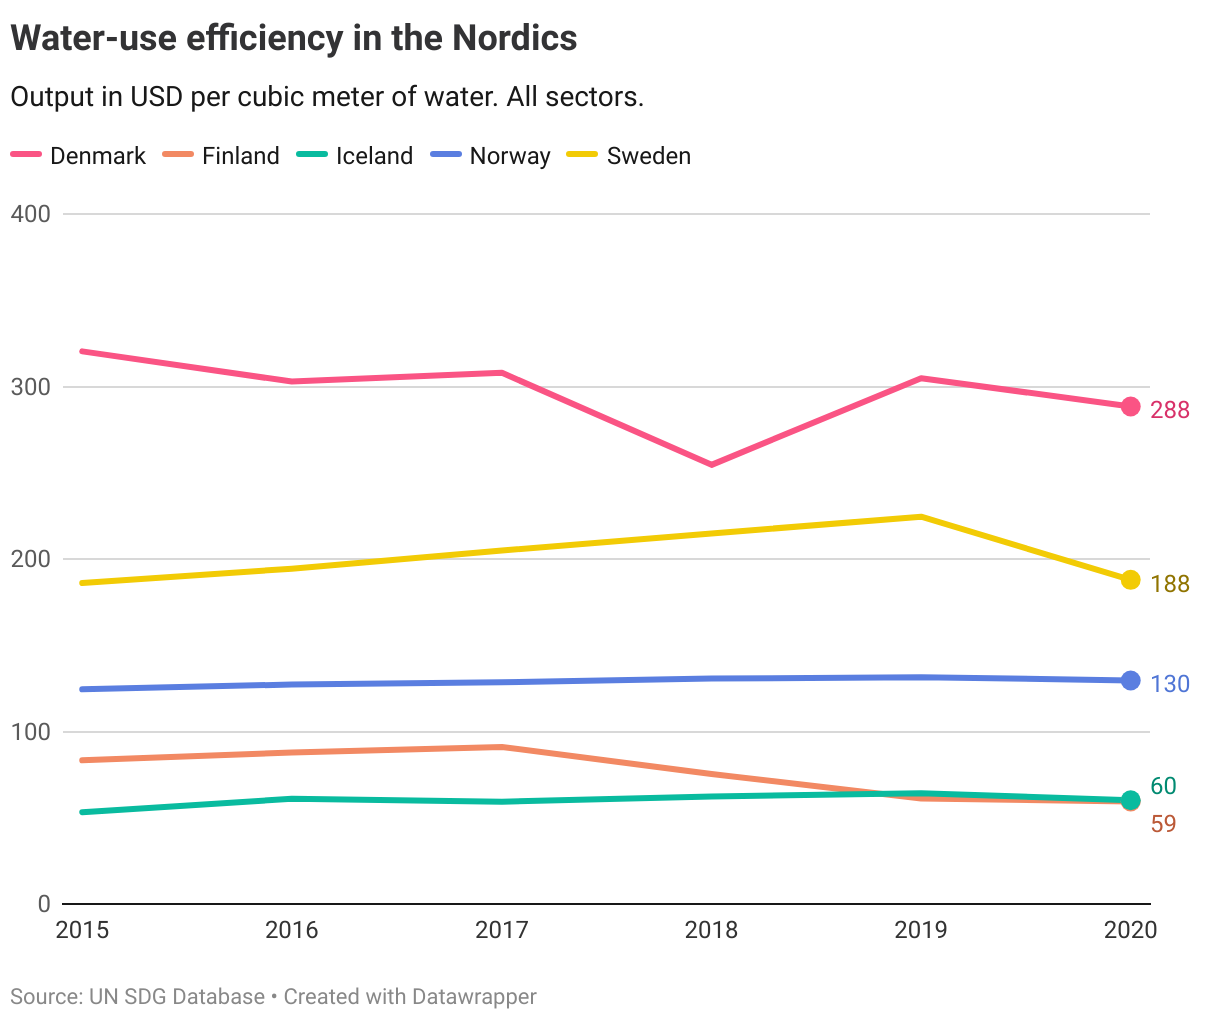
Water-use efficiency (indicator 6.4.1) in the Nordic countries is higher than the average for Europe and Northern America at 50 USD per cubic meter of water. There are significant regional variations, however, with Denmark having the highest efficiency, over five times as high as in Iceland which has the lowest water efficiency.
The target level for this indicator has been set at the level of the best OECD performers in 2015 (above 270), a level which currently only Denmark meets.
Notwithstanding the high water efficiency, Denmark is the Nordic country with the highest level of water stress (indicator 6.4.2). It is currently the only Nordic country not meeting the target operationalised by the OECD at being below 10%.
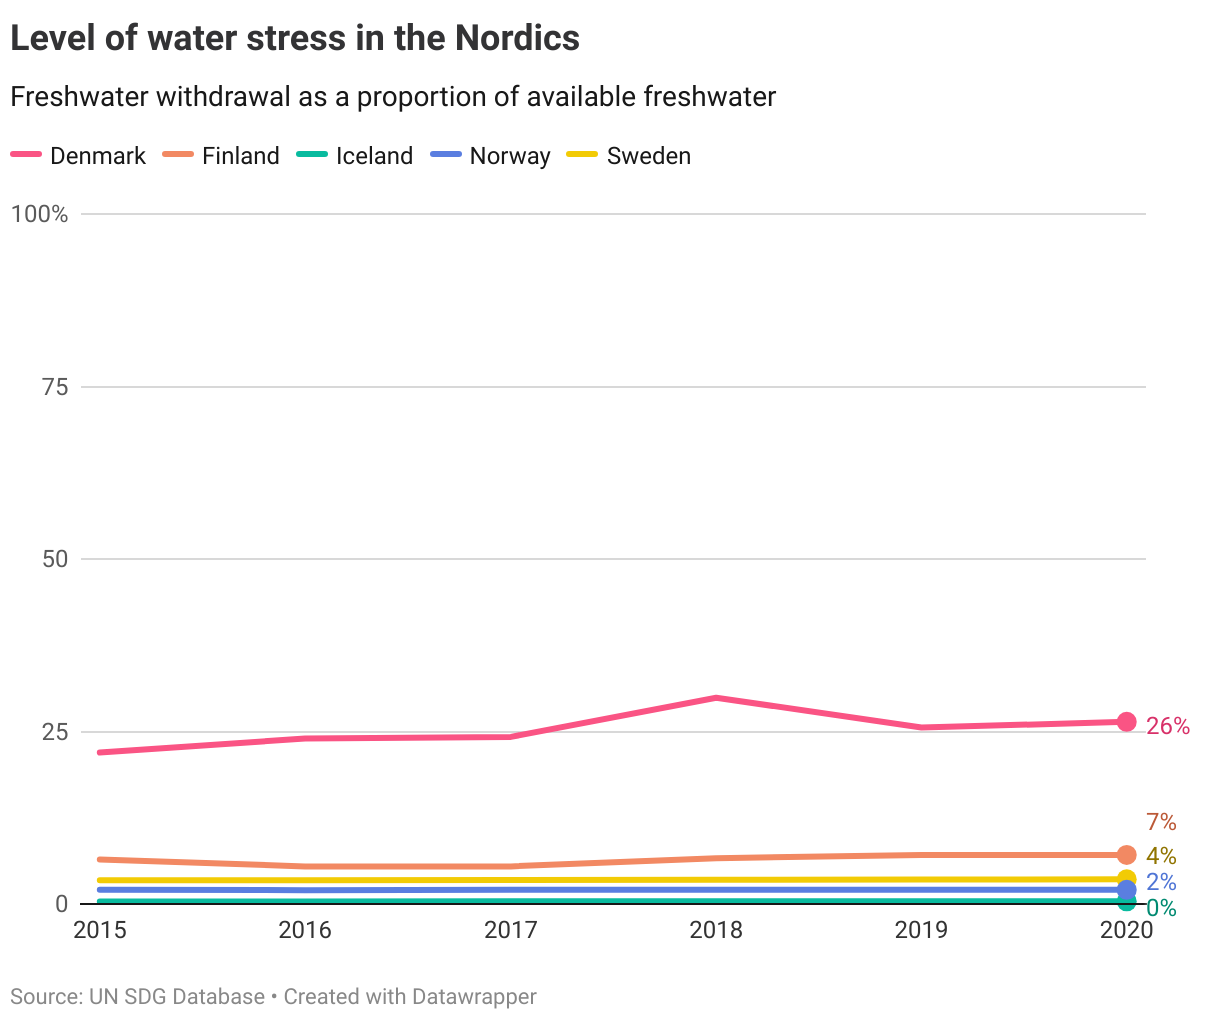
A combined assessment shows that while no country has achieved the target level on both indicators, all are at a short distance from the target.
Denmark
Short distance to target
Finland
Short distance to target
Iceland
Short distance to target
Norway
Short distance to target
Sweden
Short distance to target
Target 6.5
By 2030, implement integrated water resources management at all levels, including through transboundary cooperation as appropriate
| 6.5.1 | Degree of integrated water resources management |
| 6.5.2 | Proportion of transboundary basin area with an operational arrangement for water cooperation |
Global trends
6.5.1. Integrated water resources management
This indicator is measured by the degree of implementation of the internationally established framework of Integrated Water Resources Management (IWMR). In the framework, each country is surveyed with 33 questions covering four areas and given a score of implementation from 0 to 100. The four areas surveyed in the IWMR country survey are:
- Enabling environment: this includes the policies, laws, plans and strategies which create the ‘enabling environment’ for IWRM.
- Institutions and participation: includes the range and roles of political, social, economic and administrative institutions that help to support the implementation of IWRM.
- Management Instruments: The tools and activities that enable decision-makers and users to make rational and informed choices between alternative actions.
- Financing: Budgeting and financing made available and used for water resources development and management from various sources.
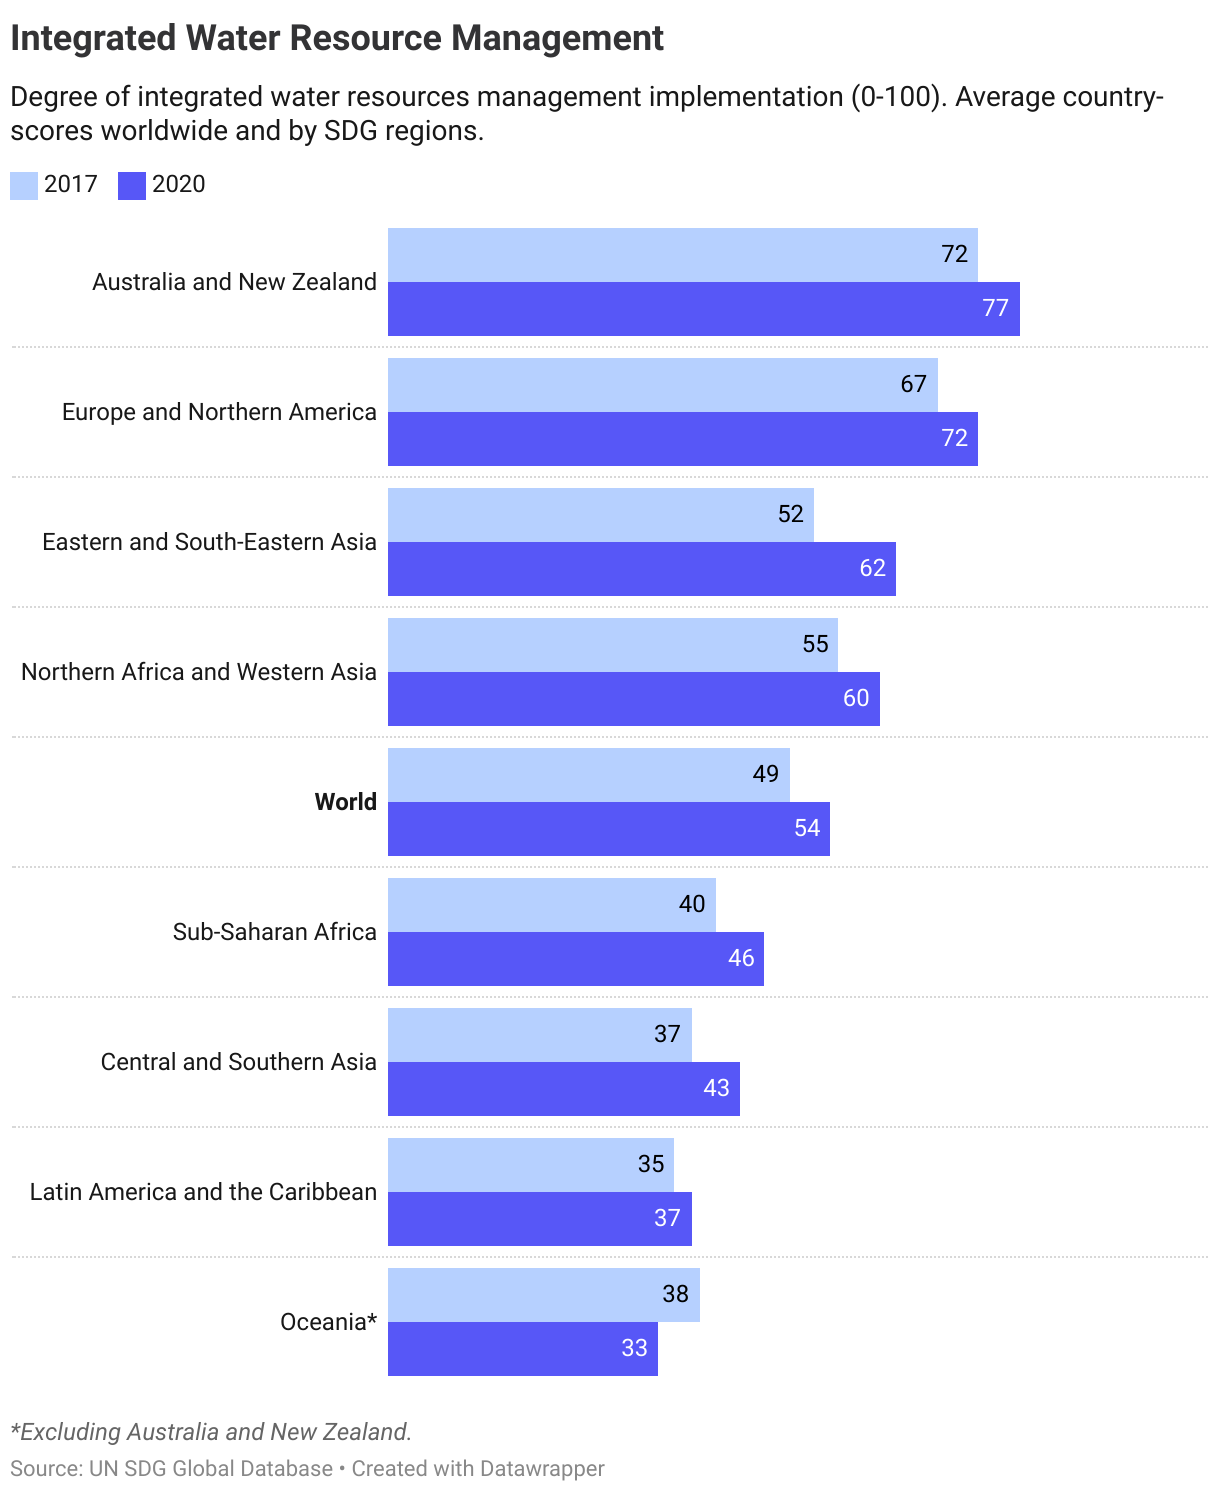
Out of the countries surveyed the average country score increased from 49 in 2017 to 54 in 2020, a growth rate which is insufficient to reach the target of 100 (full implementation) by 2030.
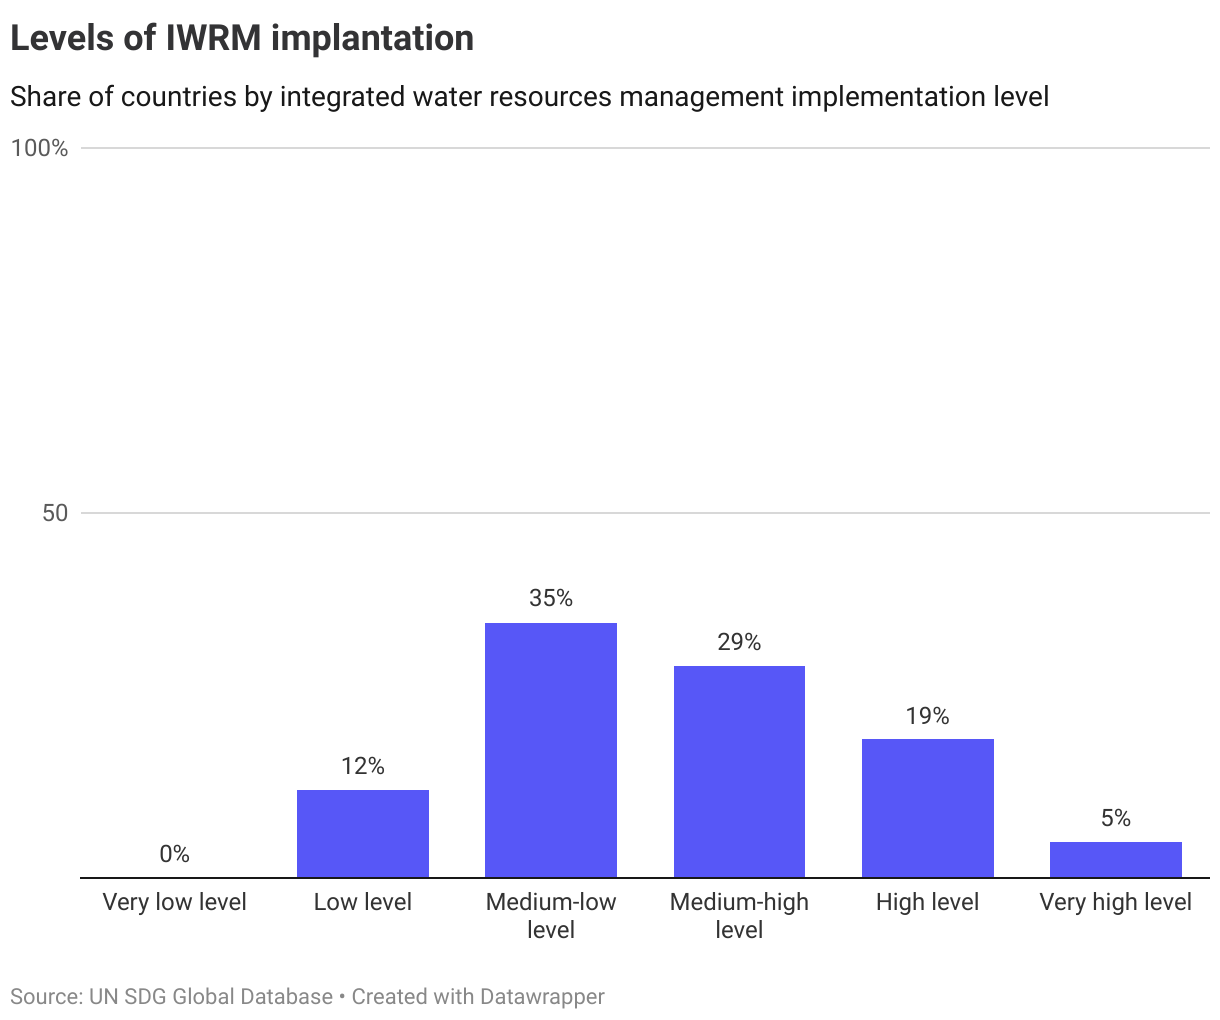
A closer look at the share of countries in each of the IWRM levels reveals that only 5% of countries are at the ‘Very high level’ of implementation (95-100), which is the 2030 target. In Central and Southern Asia, as well as in Latin America and the Caribbean, approximately 8 out of 10 countries are at a ‘Medium-low’ level or lower.
6.5.2. Water cooperation in transboundary basin areas
Water cooperation between countries is crucial for the sustainable management of transboundary basin areas. According to UN Water, 153 countries share transboundary waters covering 60 per cent of the world’s flow of freshwater.
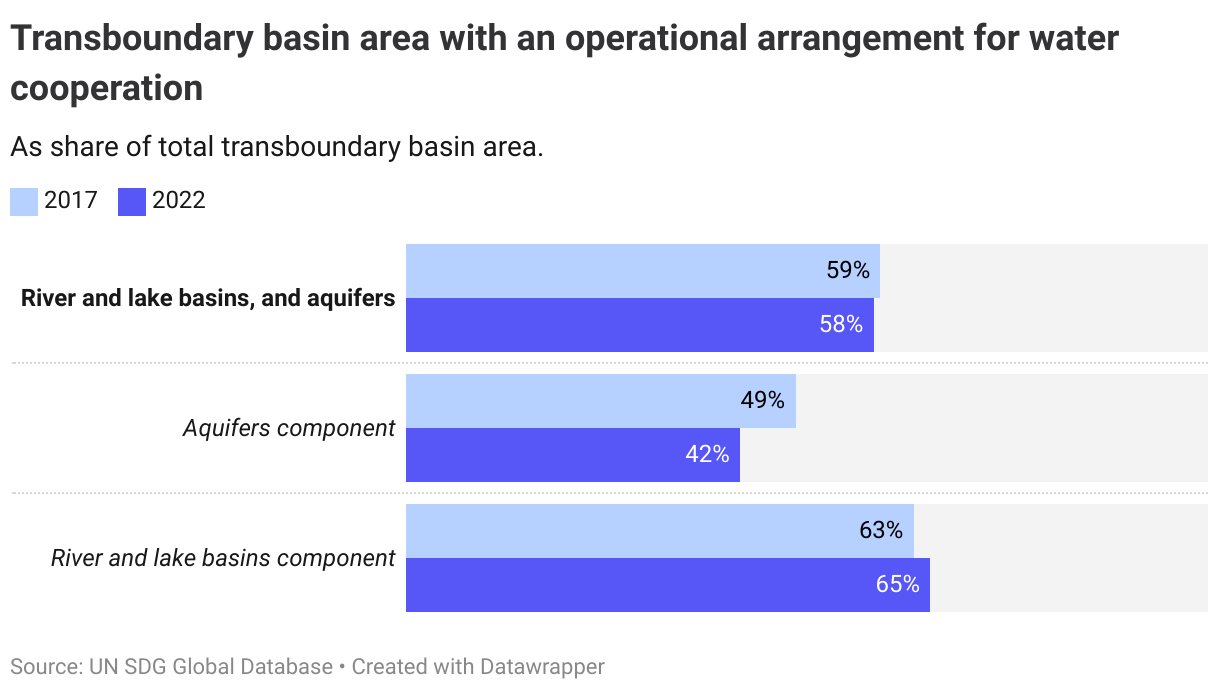
Data from 2022 shows that globally 58% of total transboundary basin areas were covered by an operational arrangement for water cooperation, almost unchanged from 59% in 2017. There is no set target for 2030, as the target wording is to implement IWRM ‘through transboundary cooperation as appropriate’.
The Nordics
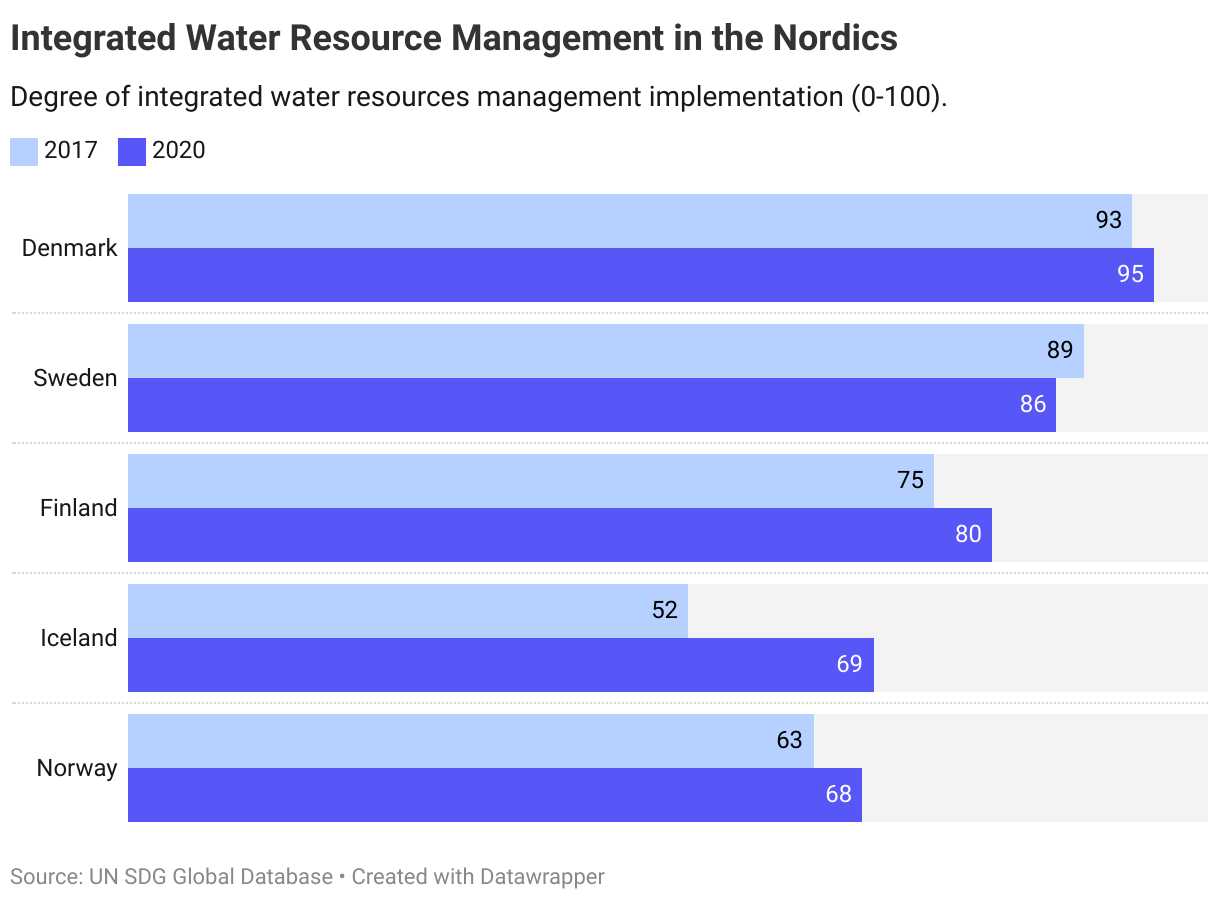
The level of IWRM implementation varies significantly between the Nordics. Denmark is the only Nordic country at the ‘Very high’ level. Sweden and Finland are at a ‘High’ level (80-95), while Iceland and Norway are only at a ‘Medium-high’ level (51-70). Since 2017, the IWRM levels have gone up in all countries besides Sweden.
While the Nordics have some way to go on IWRM implementation, Denmark, Finland and Sweden have all their transboundary basis covered by agreements for water cooperation. Norway has close to 90% of its transboundary area covered. (No data for Iceland is available.)
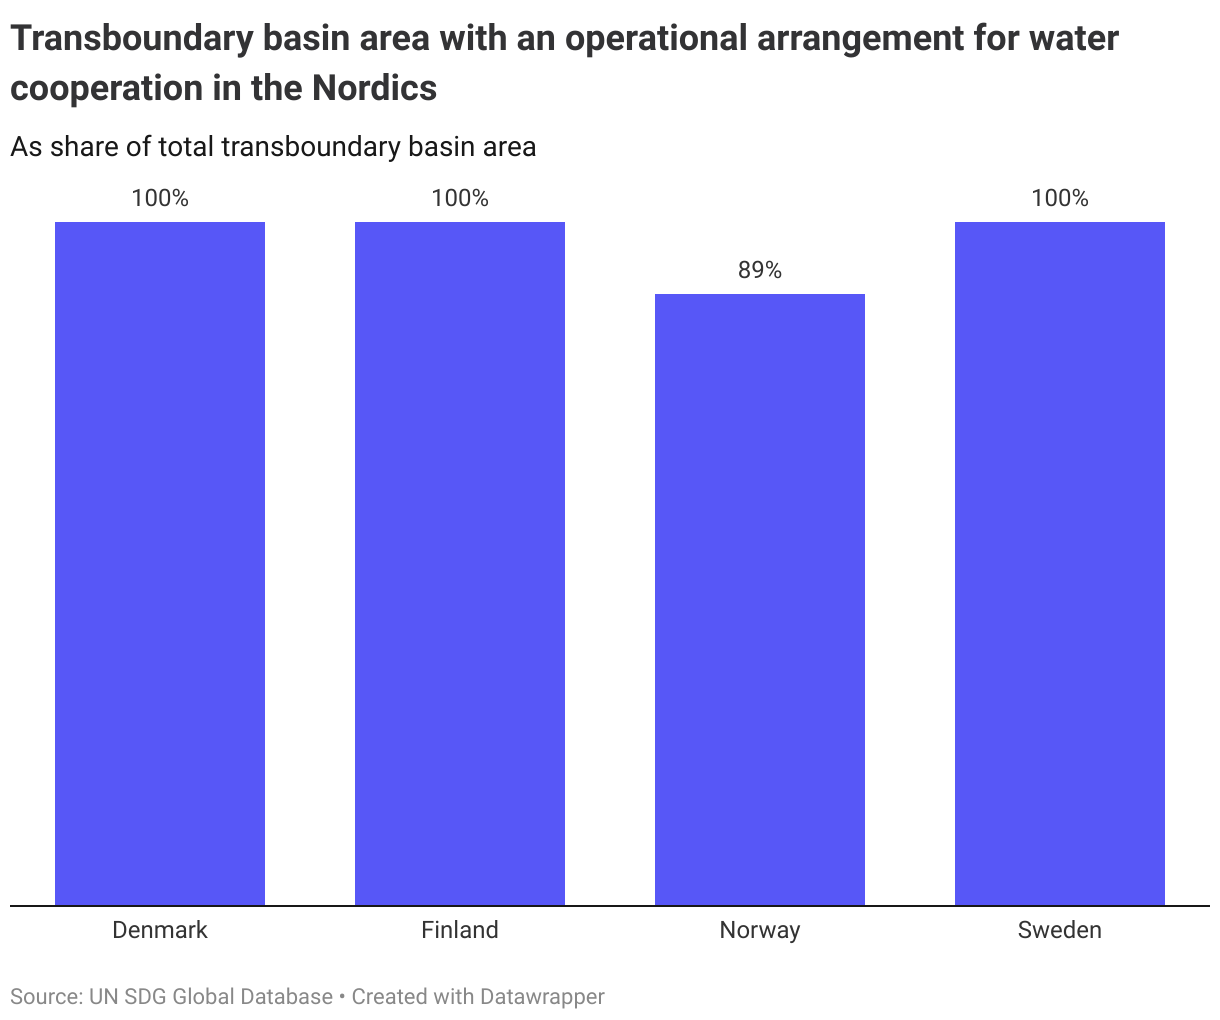
A combined assessment of the above indicators shows that Denmark, Finland and Sweden have met the target, while Norway is at a short distance. Data for Iceland is only available for IWRM implementation, where it is a long distance away from the target.
Denmark
Target is met
Finland
Target is met
Iceland
Long distance to target, not progressing
Norway
Short distance to target
Sweden
Target is met
Target 6.6
By 2020, protect and restore water-related ecosystems, including mountains, forests, wetlands, rivers, aquifers and lakes
| 6.6.1 | Change in the extent of water-related ecosystems over time |
Global trends
This indicator is measured through 22 data series on freshwater ecosystems, covering permanent water, seasonal water, reservoirs, wetlands, mangroves as well as water quality. Satellite images are used for several of the data series to calculate changes over time. Given the magnitude of data series available, no single data series is presented here, but rather a summary of the main findings from the latest UN progress report on this indicator:
- The extent of surface water bodies, such as lakes, rivers and reservoirs, are rapidly changing worldwide, with one in five river basins experiencing above-natural fluctuations in surface water over the past five years.
- Wetland ecosystems have suffered an 85 per cent loss in the past three centuries, primarily from drainage and land conversion.
- Since 1970, 81 per cent of species dependent on inland wetlands have declined, surpassing declines in other biomes, and an increasing number are at risk of extinction.
The Nordics
This section is to be expanded.
Target 6.a
By 2030, expand international cooperation and capacity-building support to developing countries in water- and sanitation-related activities and programmes, including water harvesting, desalination, water efficiency, wastewater treatment, recycling and reuse technologies
| 6.a.1 | Amount of water- and sanitation-related official development assistance that is part of a government-coordinated spending plan |
Global trends
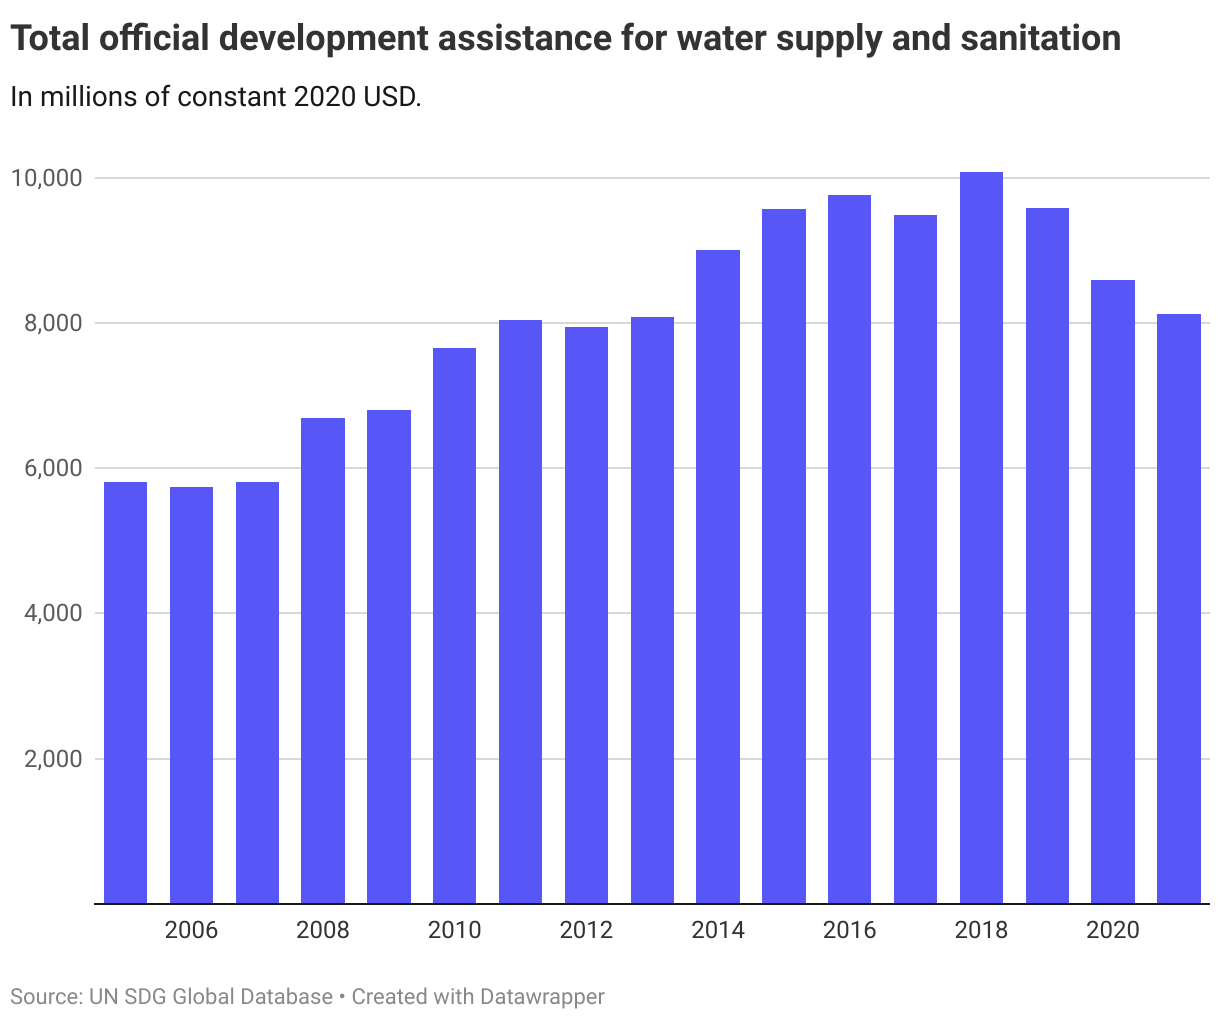
While the target is to expand international cooperation and capacity building on water and sanitation, there is no set target for 2030 for this indicator. The chart below shows the evolution of official development assistance (ODA) over time. While ODA to water and sanitation increased from 2005 to 2018, it has fallen over the last years.
The Nordics
No assessment of progress is made for this indicator, as the sectoral distribution of ODA will depend on many factors, including national priorities.
Target 6.b
Support and strengthen the participation of local communities in improving water and sanitation management
| 6.b.1 | Proportion of local administrative units with established and operational policies and procedures for participation of local communities in water and sanitation management |
No data available at the global or regional level. At the Nordic country level, data is only available for Norway.
Global trends
The latest data from 2019 shows that around 7 out of 10 countries have procedures for user and community participation in water planning programmes. Yet, just 3 of 10 countries have a high level of actual participation in such programmes. Such participation is seen as crucial to ensure that user and community needs are met.
The Nordics
No data is available for the Nordic countries on this target.