

Introduction
This data tracker analyses the Nordic countries’ progress towards achieving Sustainable Development Goal 17: Strengthen the means of implementation and revitalize the Global Partnership for Sustainable Development. The goal is comprised of 19 targets.
The Nordic countries – Denmark, Finland, Iceland, Norway and Sweden – are classified into one of five categories for each target:
Met: The country has already met the 2030 target.
On track: The country has not yet met the target but is on track to do so by 2030.
Short distance: The country has not met the target and is not projected to do so but is close to achieving it. This category also applies when the country currently meets the target but is projected to move away from it.
Long distance but progressing: The country is far from the target but is making progress towards it.
Long distance and not progressing: The country is far from the target and is not making progress towards reaching it.
Details on the methodology used, together with the overall assessment for all 17 goals, can be found on our overview page. Note that the analysis is currently work in progress.
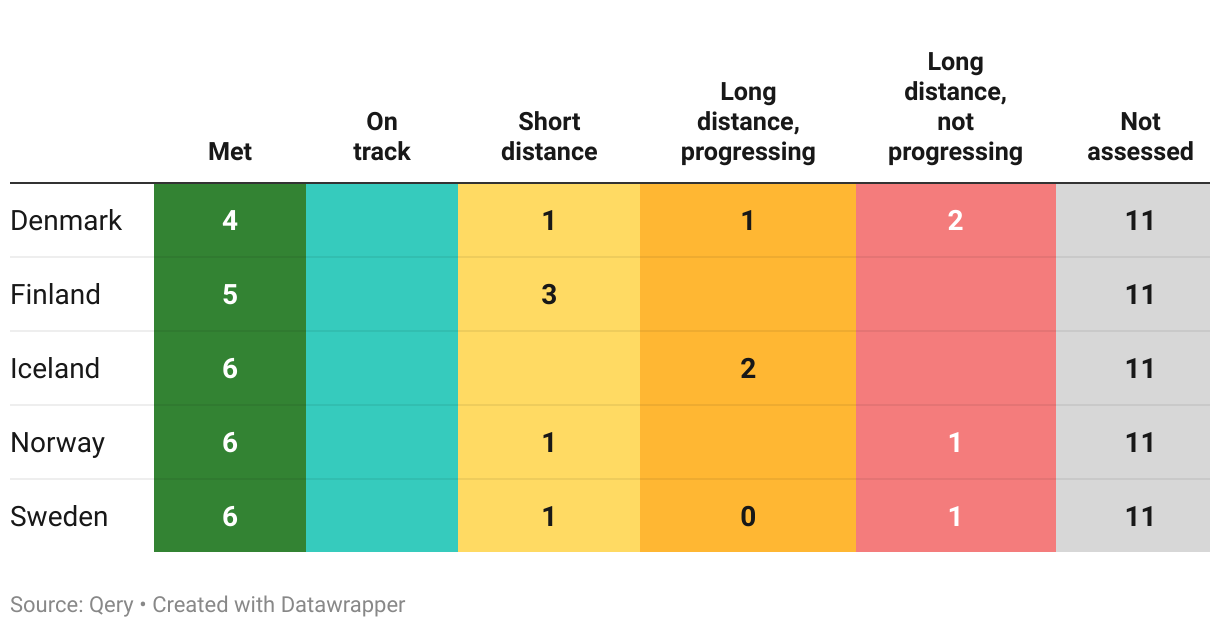
Overall assessment of progress
As of mid-2023, this is our assessment of the Nordic countries progress on the 19 targets part of SDG 17:
The Nordic countries’ performance on the different targets part of this goal can be explored further below. Each section follows the same structure:
- First, the official target text and related indicators is described and the latest global and regional trends are highlighted briefly.
- Second, where data is available, we then zoom in on the Nordic countries to describe how they are progressing, and assess their likelihood of achieving the target by the 2030 deadline.
- Note that both sections above strictly uses data from the UN SDG Global Database and/or the OECD.
Target 17.1
Strengthen domestic resource mobilization, including through international support to developing countries, to improve domestic capacity for tax and other revenue collection
| 17.1.1 | Total government revenue as a proportion of GDP, by source |
| 17.1.2 | Proportion of domestic budget funded by domestic taxes |
Global trends
17.1.1. Total government revenue
Total government revenue accounted for around a third of GDP on average worldwide in 2021, a level which has remained largely stable over the past decade.
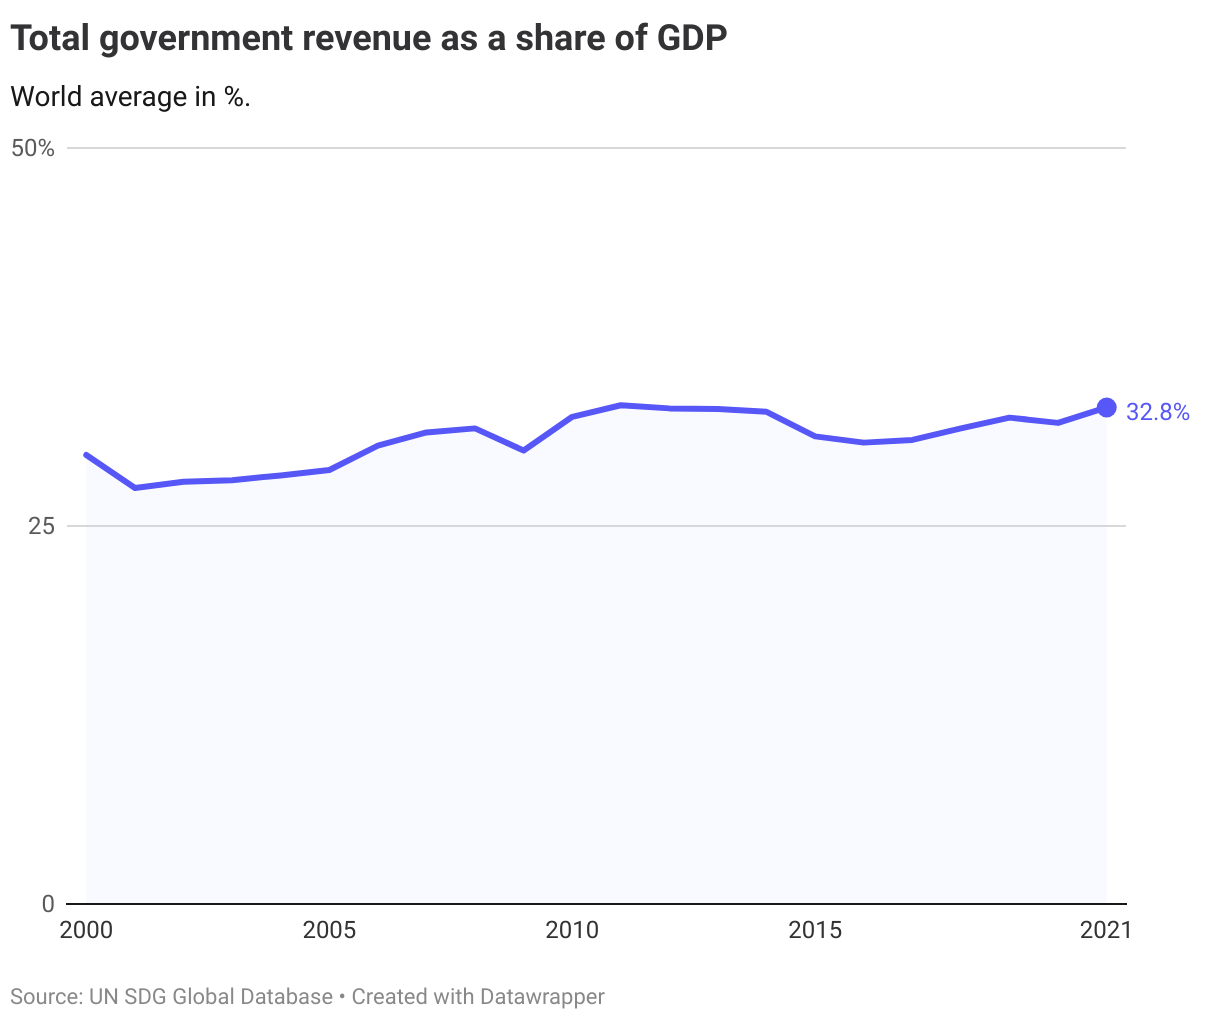
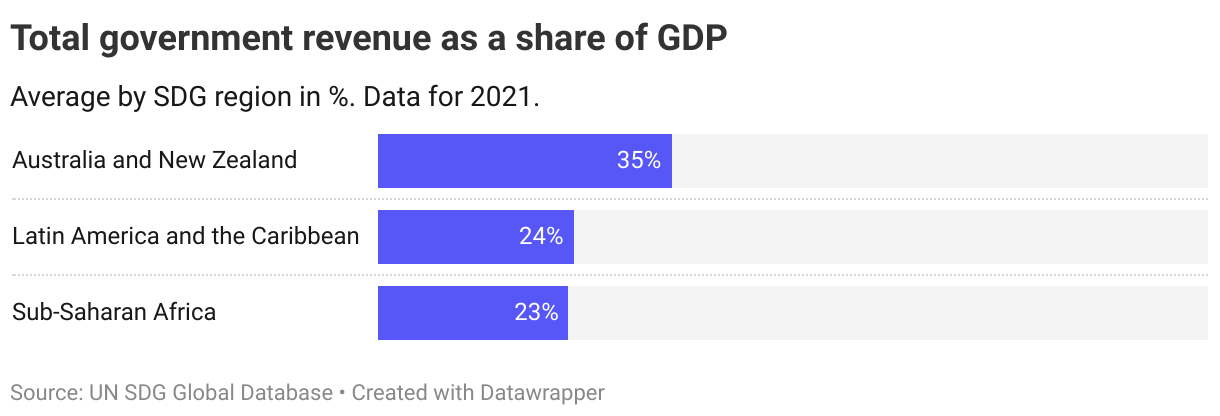
Most regions are close to the worldwide average level, with the exception of Latin America and the Caribbean and Sub-Saharan Africa. Here total government revenue stands at around one-fourth of GDP (regional aggregate).
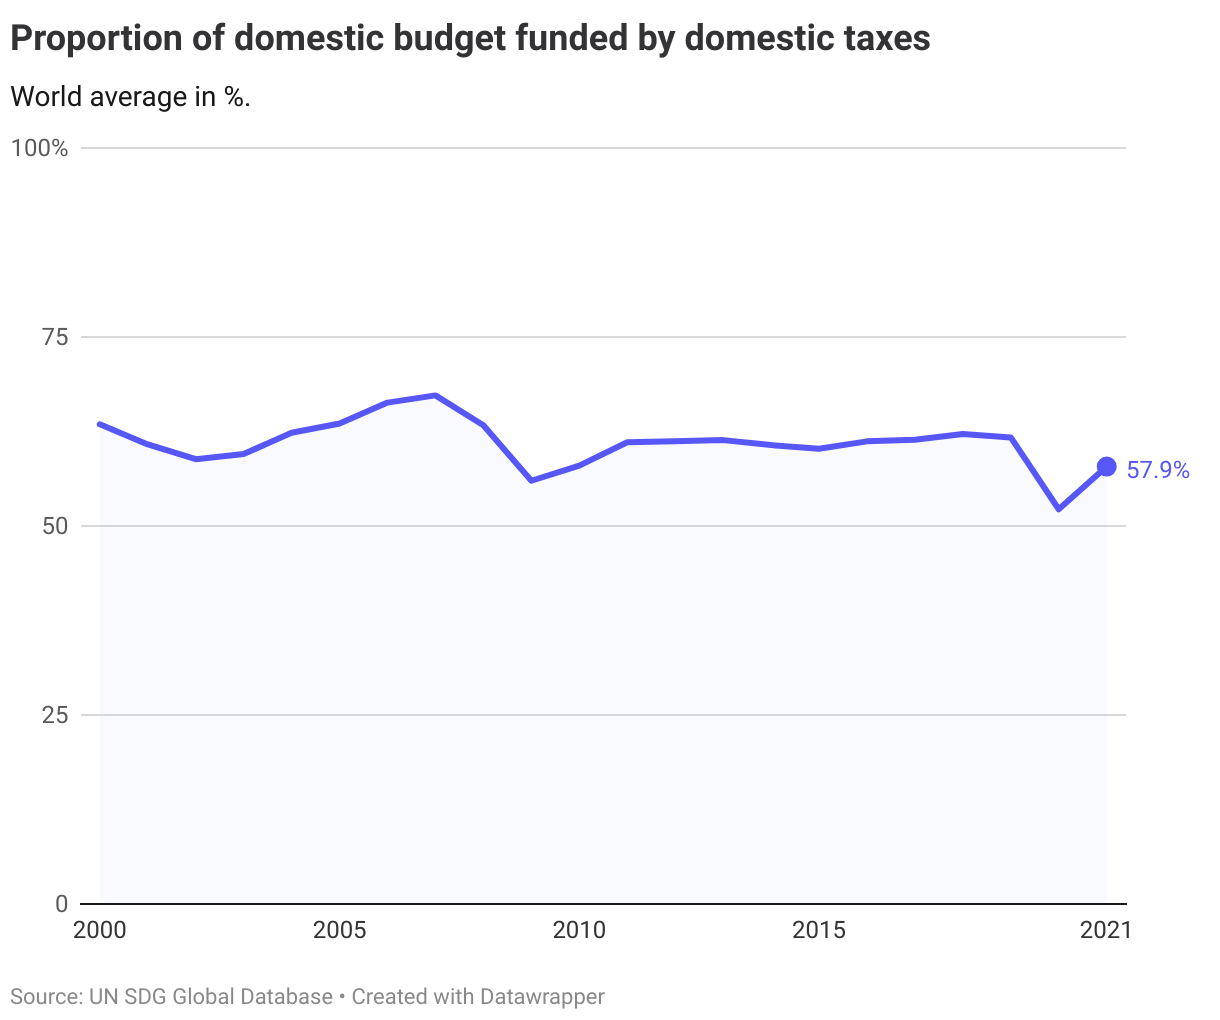
17.1.2. Share of domestic budget funded by domestic taxes
The share of the domestic budget funded by domestic taxes had pre-pandemic been at a relatively stable level of around 60% on average worldwide but declined to around 50% in 2020 as the pandemic negatively impacted economies worldwide.
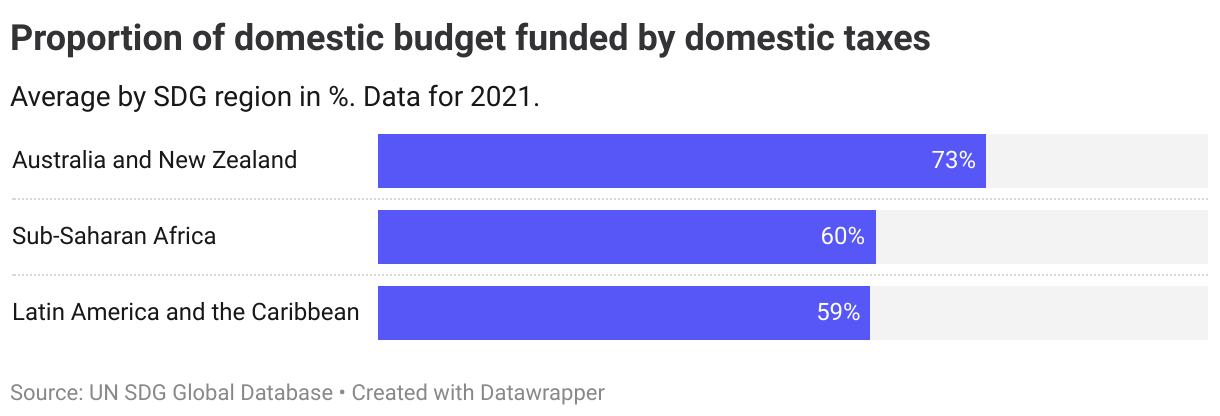
Note that the regional groupings used in the visualisation above (and all other visualisations on this page with regional data) follow the UN regional classification for the Sustainable Development Goals.
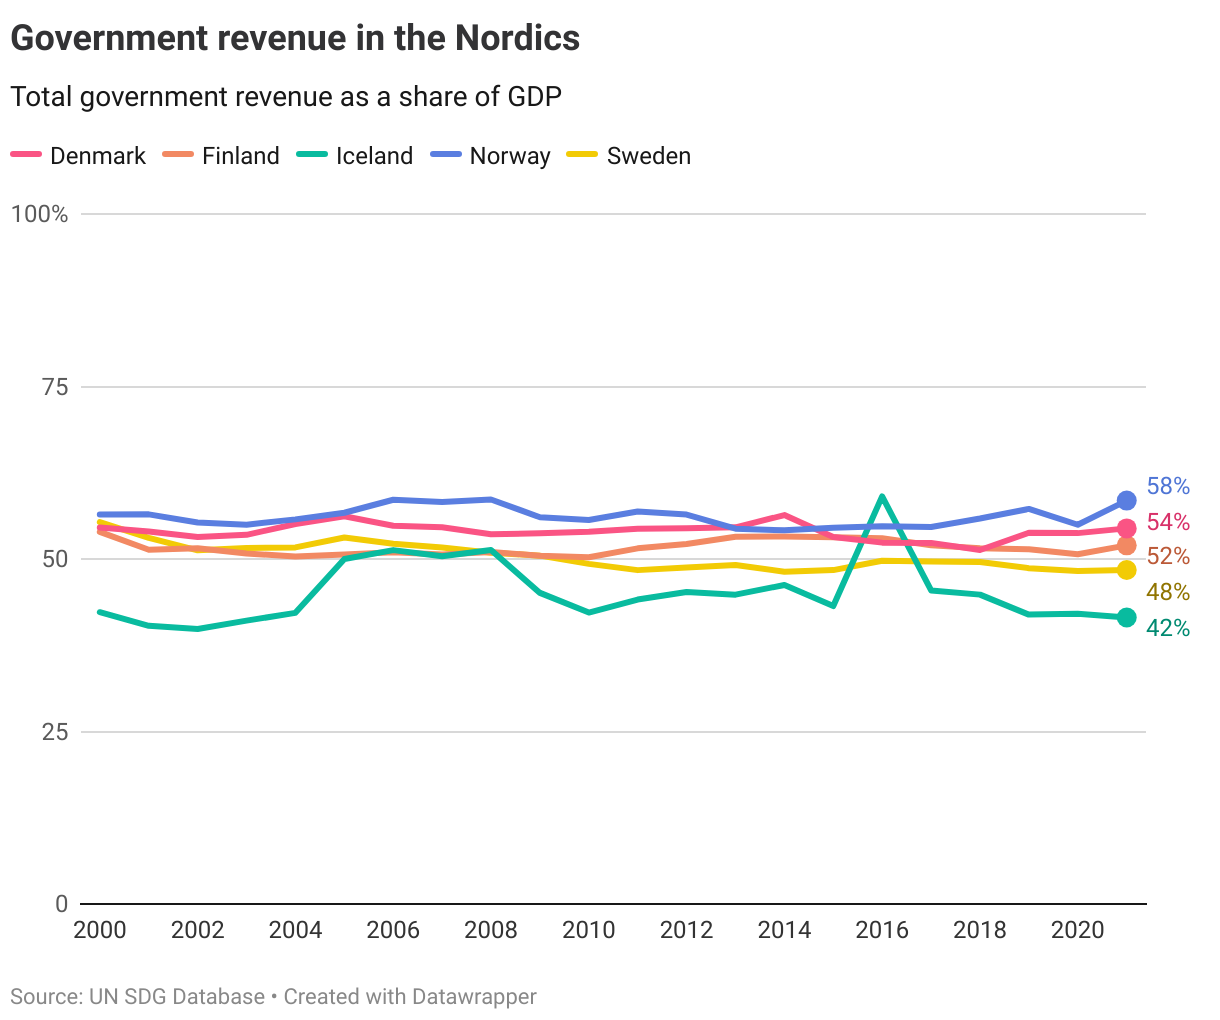
The Nordics
The Nordics are all at a significantly higher level of government revenue as share of GDP than the worldwide average. The same applies for the share of the domestic budget funded by domestic taxes, except for Finland which is closer to the worldwide average.
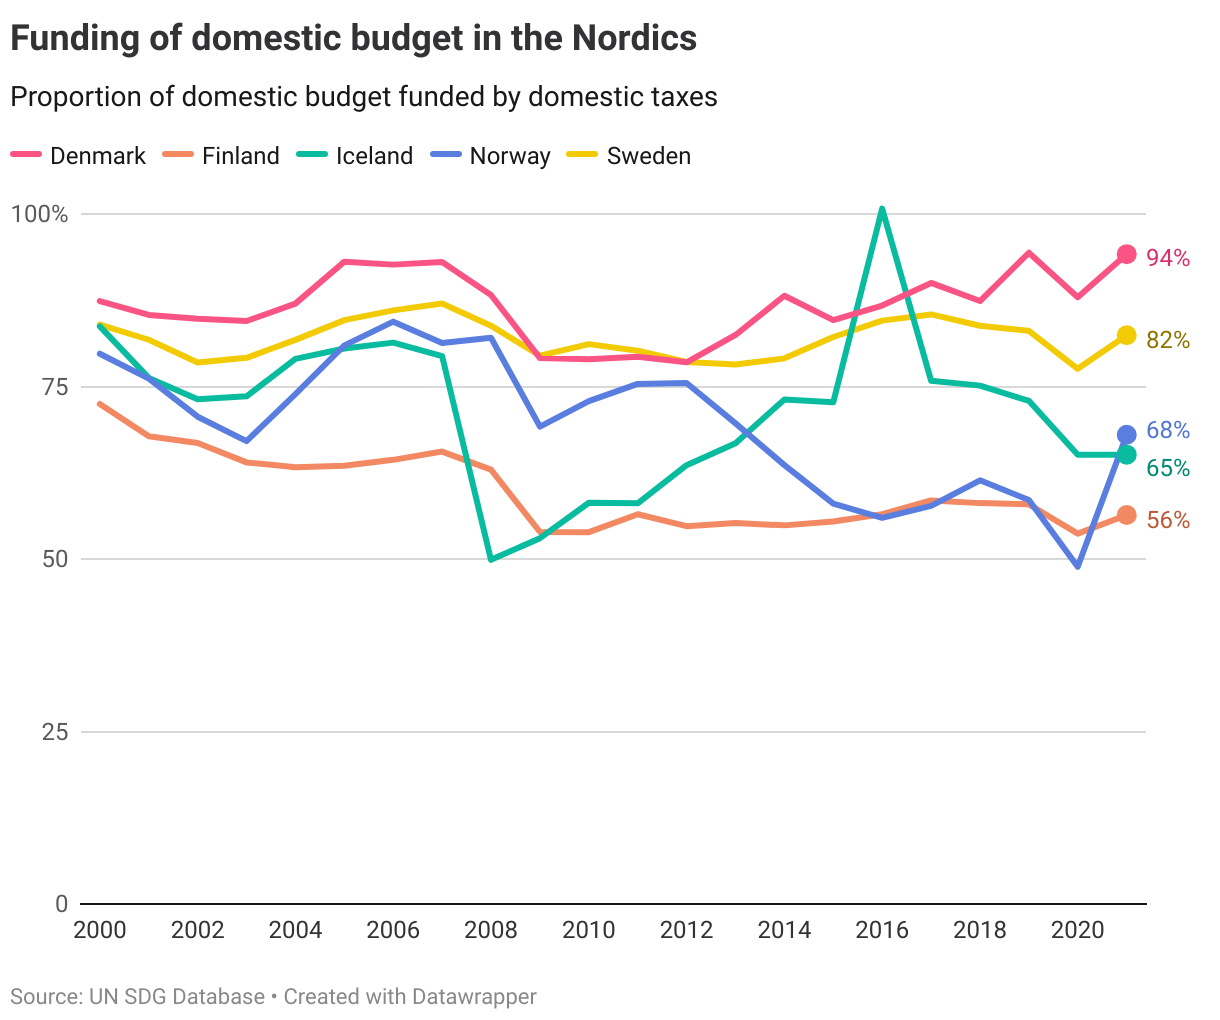
No assessment is given for this indicator as target values will depend on national circumstances and priorities.
Target 17.2
Developed countries to implement fully their official development assistance commitments, including the commitment by many developed countries to achieve the target of 0.7 per cent of ODA/GNI to developing countries and 0.15 to 0.20 per cent of ODA/GNI to least developed countries; ODA providers are encouraged to consider setting a target to provide at least 0.20 per cent of ODA/GNI to least developed countries
| 17.2.1 | Net official development assistance, total and to least developed countries, as a proportion of the Organization for Economic Cooperation and Development (OECD) Development Assistance Committee donors’ gross national income (GNI) |
Global trends
Despite progress over the past years, the world is still far off the internationally agreed target of Official Development Assistance (ODA). In 2022 it reached 0.36% of the gross domestic income (GNI) of developed countries, up from 0.30% in 2018.
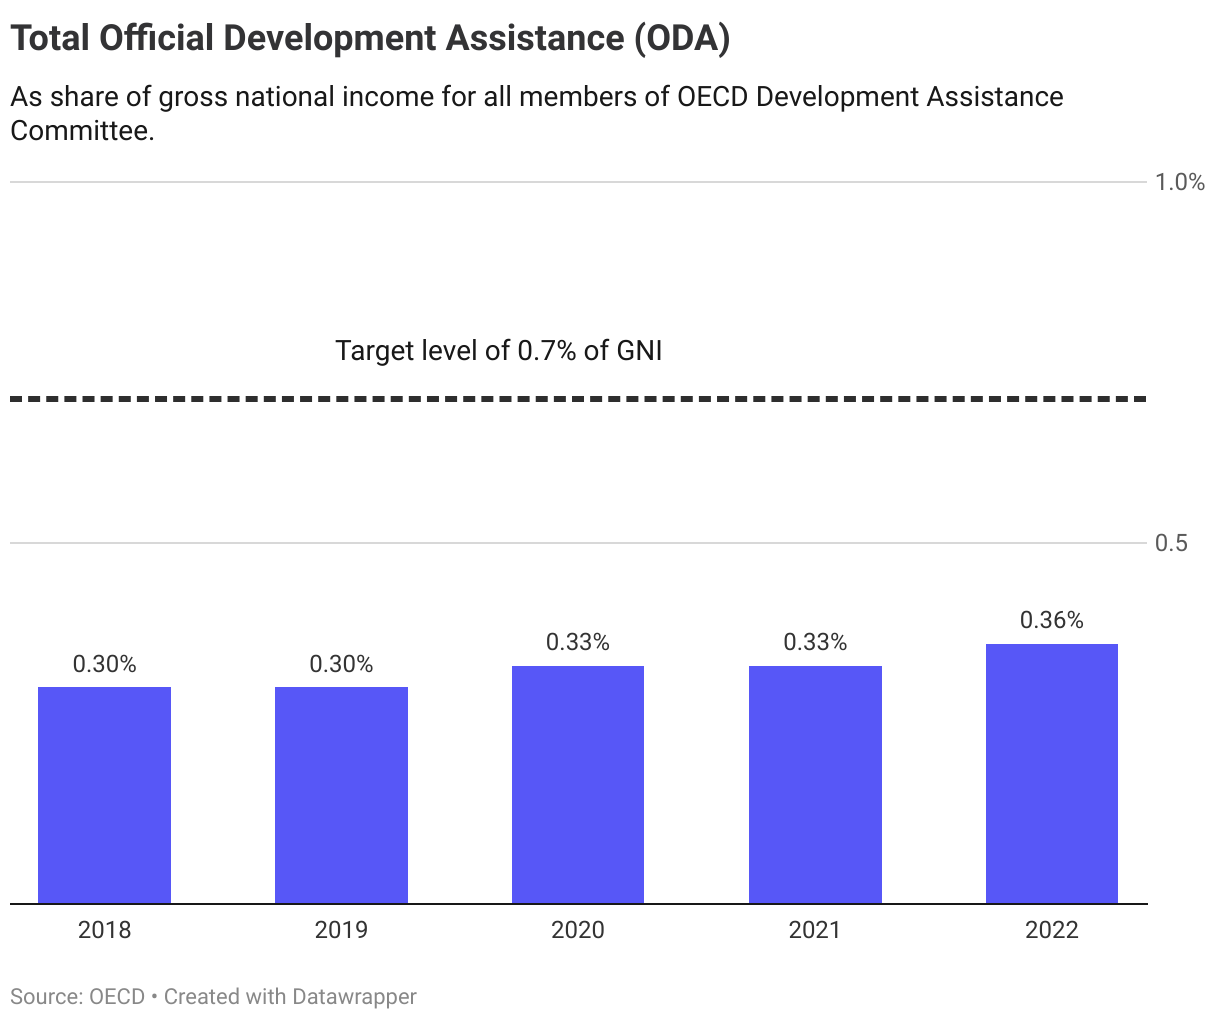
For least developed countries, total ODA amounted to 0.09% of developed countries’ GNI in 2021 (latest year with data), also far off the 0.20% level encouraged in the target text.
The Nordics
The latest data shows that Denmark, Norway and Sweden are above the 0.7% ODA target as of 2022. Both Finland and Iceland are making progress in recent years, while Denmark is trending away from the target (0.72% in 2018 to 0.70% in 2022).
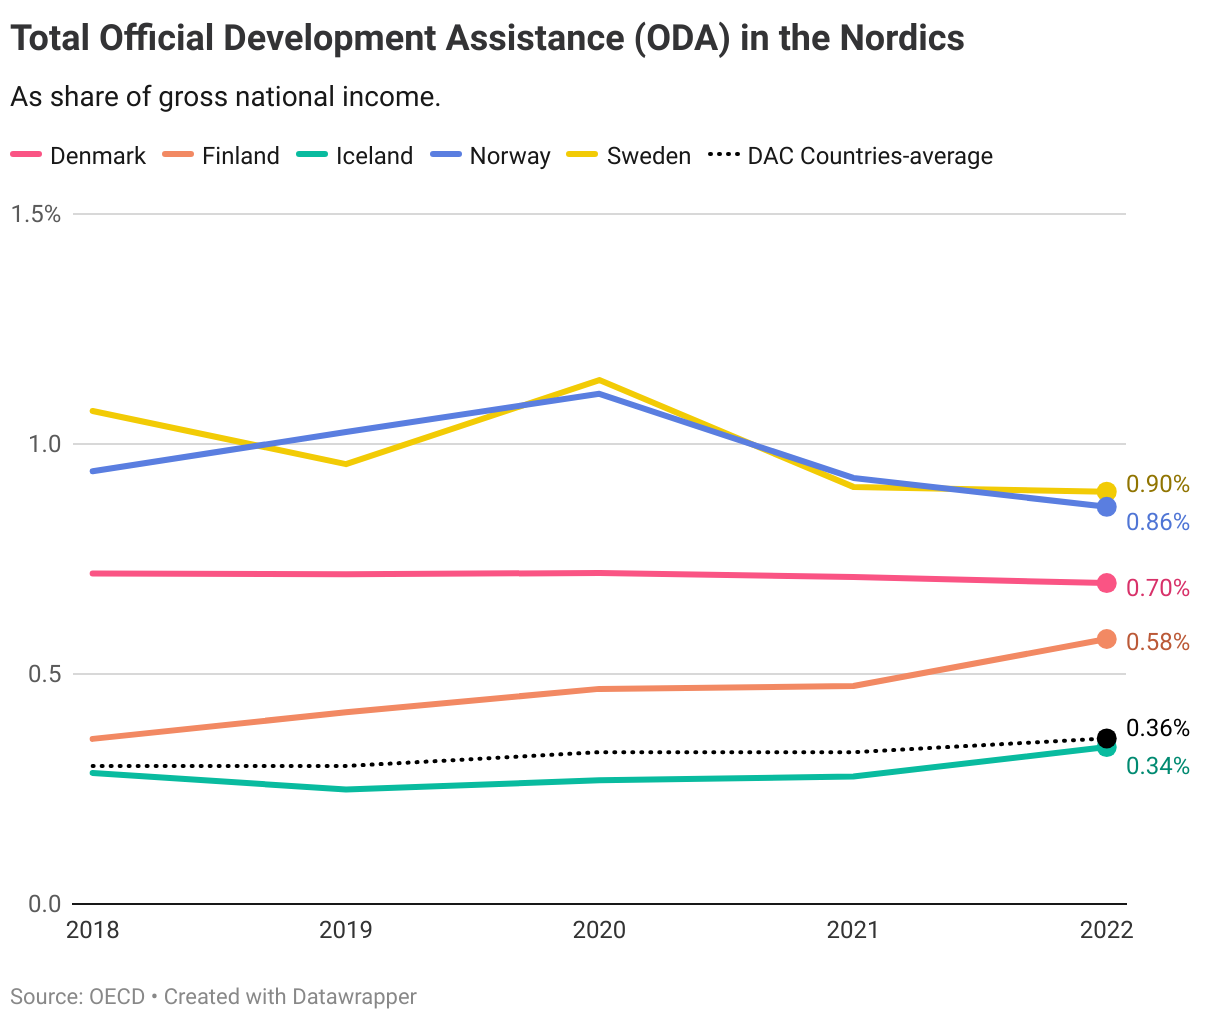
Data on ODA to LDCs also show that Denmark, Norway and Sweden are above the target of 0.2%.
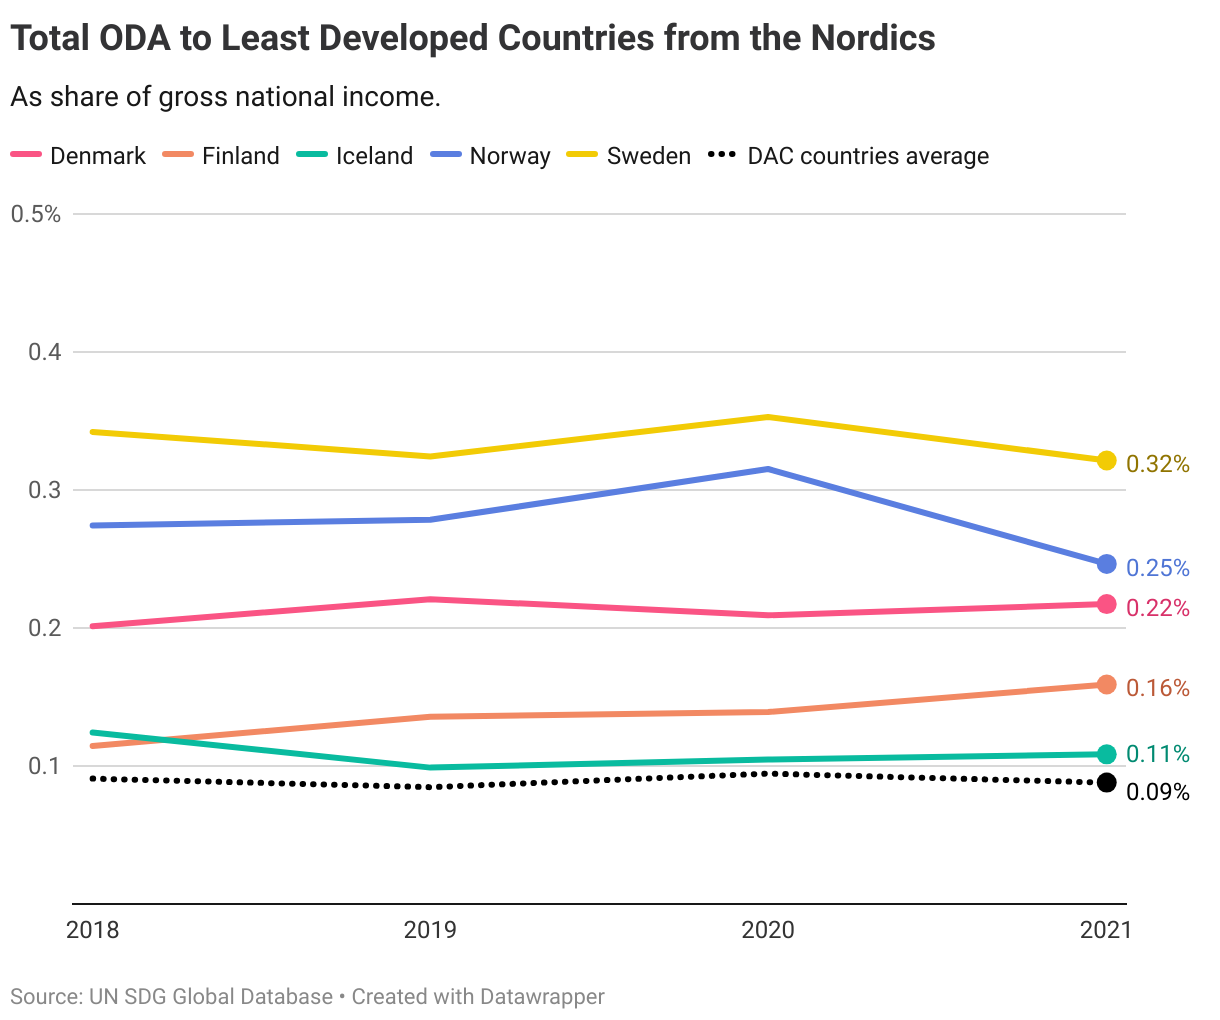
A combined assessment of both indicators shows that Norway and Sweden are the only countries that have met the target. While Denmark is at the target level for ODA, it is trending away from it and projections shows a low likelihood of staying above it in 2030 if past trends continue.
Denmark
Short distance to target
Finland
Short distance to target
Iceland
Long distance to target but progressing
Norway
Target is met
Sweden
Target is met
Target 17.3
Mobilize additional financial resources for developing countries from multiple sources
| 17.3.1 | Additional financial resources mobilized for developing countries from multiple sources |
| 17.3.2 | Volume of remittances (in United States dollars) as a proportion of total GDP |
Global trends
17.3.1. Financial resources
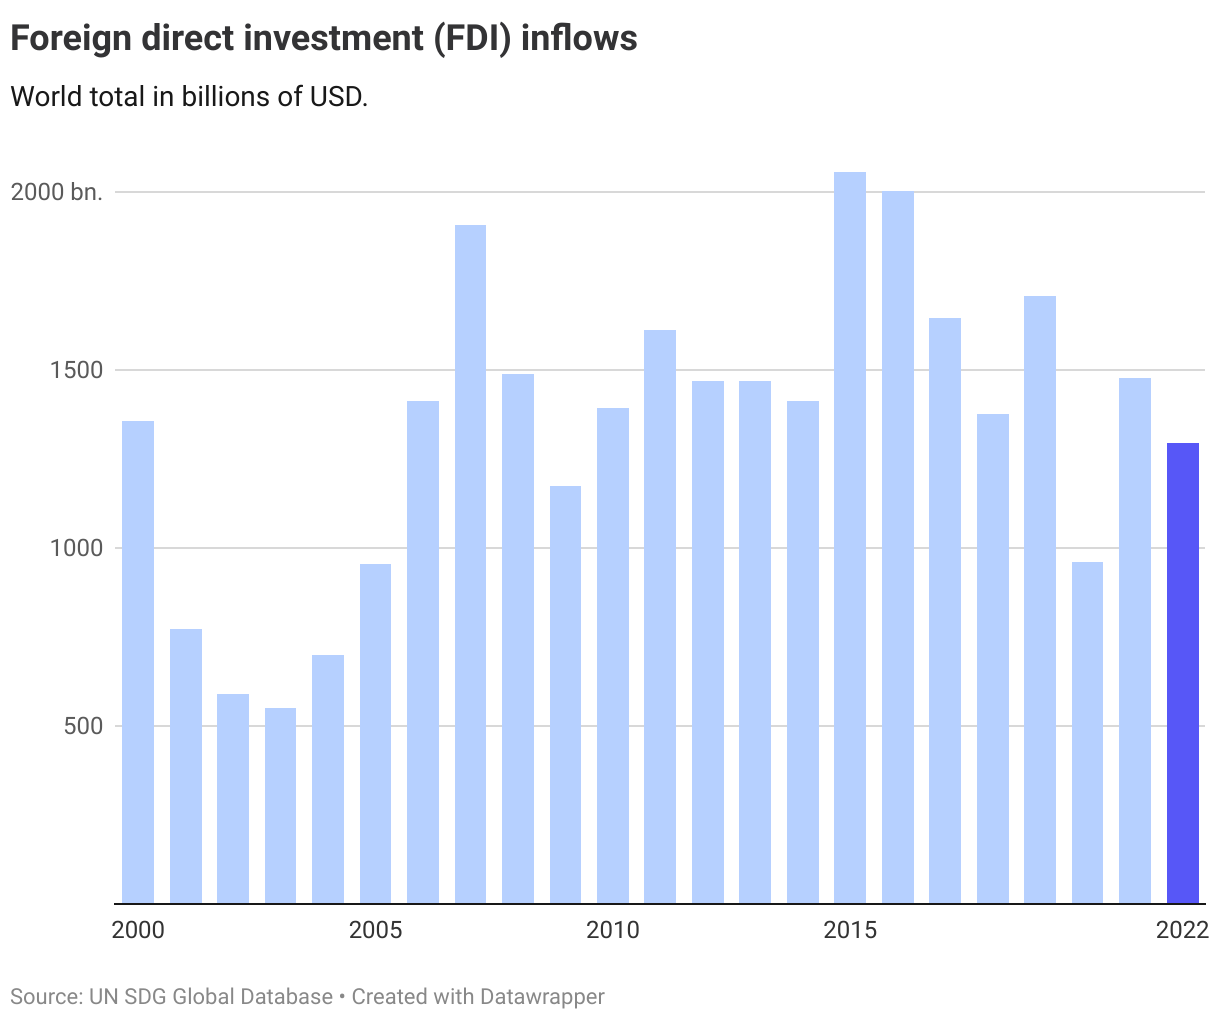
This indicator is measured in terms of the volume of global foreign direct investment (FDI). In 2022, global FDI fell to one of its lowest level in recent years, standing at around 1,3 trillion. Although higher than in 2020, it is siginificantly below pre-pandemic levels.
17.3.2. Volume of remittances
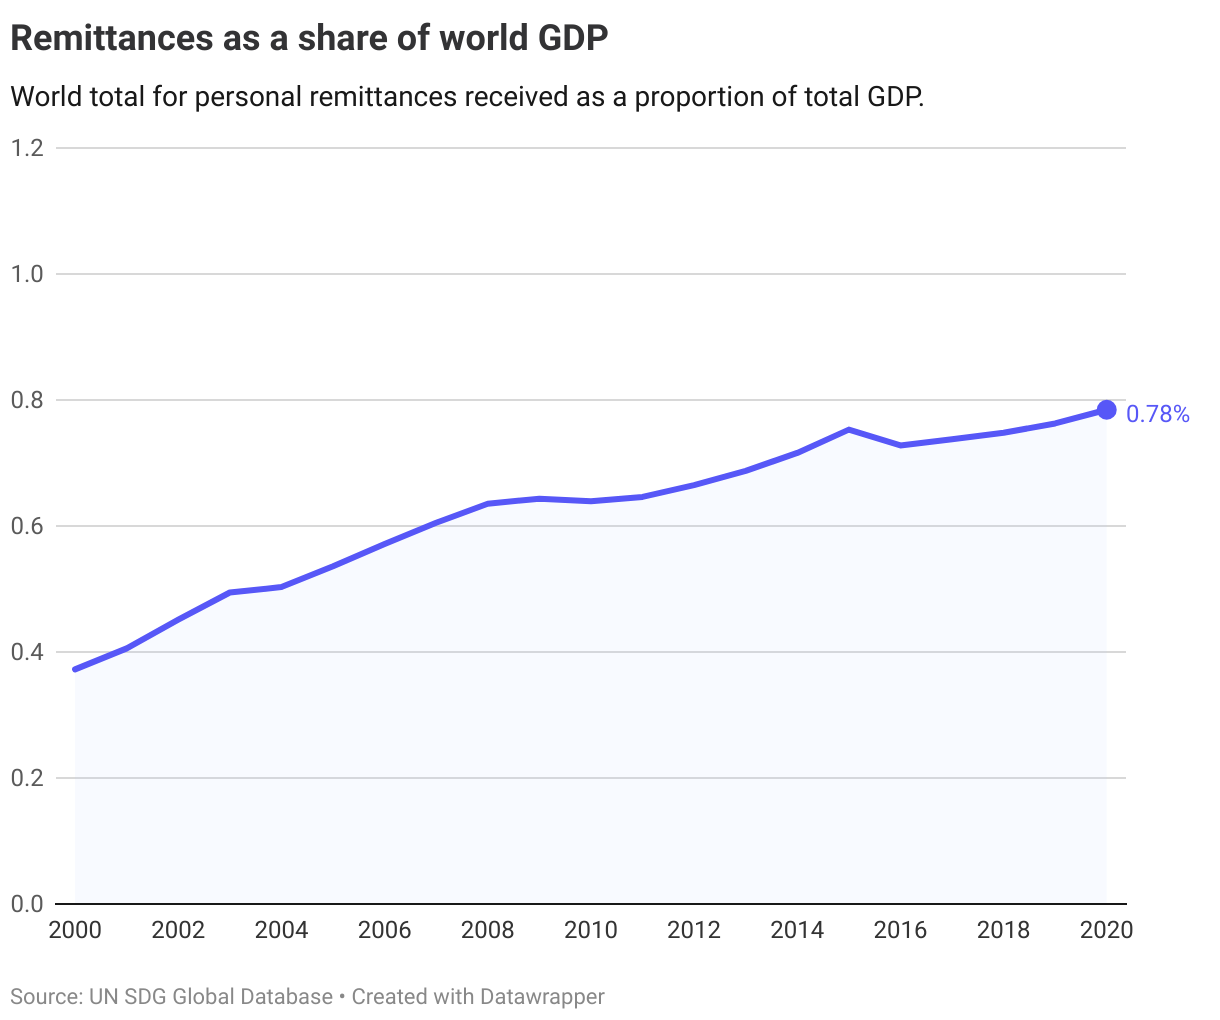
The volume of remittances as a share of GDP kept growing during the pandemic, and reached a global high of almost 0.8% of world GDP in 2020. In Central and Southern Asia, remittances account for over 4% of GDP (regional aggregate).
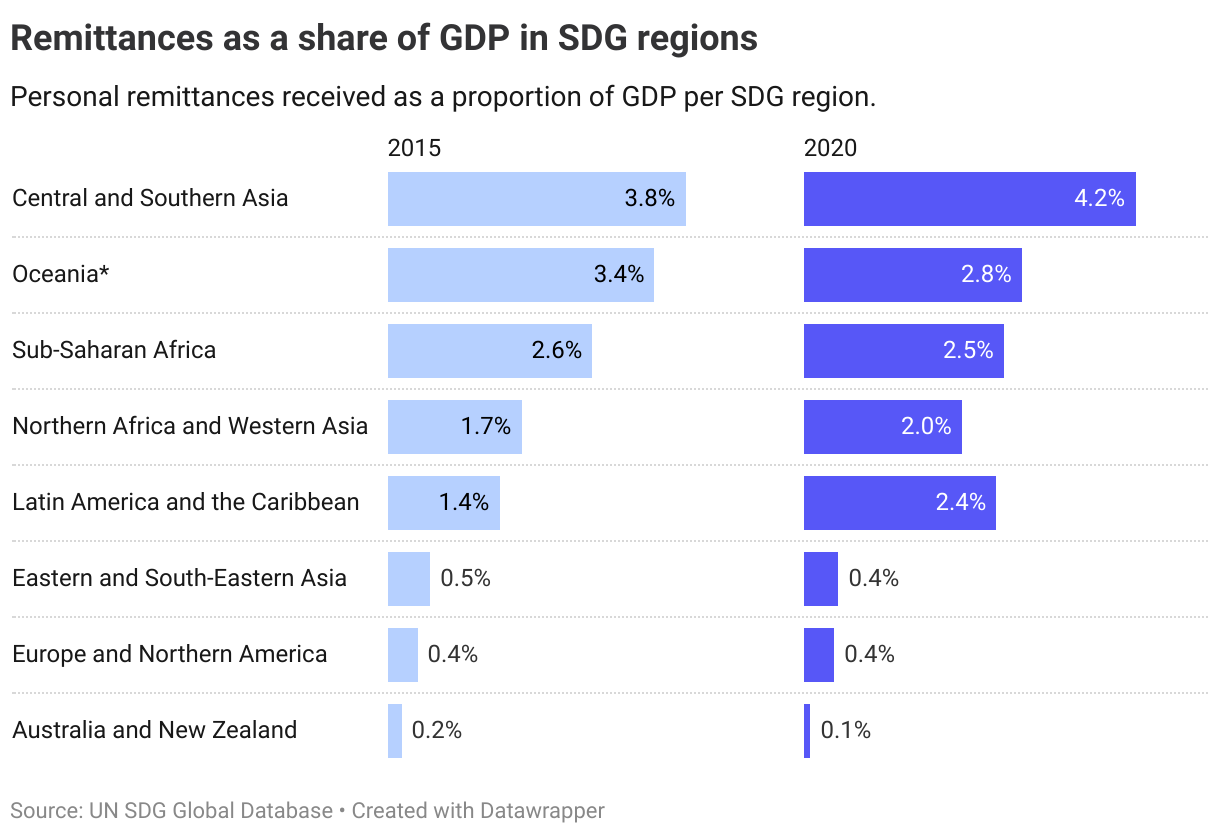
The Nordics
Target not applicable to the Nordic countries.
Target 17.4
Assist developing countries in attaining long-term debt sustainability through coordinated policies aimed at fostering debt financing, debt relief and debt restructuring, as appropriate, and address the external debt of highly indebted poor countries to reduce debt distress
| 17.4.1 | Debt service as a proportion of exports of goods and services |
Global trends
The debt-to-export ratio has increased in four of five SDG regions (for which data is available) between 2015 to 2020, indicating an increased debt burden as measured in terms of a country’s exports.
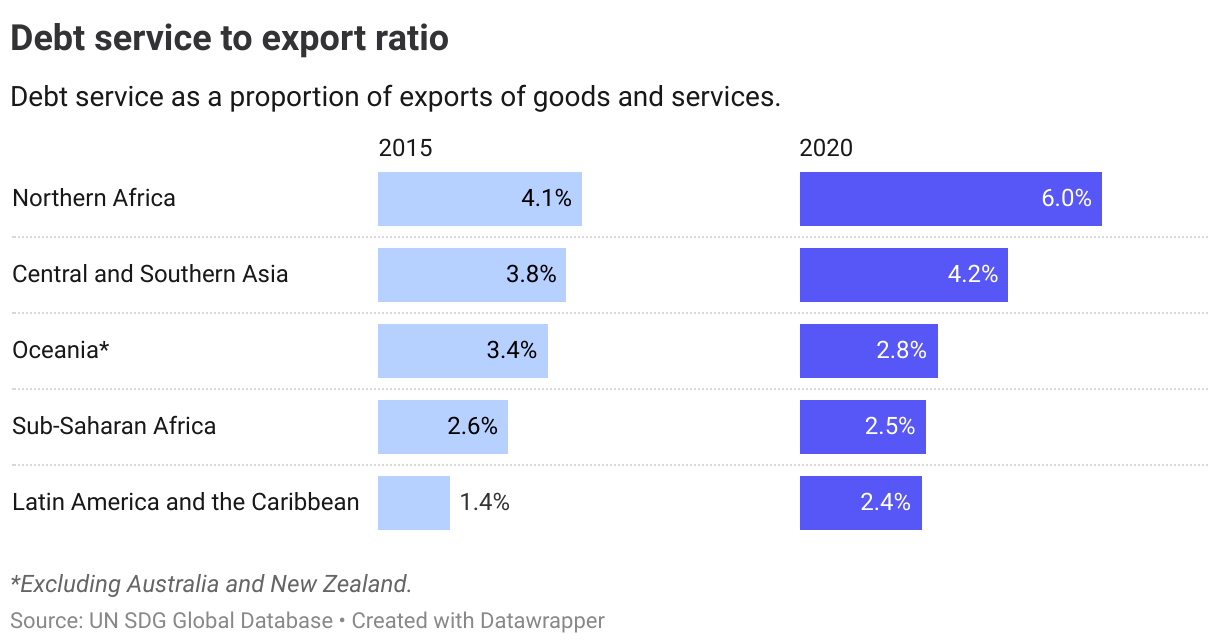
The Nordics
Target not applicable to the Nordic countries.
Target 17.5
Adopt and implement investment promotion regimes for least developed countries
| 17.5.1 | Number of countries that adopt and implement investment promotion regimes for developing countries, including the least developed countries |
Global trends
A vast number of countries worldwide have in place bilateral investment treaties (BITs) with developing countries. However, the number of countries with BITs signed and in force with least developed countries was significantly lower, with the numbers remaining unchanged since 2015.
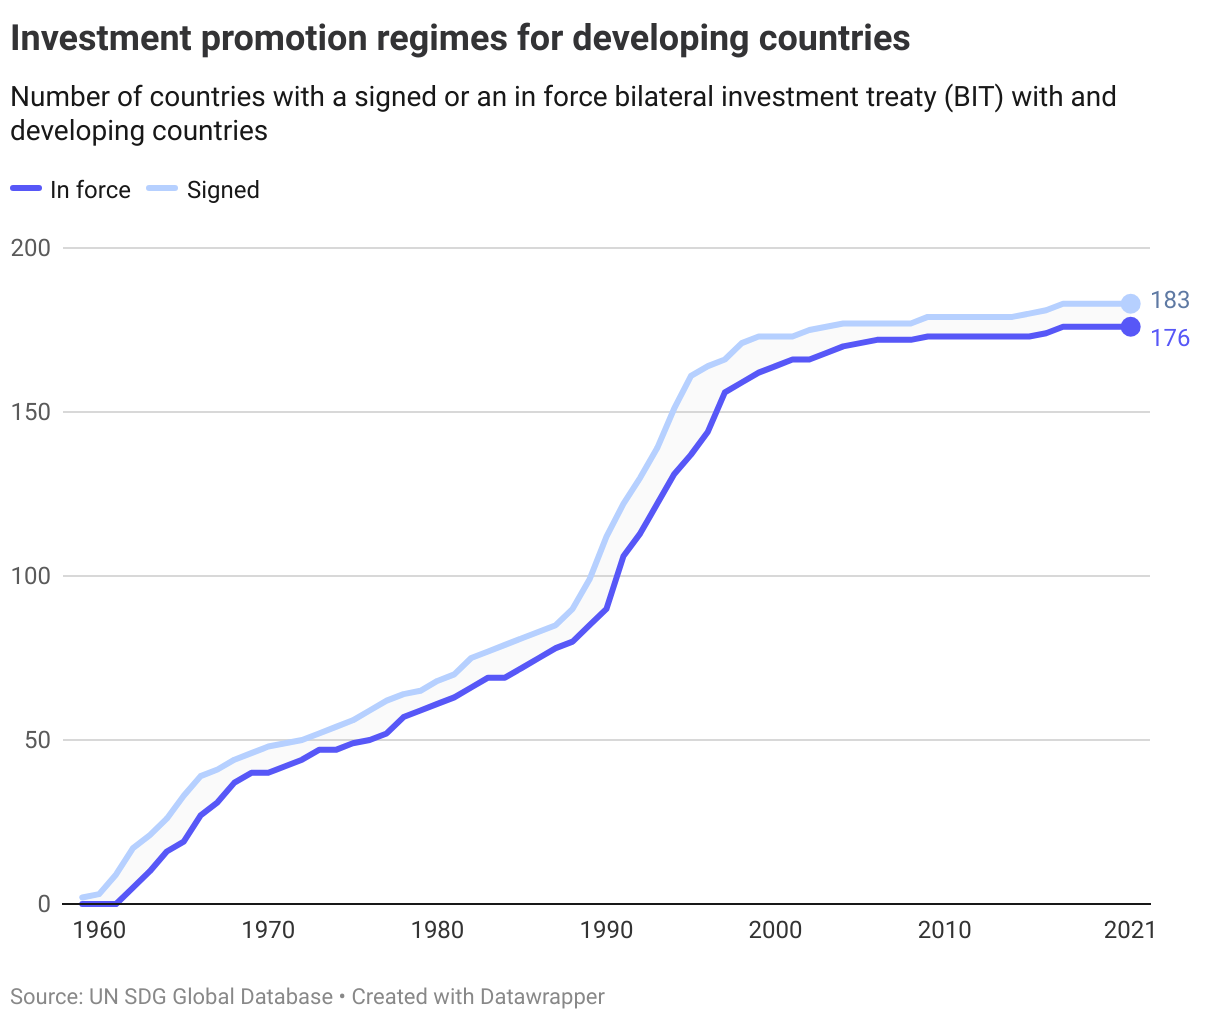
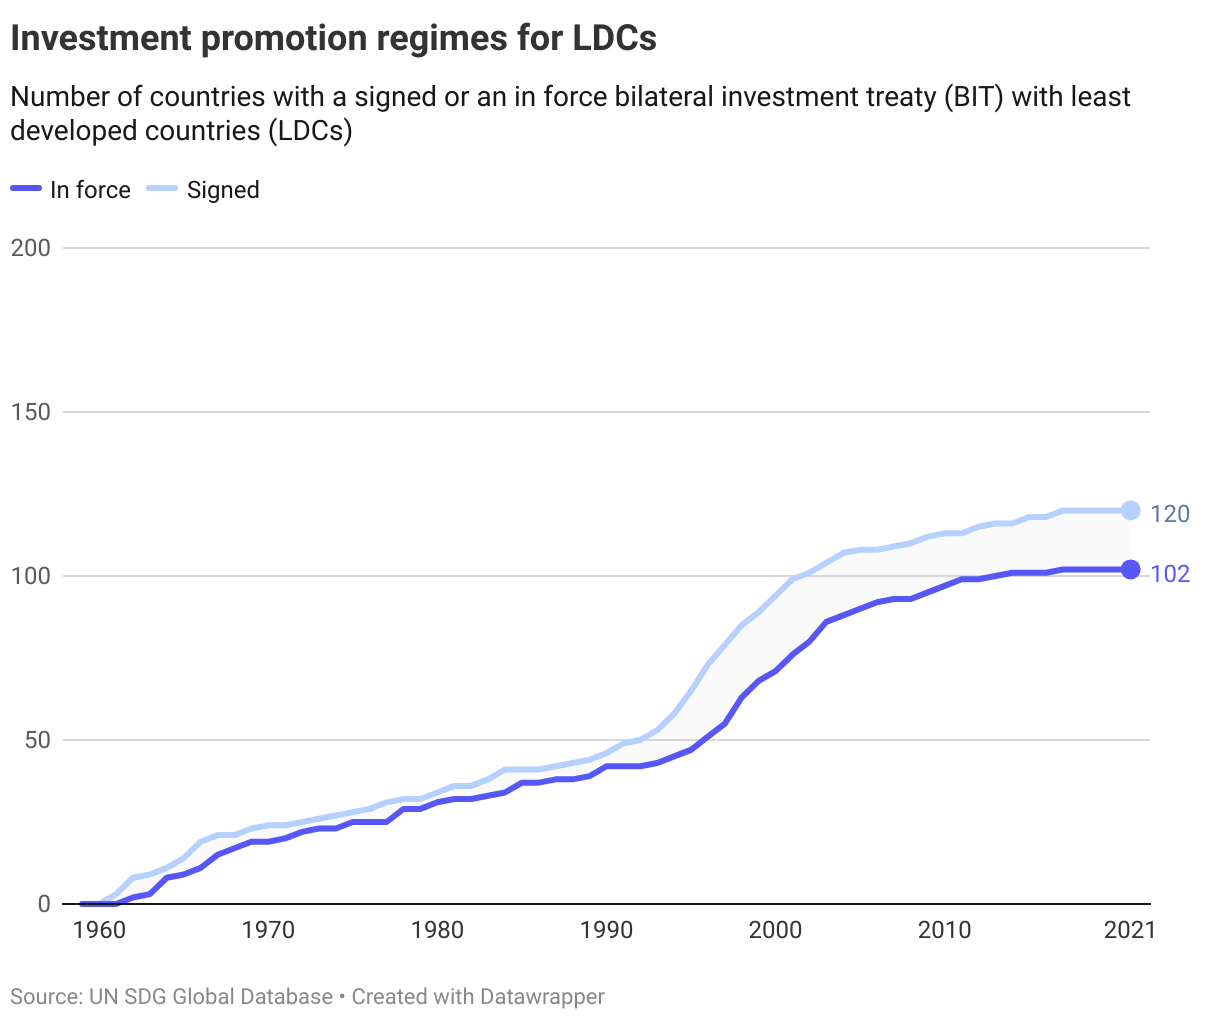
The Nordics
All the Nordic countries have in place bilateral investment treaties with both developing countries and least developed countries.
Denmark
Target is met
Finland
Target is met
Iceland
Target is met
Norway
Target is met
Sweden
Target is met
Target 17.6
Enhance North-South, South-South and triangular regional and international cooperation on and access to science, technology and innovation and enhance knowledge sharing on mutually agreed terms, including through improved coordination among existing mechanisms, in particular at the United Nations level, and through a global technology facilitation mechanism
| 17.6.1 | Fixed Internet broadband subscriptions per 100 inhabitants, by speed |
No data available is from the UN SDG Global Database at the global or regional level. No country-level data is assessed as due to the increasing role of mobile connectivity, the current indicator focusing on fixed broadband only gives a partial picture of global internet access.
Target 17.7
Promote the development, transfer, dissemination and diffusion of environmentally sound technologies to developing countries on favourable terms, including on concessional and preferential terms, as mutually agreed
| 17.7.1 | Total amount of funding for developing countries to promote the development, transfer, dissemination and diffusion of environmentally sound technologies |
Global trends
This indicator is measured through trade in environmentally sound technologies. In monetary terms, trade in environmentally sound technologies (sum of exports and imports) was 6.4% higher in 2020 than in 2015, and stood at above USD 2,300 billion in 2020. In terms of technology type, the largest trading flows between 2015-2020 were environmental monitoring, followed by wastewater management and renewable energy. The latter was also the technology type with the strongest increase during the five-year period.
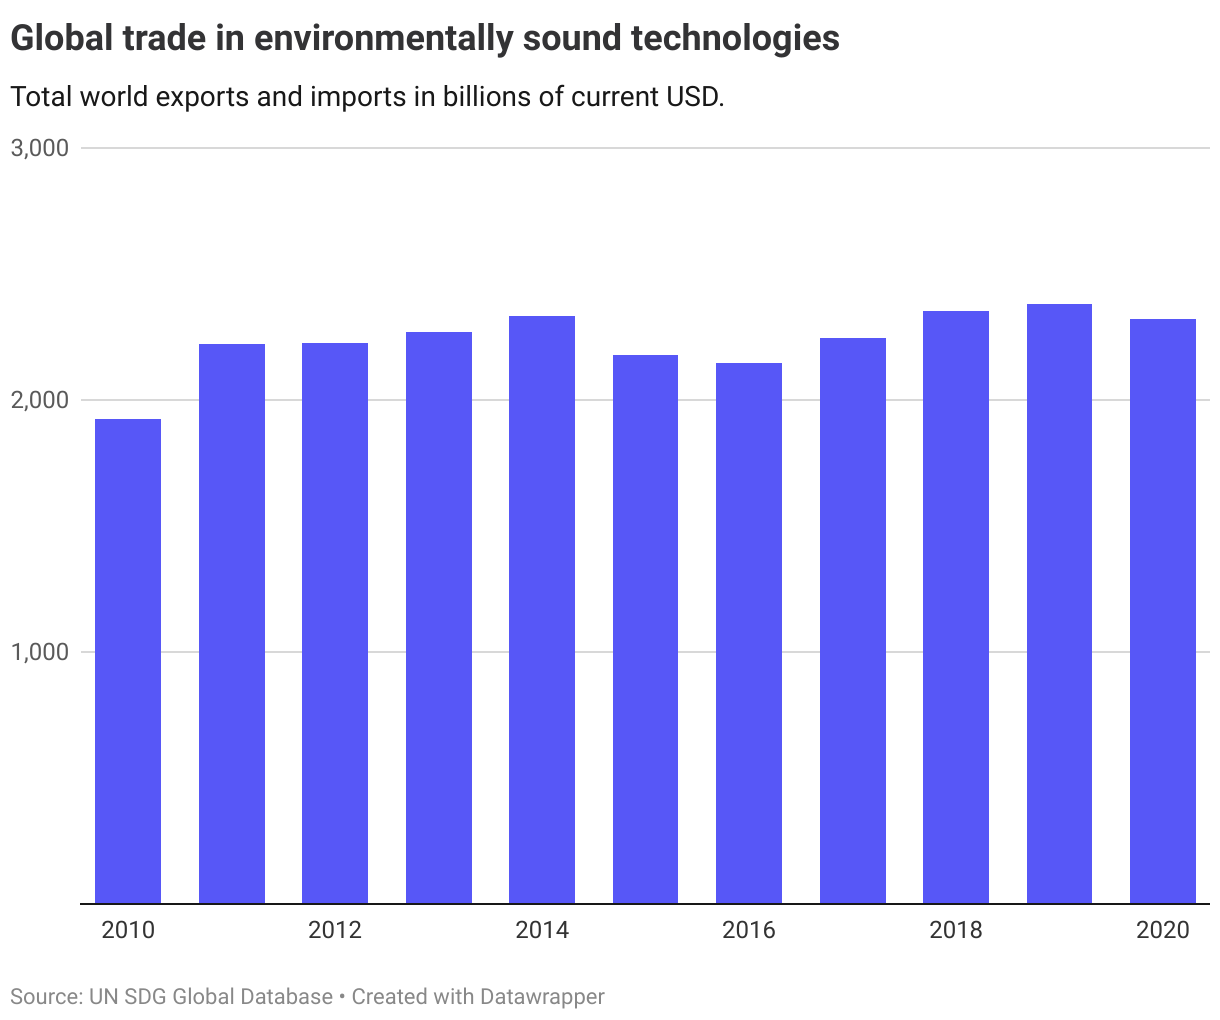
The Nordics
Trade in absolute monetary amounts is not suitable for cross-country comparisons.
Target 17.8
Fully operationalize the technology bank and science, technology and innovation capacity-building mechanism for least developed countries by 2017 and enhance the use of enabling technology, in particular information and communications technology
| 17.8.1 | Proportion of individuals using the Internet |
Global trends
Global connectivity to the internet has risen rapidly over the past two decades, with two-thirds worldwide using the internet in 2022.
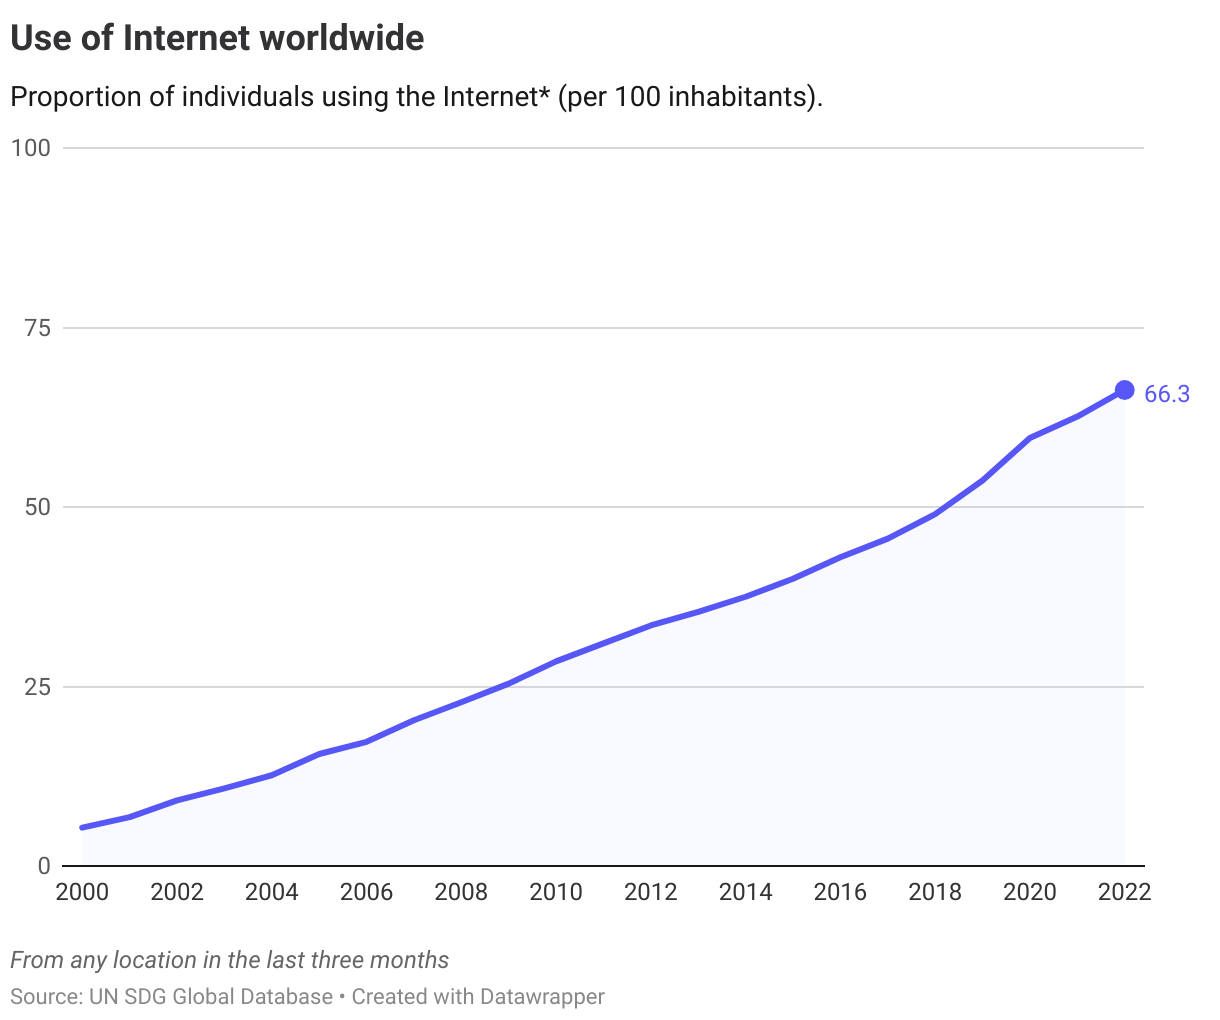
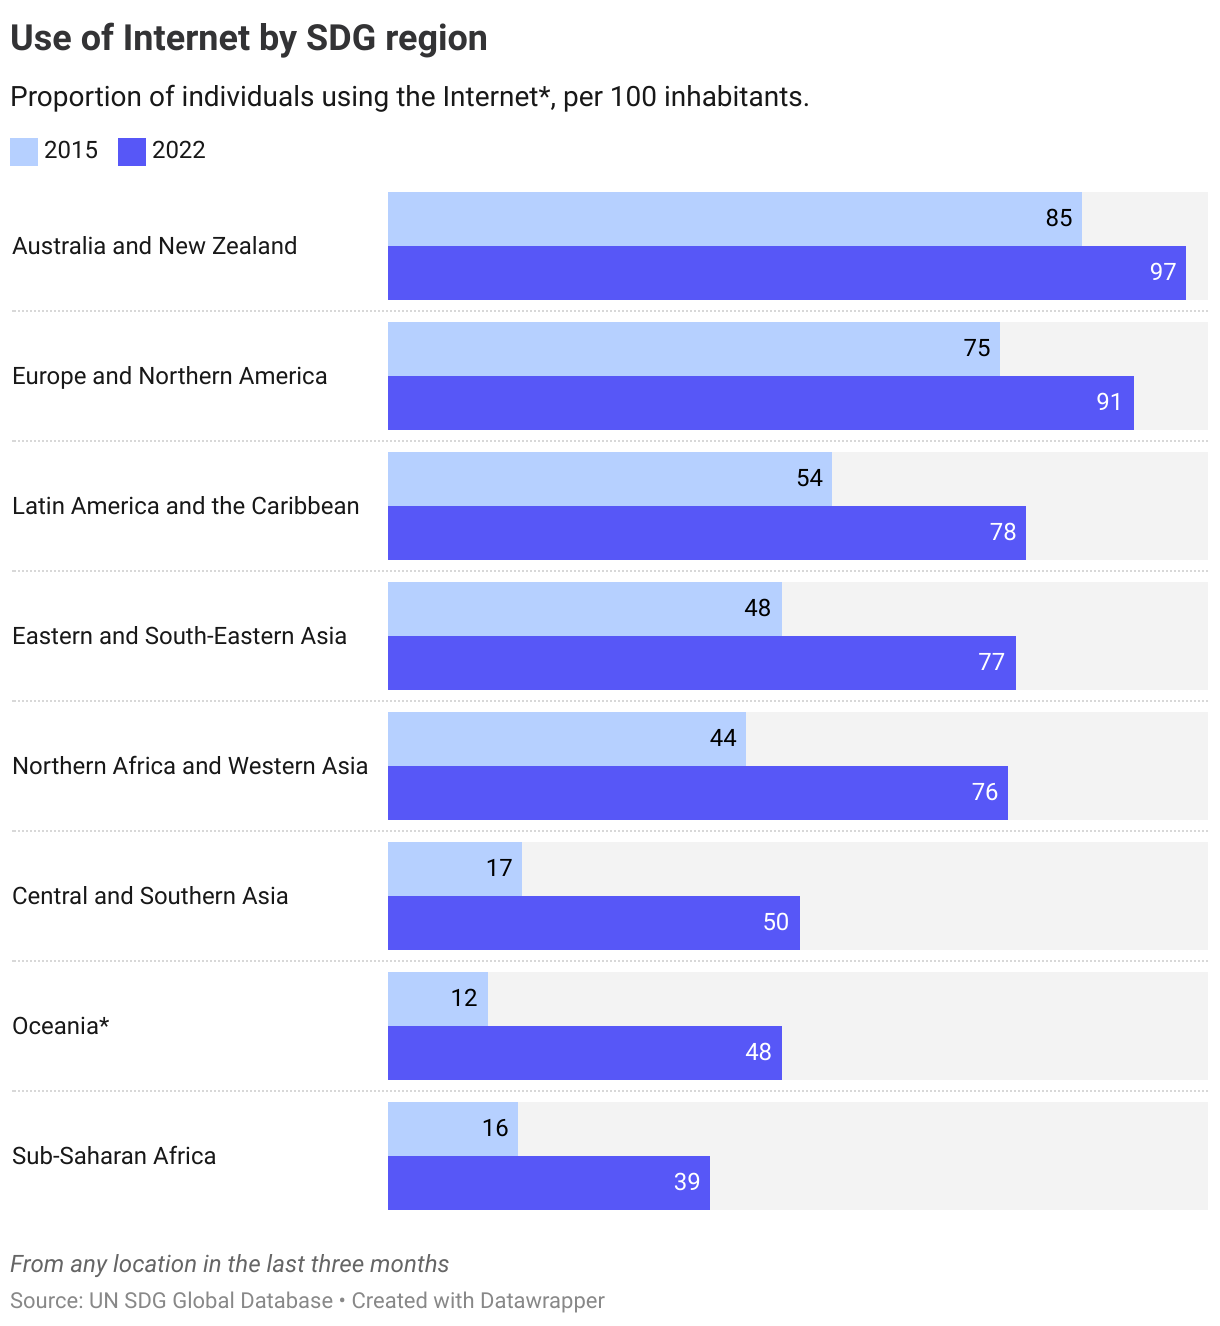
Internet usage has increased in all regions, with Central and Southern Asia and Sub-Saharan Africa seeing the most rapid expansion of usage since 2015. Still, in both these regions, as well as in Oceania (excluding Australia and New Zealand) the majority of the population is not using the internet.
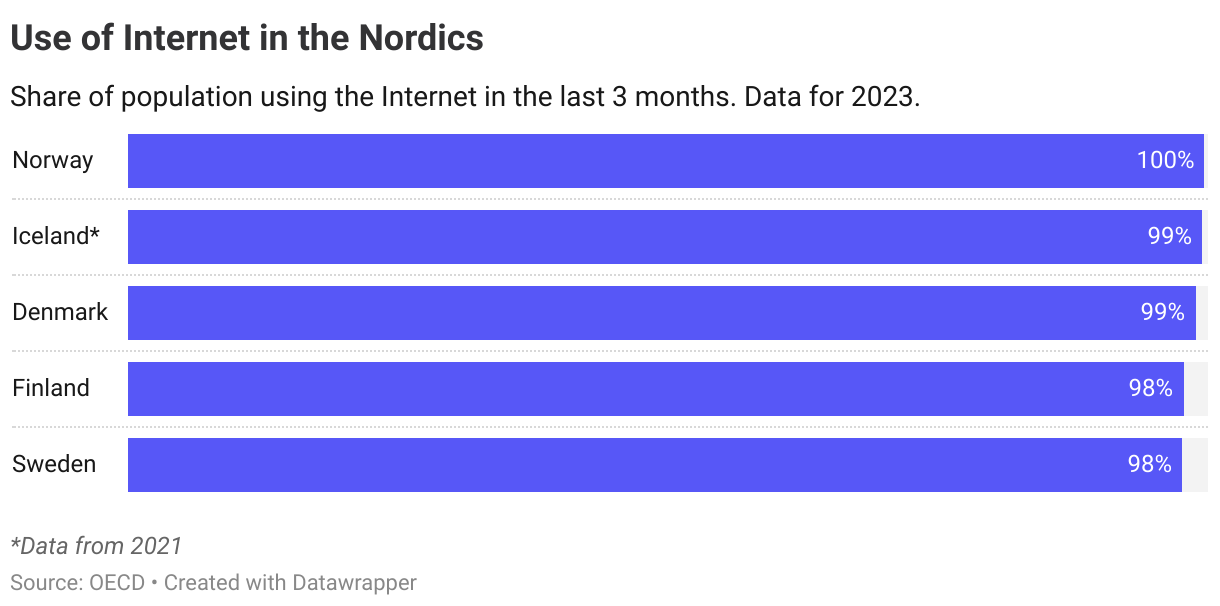
The Nordics
Internet usage in the Nordic countries is near universal according to the latest OECD data from 2023, thus the all the Nordics have already achieved this target.
Denmark
Target is met
Finland
Target is met
Iceland
Target is met
Norway
Target is met
Sweden
Target is met
Target 17.9
Enhance international support for implementing effective and targeted capacity-building in developing countries to support national plans to implement all the Sustainable Development Goals, including through North-South, South-South and triangular cooperation
| 17.9.1 | Dollar value of financial and technical assistance (including through North-South, South‑South and triangular cooperation) committed to developing countries |
Global trends
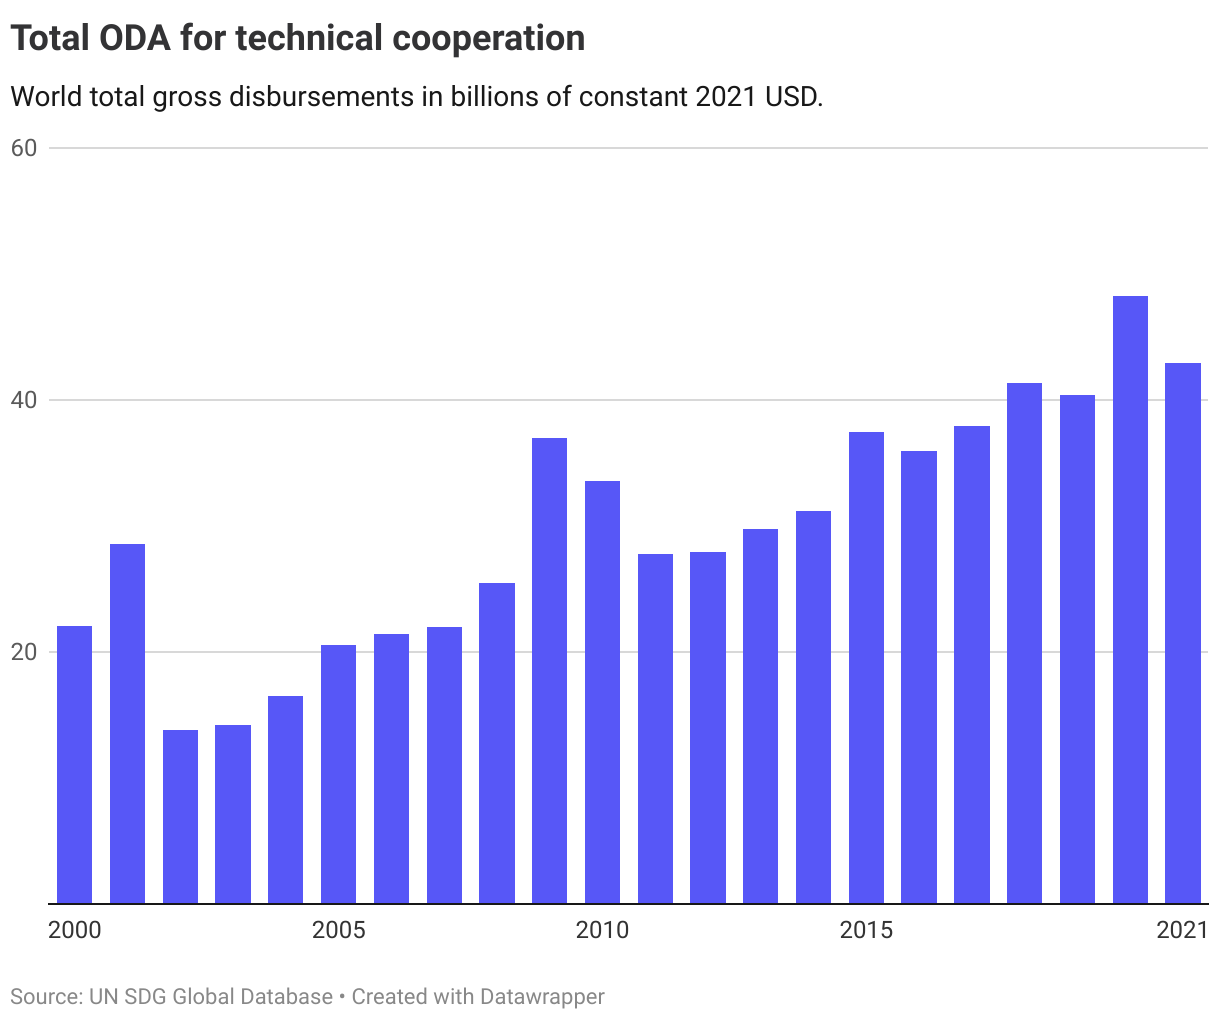
In 2021 total Official Development Assistance (ODA) allocated for capacity building and national planning reached USD 43 billion, alsmost twice as much compared to 2000.
The Nordics
ODA by sector in absolute amounts is not suitable for cross-country comparisons.
Target 17.10
Promote a universal, rules-based, open, non-discriminatory and equitable multilateral trading system under the World Trade Organization, including through the conclusion of negotiations under its Doha Development Agenda
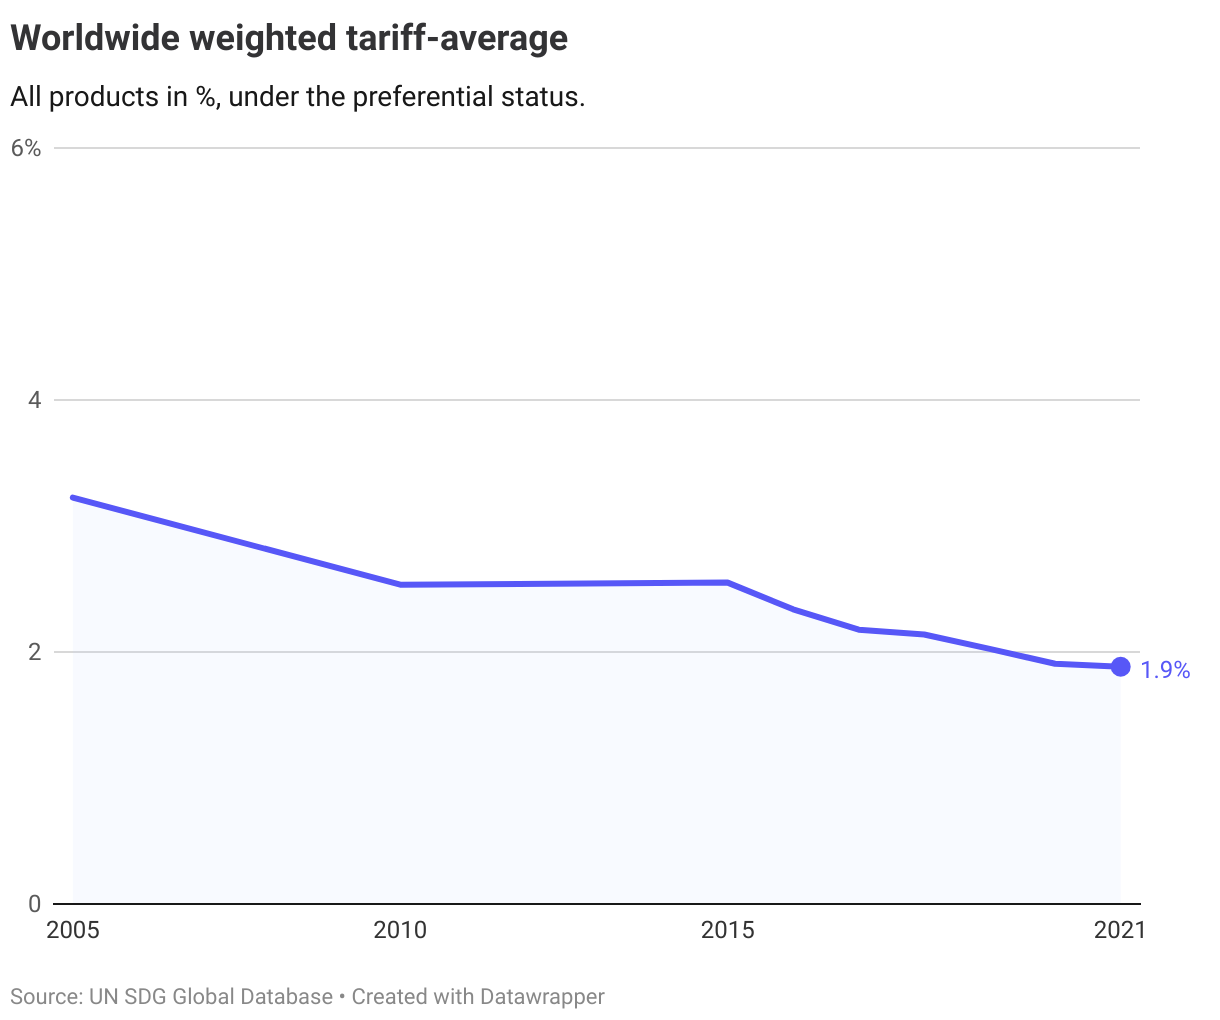
| 17.10.1 | Worldwide weighted tariff-average |
Global trends
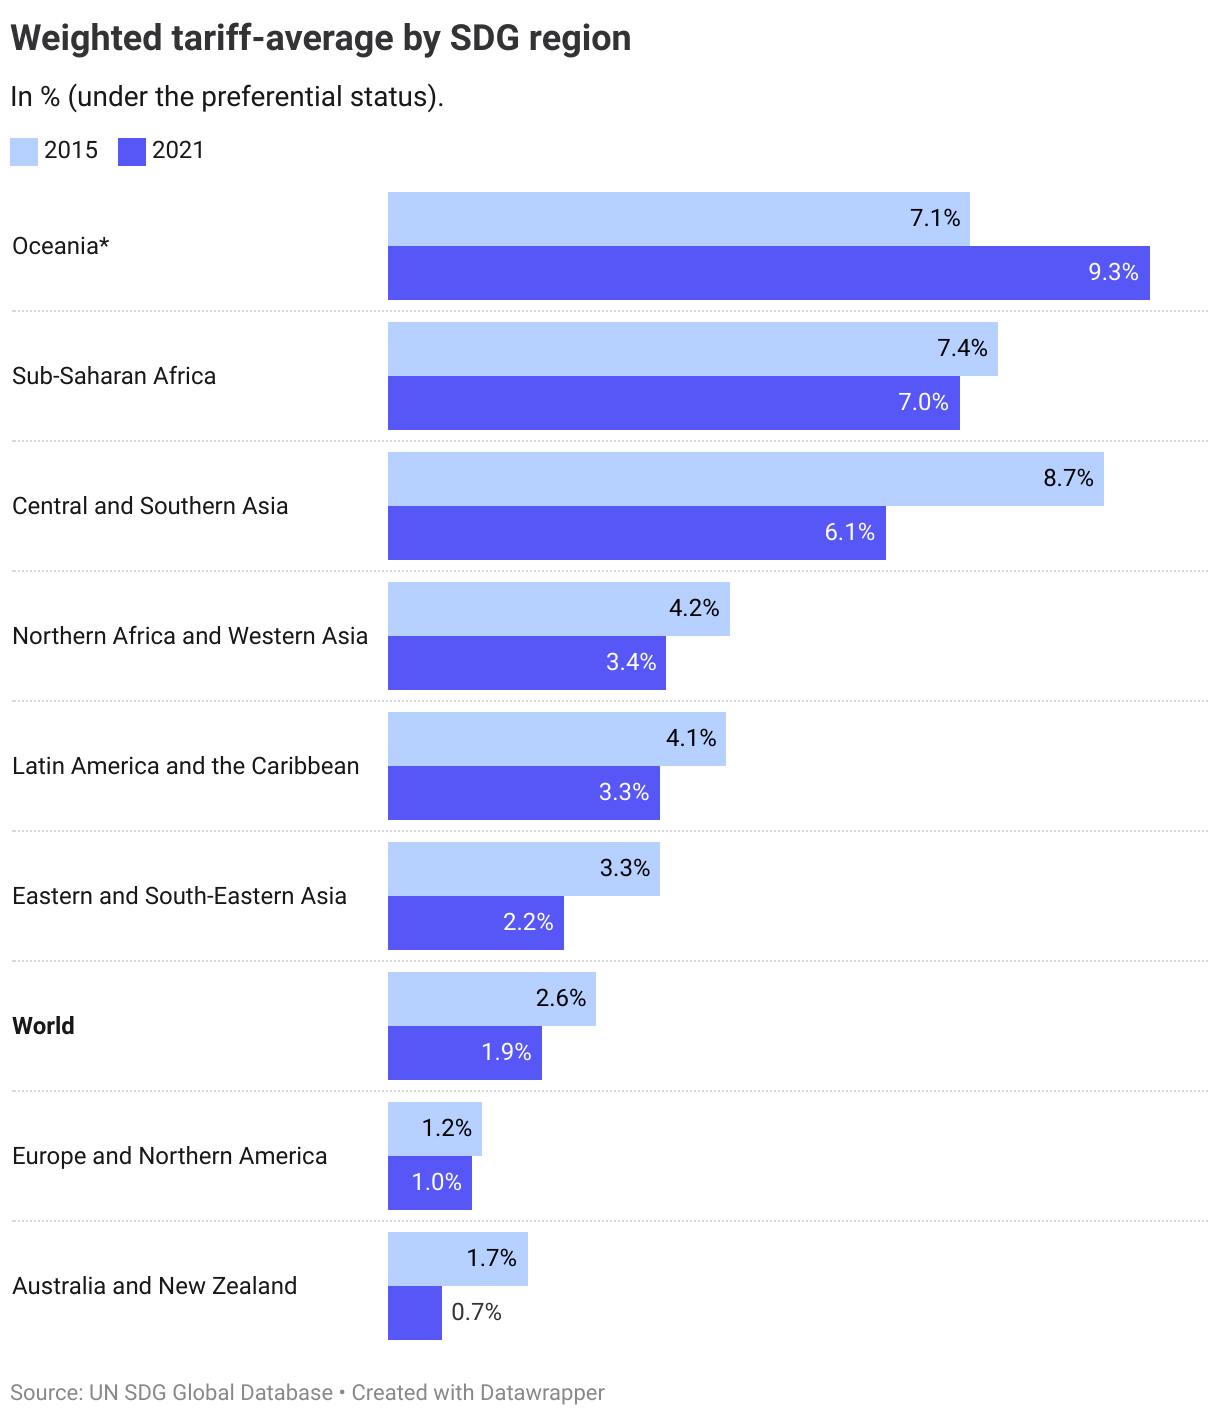
Worldwide weighted tariff rates have declined from around 2.6% in 2015 to 1.9% in 2021, thus indicating a trend towards lower tariffs worldwide. Note that no specific target level is set in the SDG framework for this indicator.
Most SDG regions have seen declining tariff rates since 2015, apart from Oceania (excluding Australia and New Zealand).
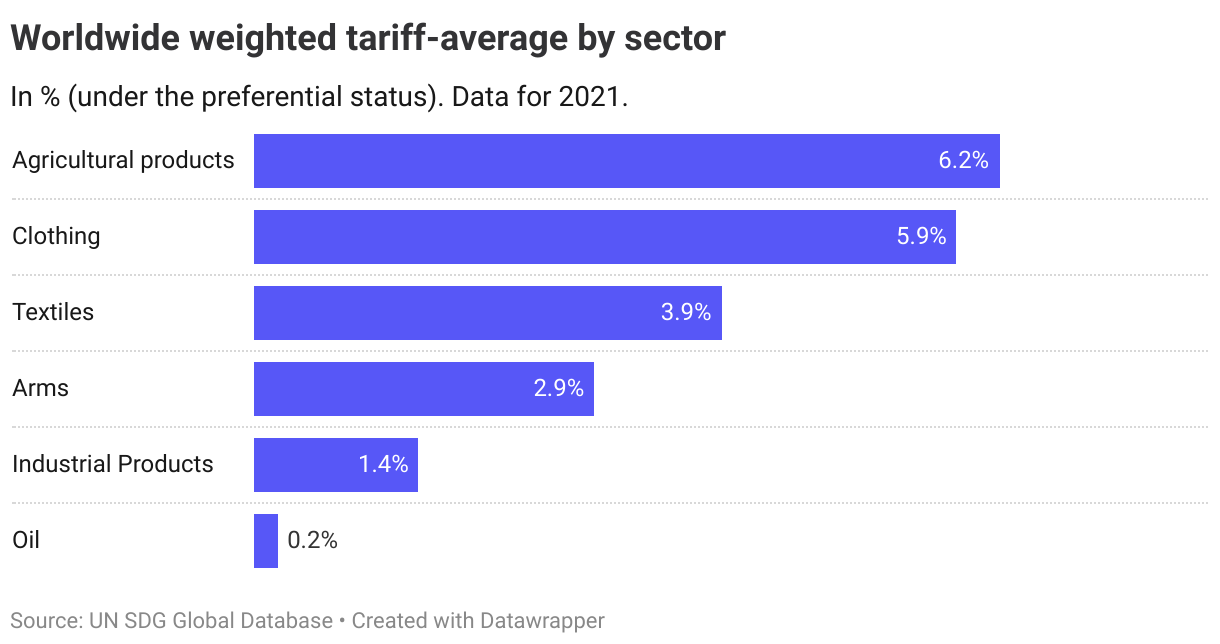
Agricultural products, clothing and textiles are the products facing the highest tariff rates.
The Nordics
Not applicable at country level.
Target 17.11
Significantly increase the exports of developing countries, in particular with a view to doubling the least developed countries’ share of global exports by 2020
| 17.11.1 | Developing countries’ and least developed countries’ share of global exports |
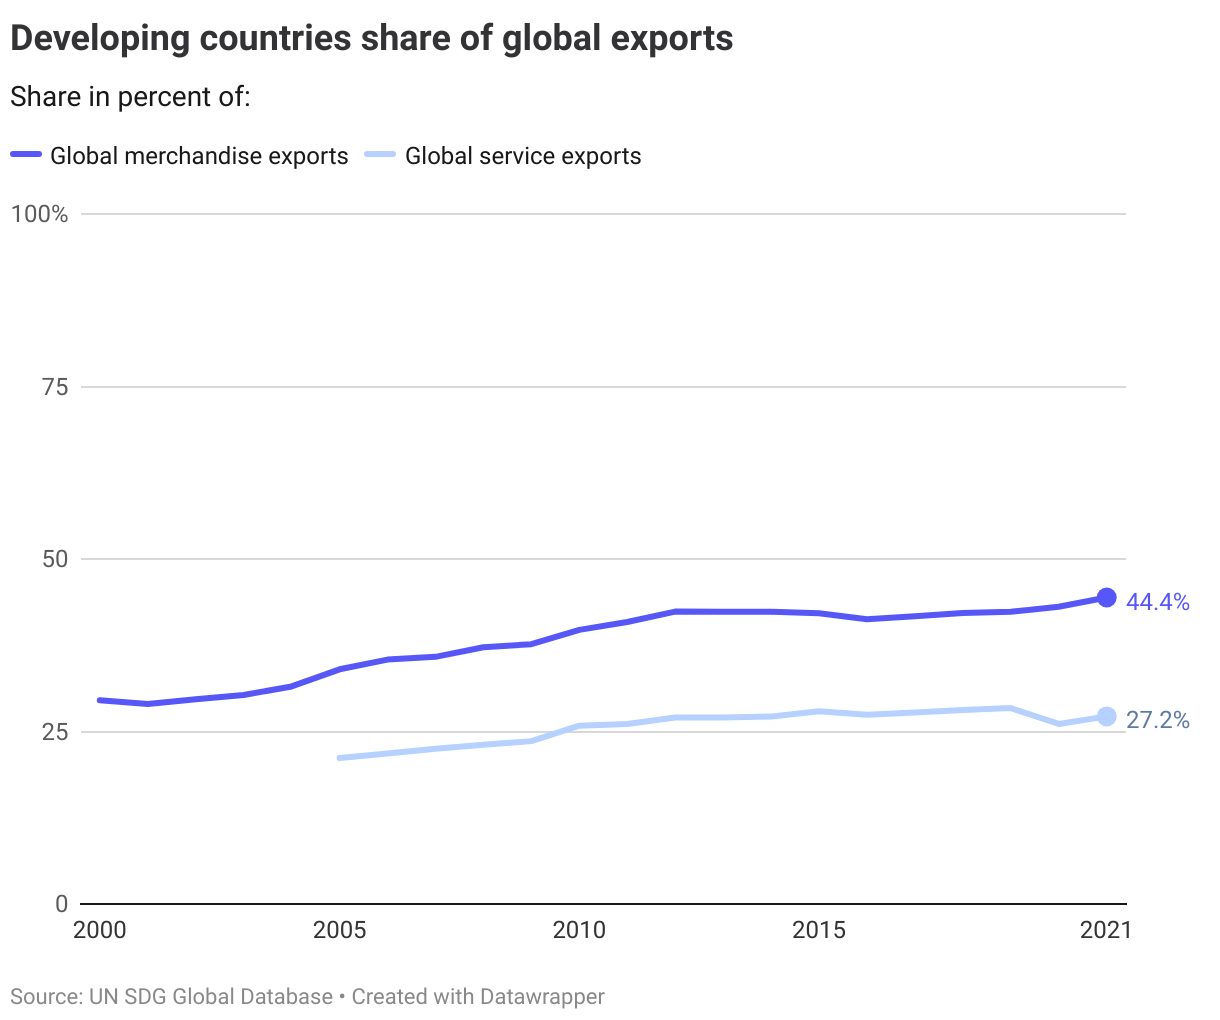
Global trends
Developing countries’ share of global merchandise and service exports have stabilised in recent years after increasing until the start of the century. As such, there has been no progress towards to goal of increasing developing countries’ share of exports since 2015. Note that this target was to be achieved by 2020.
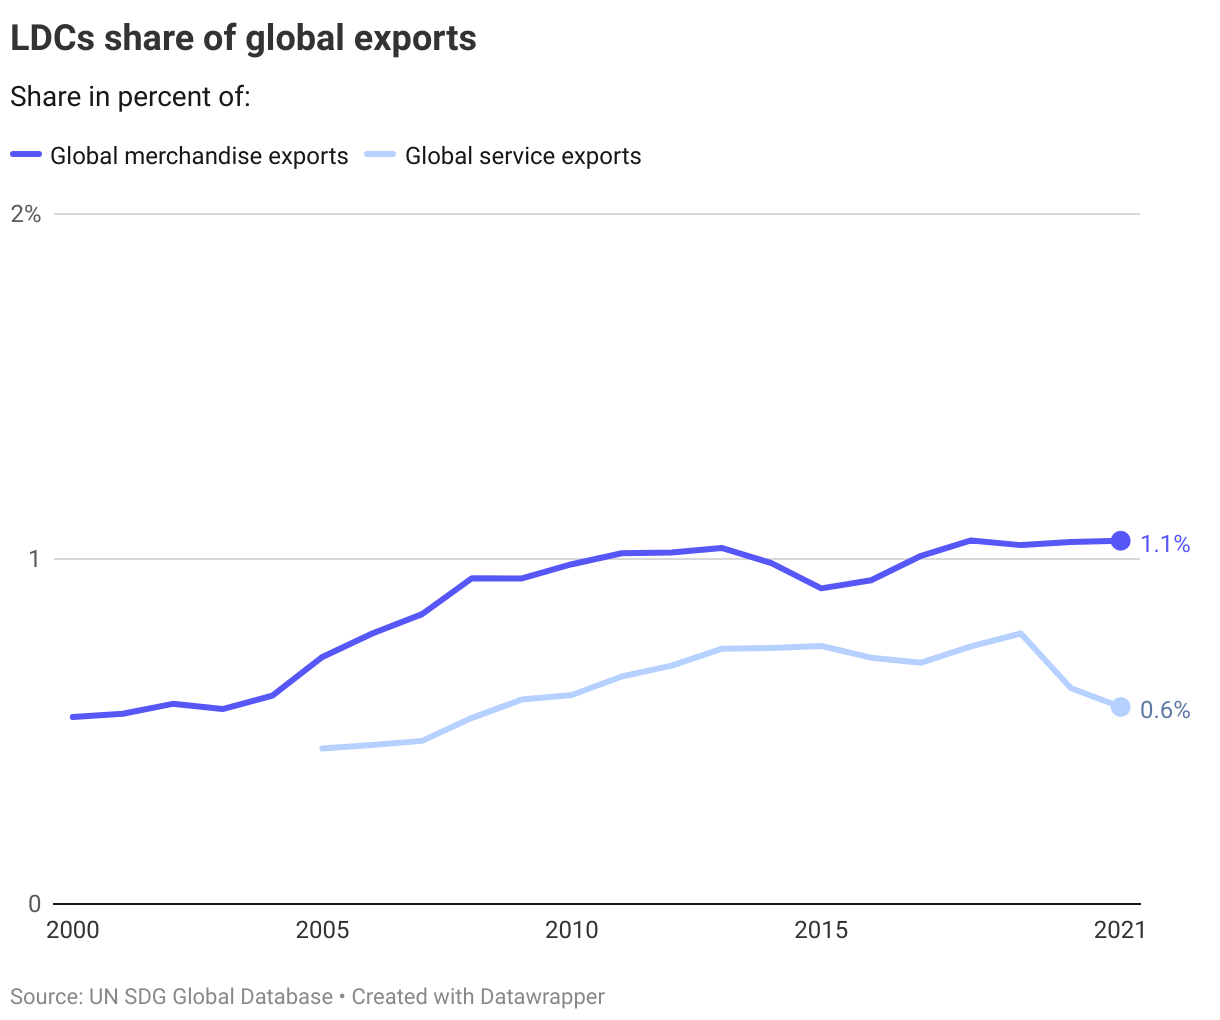
Least developed countries (LDCs) also seem to be far off the target of doubling their share of exports. As of 2021, countries classified as LDCs stand for 1.1% of global merchandise exports and 0.6% of global service exports.
The Nordics
Not applicable at the Nordic country level.
Target 17.12
Realize timely implementation of duty-free and quota-free market access on a lasting basis for all least developed countries, consistent with World Trade Organization decisions, including by ensuring that preferential rules of origin applicable to imports from least developed countries are transparent and simple, and contribute to facilitating market access
| 17.12.1 | Weighted average tariffs faced by developing countries, least developed countries and small island developing States |
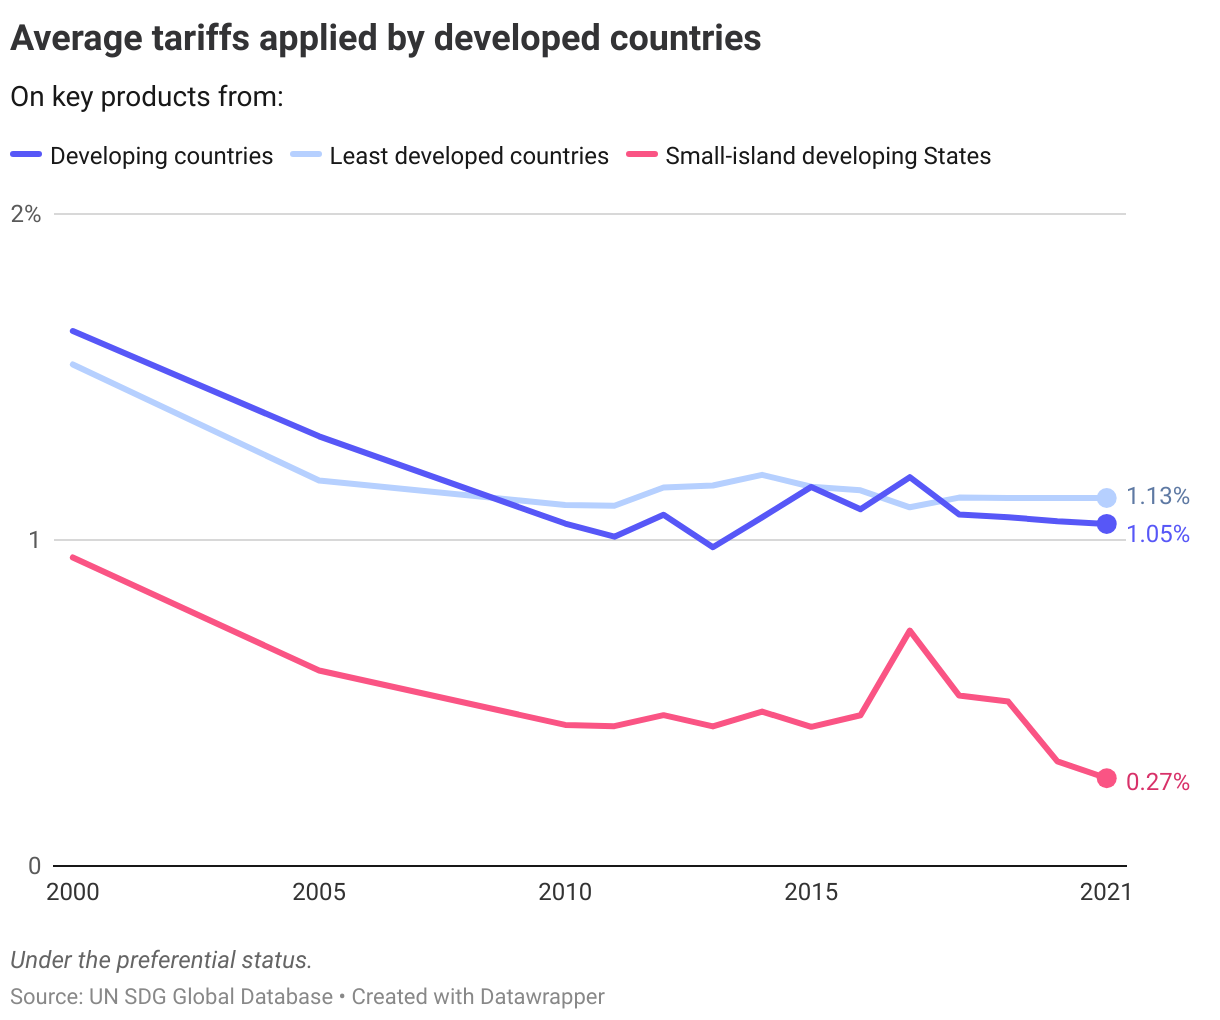
Global trends
After declining at the start of the century, tariff levels faced by developing countries have remained largely unchanged for the past decade and currently stand at just above 1% for a weighted average of key products (agricultural products, arms, clothing, industrial products, oil and textiles). A similar level is observed for least developed countries, while small island developing States are at around 0.3%.
The Nordics
The average tariff levels applied by the Nordics on key products from developing countries were lower in 2021 than they were in 2000. However, progress has been uneven. In Iceland tariff levels have remained stable since 2015. In Norway they have increased, although Norway still has the lowest tariff levels of the Nordics. Still, no Nordic country is close to the target operationalised by the OECD at below 0.7%, based on the level of best performers in 2015.
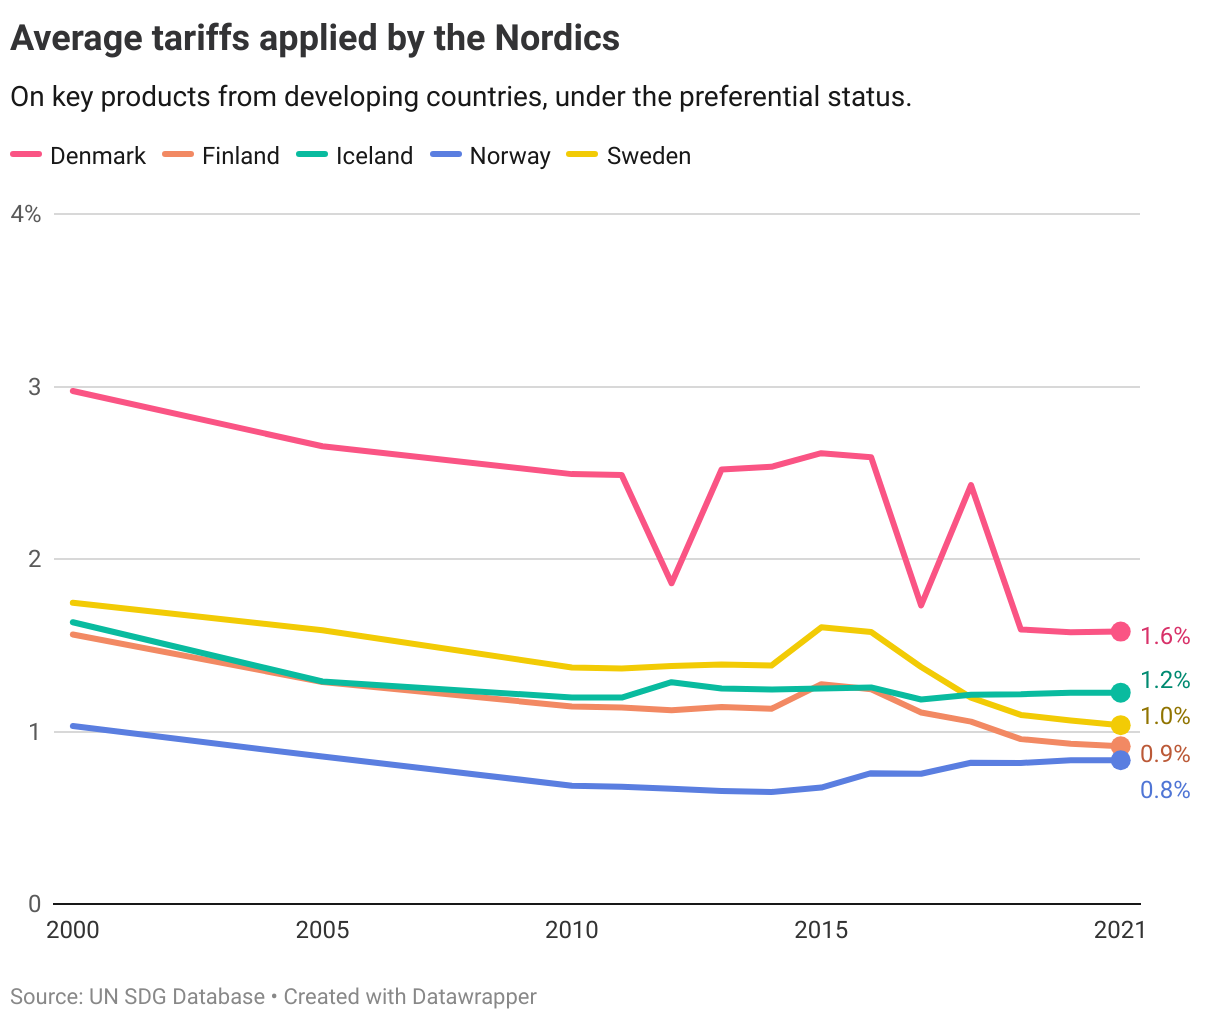
The overall assessment, also integrating data on most-favoured nation status, shows that Finland, Norway and Sweden are at a short distance to target, while Denmark and Iceland are at a long distance, though progressing towards it.
Denmark
Long distance to target but progressing
Finland
Short distance to target
Iceland
Long distance to target but progressing
Norway
Short distance to target
Sweden
Short distance to target
Target 17.13
Enhance global macroeconomic stability, including through policy coordination and policy coherence
| 17.13.1 | Macroeconomic Dashboard |
Data on this target is to be integrated into the tracker in the future.
Target 17.14
Enhance policy coherence for sustainable development
| 17.14.1 | Number of countries with mechanisms in place to enhance policy coherence of sustainable development |
Insufficient data are available for analysis of global, regional or country-level trends.
Target 17.15
Respect each country’s policy space and leadership to establish and implement policies for poverty eradication and sustainable development
| 17.15.1 | Extent of use of country-owned results frameworks and planning tools by providers of development cooperation |
Global trends
This indicator is based on an assessment of three sub-indicators:
- Whether objectives are drawn from country-owned results frameworks, plans and strategies
- Share of results indicators that are drawn from country-owned results frameworks, plans and strategies %
- Share of results indicators that will rely on sources of data provided by existing country-led monitoring systems or national statistical services to track project progress %
The three sub-indicators are combined in an average index score from 0-100, where 100 indicates the best possible score. Higher scores indicate a higher extent of ownership by the recipient country in development cooperation partnerships.
The latest data from 2018 shows that the world average for all bilateral providers stood at 57, down from 64 in 2016.
The Nordics
Among the Nordics, only Iceland achieves a full score on the index.
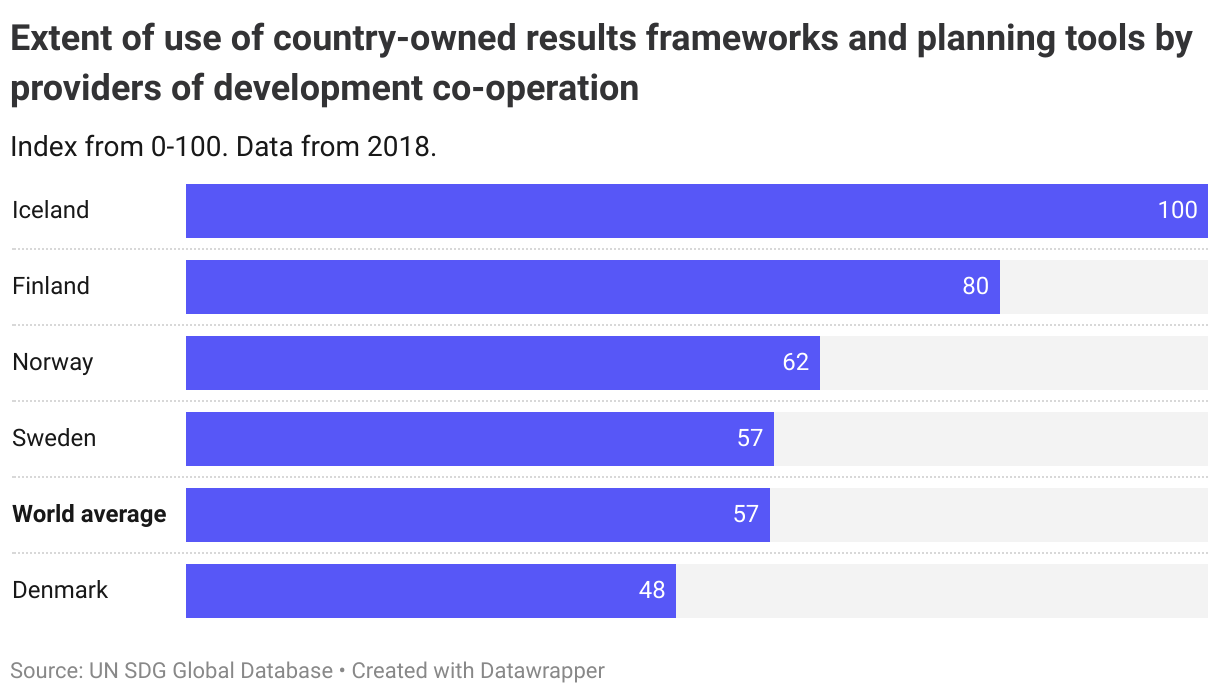
Denmark
Long distance to target, not progressing
Finland
Short distance to target
Iceland
Target is met
Norway
Long distance to target, not progressing
Sweden
Long distance to target, not progressing
Target 17.16
Enhance the Global Partnership for Sustainable Development, complemented by multi-stakeholder partnerships that mobilize and share knowledge, expertise, technology and financial resources, to support the achievement of the Sustainable Development Goals in all countries, in particular developing countries
| 17.16.1 | Number of countries reporting progress in multi-stakeholder development effectiveness monitoring frameworks that support the achievement of the Sustainable Development Goals |
Global trends
Almost half of countries providing and or receiving development cooperation, reported progress towards strengthening multistakeholder partnerships for development in support of achievement of the SDGs.
The Nordics
Finland, Iceland, Norway and Sweden are among the countries reporting progress.
Denmark
Long distance to target, not progressing
Finland
Target is met
Iceland
Target is met
Norway
Target is met
Sweden
Target is met
Target 17.17
Encourage and promote effective public, public-private and civil society partnerships, building on the experience and resourcing strategies of partnerships
| 17.17.1 | Amount in United States dollars committed to public-private partnerships for infrastructure |
Insufficient data are available for analysis of global, regional or country-level trends.
Target 17.18
By 2020, enhance capacity-building support to developing countries, including for least developed countries and small island developing States, to increase significantly the availability of high-quality, timely and reliable data disaggregated by income, gender, age, race, ethnicity, migratory status, disability, geographic location and other characteristics relevant in national contexts
| 17.18.1 | Statistical capacity indicator for Sustainable Development Goal monitoring |
| 17.18.2 | Number of countries that have national statistical legislation that complies with the Fundamental Principles of Official Statistics |
| 17.18.3 | Number of countries with a national statistical plan that is fully funded and under implementation, by source of funding |
Global trends
No data is available for indicator 17.18.1.
The latest data from 2022 shows that 147 countries worldwide had in place national statistics legislation in compliance with the Fundamental Principles of Official Statistics (17.18.2). This is an increase from 132 countries in 2019. 100 countries had a fully funded national statistics plan as of 2022 (17.18.3).
The Nordics
All the Nordics have legislation in compliance with the Fundamental Principles of Official Statistics and a fully funded national statistics plan.
Denmark
Target is met
Finland
Target is met
Iceland
Target is met
Norway
Target is met
Sweden
Target is met
Target 17.19
By 2030, build on existing initiatives to develop measurements of progress on sustainable development that complement gross domestic product, and support statistical capacity-building in developing countries
| 17.19.1 | Dollar value of all resources made available to strengthen statistical capacity in developing countries |
| 17.19.2 | Proportion of countries that (a) have conducted at least one population and housing census in the last 10 years; and (b) have achieved 100 per cent birth registration and 80 per cent death registration |
Global trends
17.19.1. Resources to strenghten statistical capacity
In 2020, the latest year for which data is available, the total Official Development Assistance (ODA) for data and statistics stood at $541 million, up from $453 million in 2015.
17.19.2. Census and birth registration
There are still large coverage gaps in birth and death registration statistics worldwide. Censuses are also a challenge, with 14% of countries worldwide not having conducted at least one population and housing census in the past 10 years.
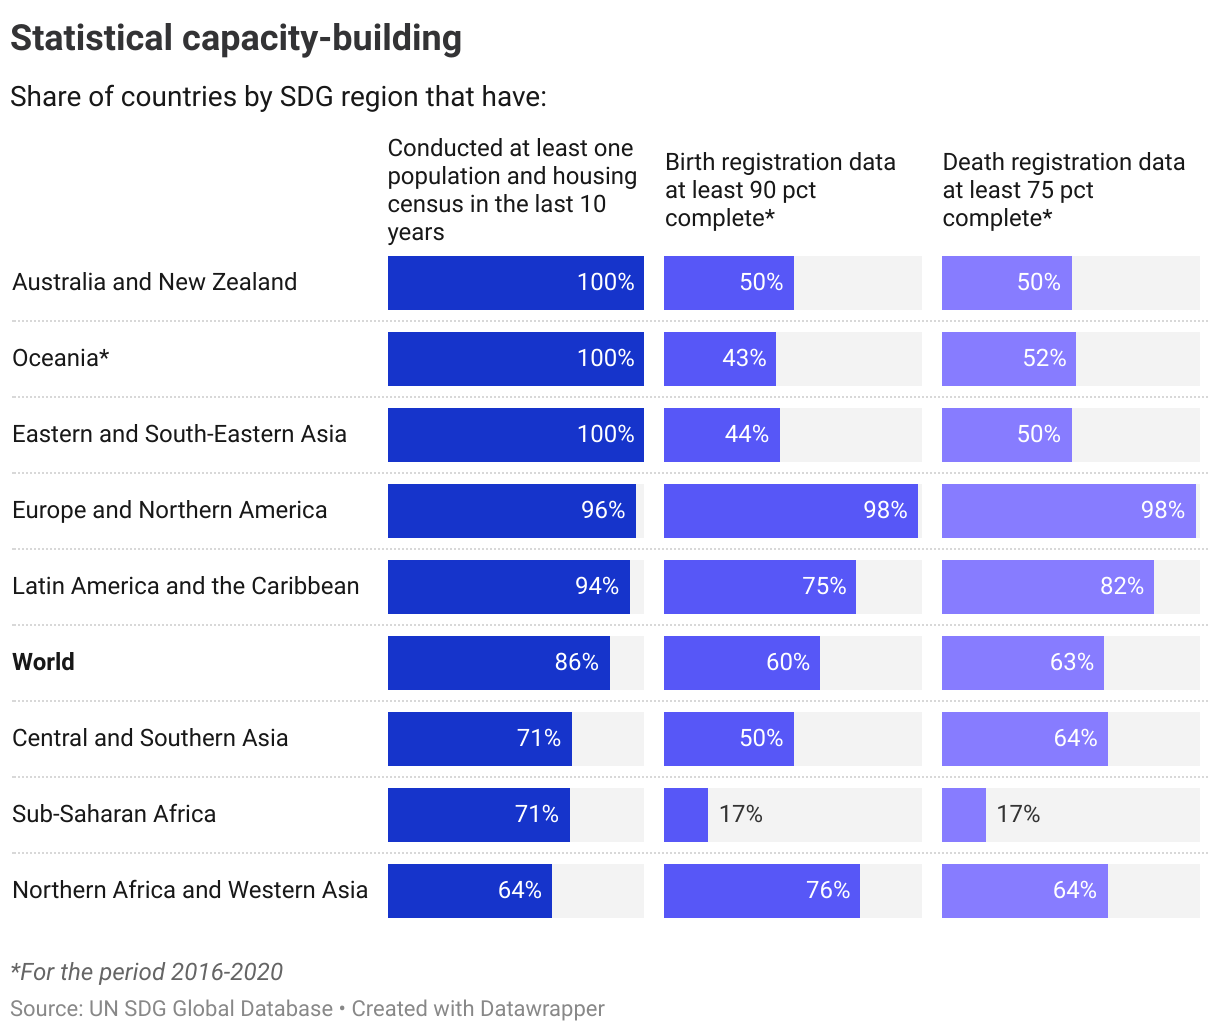
The Nordics
All the Nordics fulfil the required target levels in indicator 17.19.2, and have complete birth and death registration data, as well as conducting regular population and housing surveys.
Denmark
Target is met
Finland
Target is met
Iceland
Target is met
Norway
Target is met
Sweden
Target is met