

Introduction
This data tracker analyses the Nordic countries’ progress towards achieving Sustainable Development Goal 14: Conserve and sustainably use the oceans, seas and marine resources for sustainable development. The goal is comprised of 10 targets.
The Nordic countries – Denmark, Finland, Iceland, Norway and Sweden – are classified into one of five categories for each target:
Met: The country has already met the 2030 target.
On track: The country has not yet met the target but is on track to do so by 2030.
Short distance: The country has not met the target and is not projected to do so but is close to achieving it. This category also applies when the country currently meets the target but is projected to move away from it.
Long distance but progressing: The country is far from the target but is making progress towards it.
Long distance and not progressing: The country is far from the target and is not making progress towards reaching it.
Details on the methodology used, together with the overall assessment for all 17 goals, can be found on our overview page. Note that the analysis is currently work in progress.
Overall assessment of progress
As of mid-2023, this is our assessment of the Nordic countries progress on the 10 targets part of SDG 14:
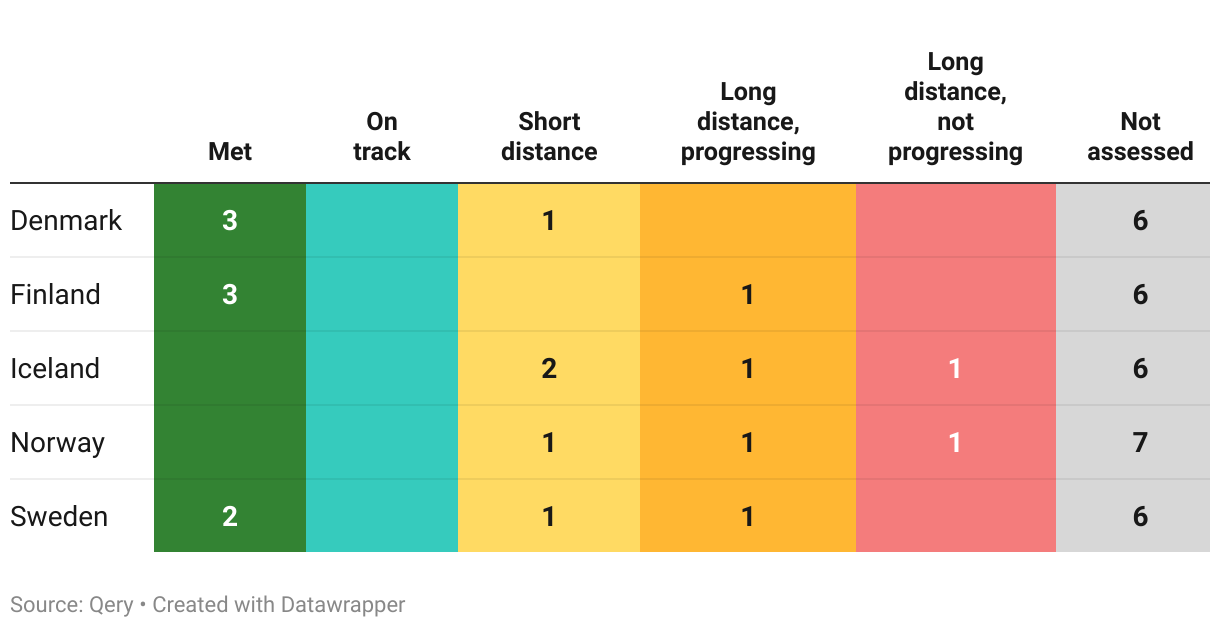
The Nordic countries’ performance on the different targets part of this goal can be explored further below. Each section follows the same structure:
- First, the official target text and related indicators is described and the latest global and regional trends are highlighted briefly.
- Second, where data is available, we then zoom in on the Nordic countries to describe how they are progressing, and assess their likelihood of achieving the target by the 2030 deadline.
- Note that both sections above strictly uses data from the UN SDG Global Database and/or the OECD.
Target 14.1
By 2025, prevent and significantly reduce marine pollution of all kinds, in particular from land-based activities, including marine debris and nutrient pollution
| 14.1.1 | (a) Index of coastal eutrophication; and (b) plastic debris density |
Global trends
Coastal eutrophication occurs when coastal waters become enriched with nutrients, causing excessive growth of plants, algae and phytoplankton. Eutrophication is primarily a result of land-based nutrient flows from agricultural processes (fertilizer runoff, livestock waste) and domestic wastewater discharge (sewage).
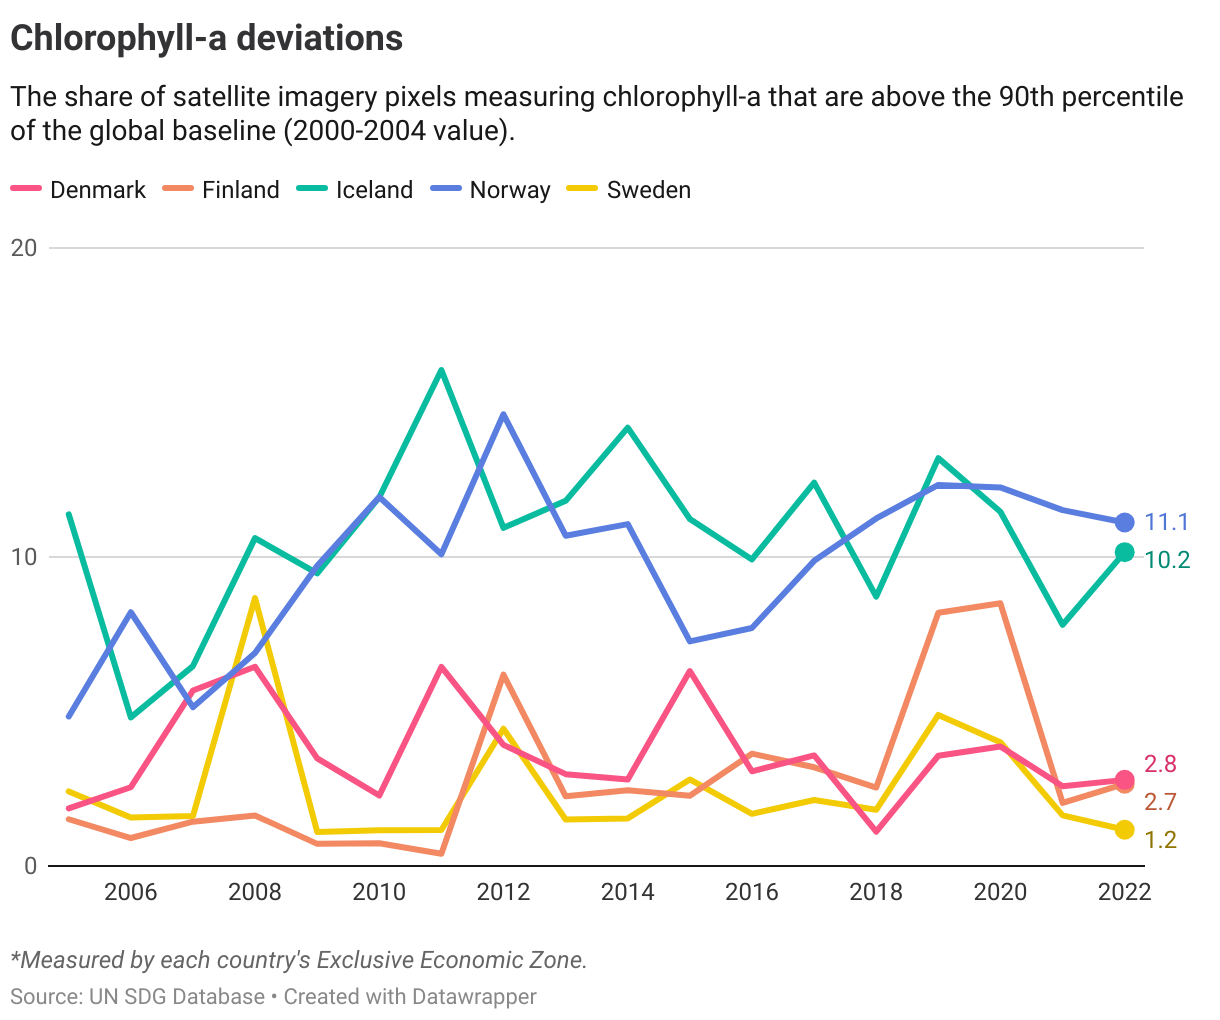
Globally, coastal eutrophication is measured through analysis of chlorophyll-a concentrations. Coastal waters with excessive nutrient enrichment may have high concentrations of chlorophyll-a and excess amounts of algae. Indicator 14.1.1a looks at the degree of deviation of chlorophyll-a in coastal waters compared to a 2000-2004 baseline.
According to the latest UN SDG progress report, 2022 satellite images show increased global coastal eutrophication trends compared to the 2000-2004 baseline, though different in magnitude from recent years. Consistent high levels were detected in the Arabian Sea from 2018-2022.
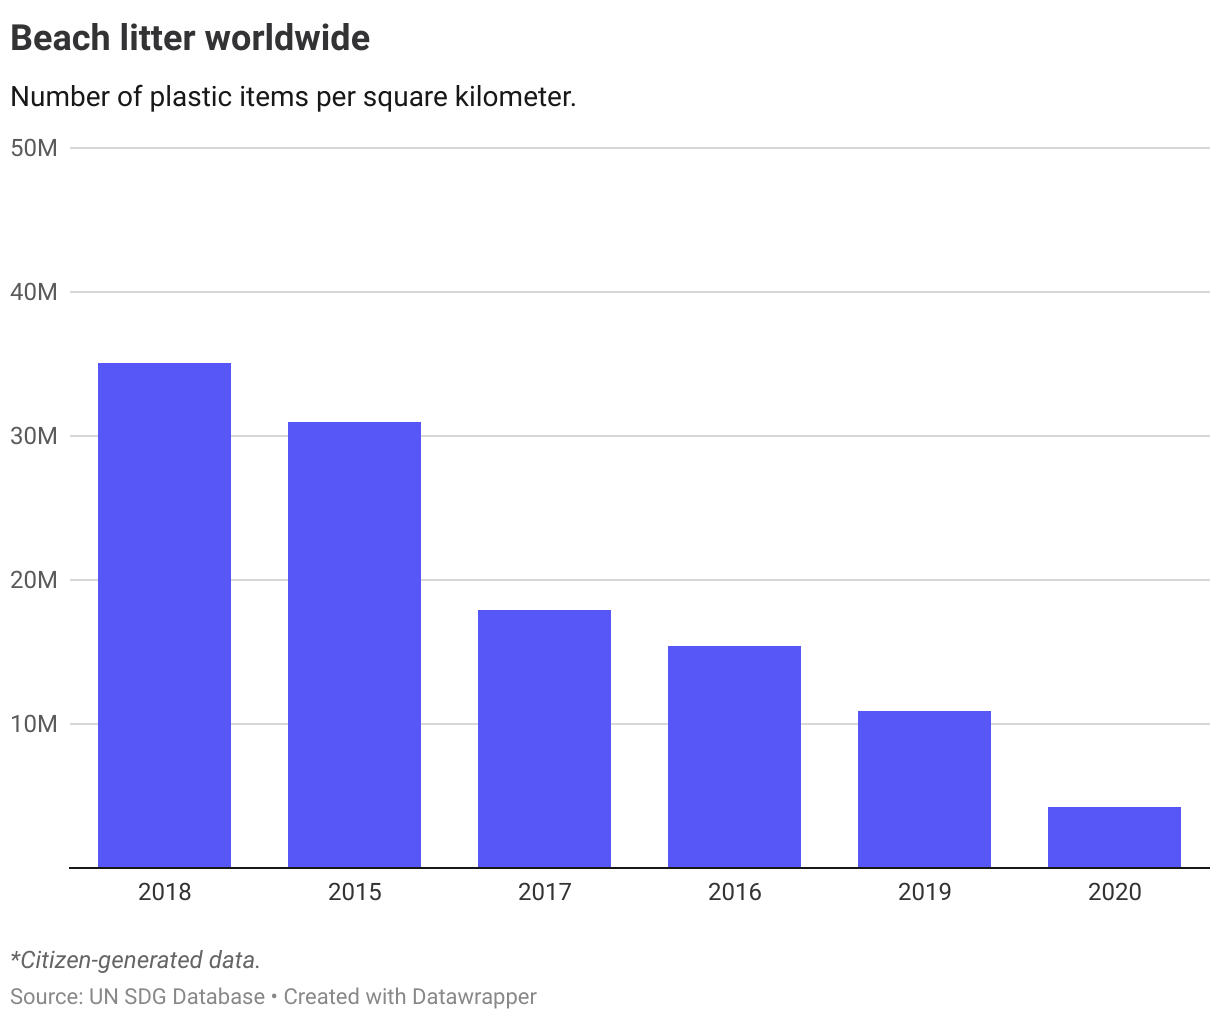
Plastics make up the vast majority of marine litter, and the UN estimates that around 17 million tonnes of plastic filled the ocean. The amount could double or triple by 2040 unless urgent action is taken. The plastic litter density (indicator 14.1.1b) measures the amount of beach litter per square kilometre and is derived from citizen-generated data. The chart below shows the developments since 2015. Note, however, that the numbers for 2020 are likely to be impacted by the pandemic as the data is based on citizen reporting.
The Nordics
Data on chlorophyll-a deviations show that impact levels are above the global baseline from 2000-2004 in all the Nordic countries, and significantly higher in Norway and Iceland.
Data on plastic debris density is to be updated, therefore no overall progress assessment is performed on this target.
Target 14.2
By 2020, sustainably manage and protect marine and coastal ecosystems to avoid significant adverse impacts, including by strengthening their resilience, and take action for their restoration in order to achieve healthy and productive oceans
| 14.2.1 | Number of countries using ecosystem-based approaches to managing marine areas |
Global trends
No data is available to assess progress at the global or regional level.
The Nordics
This target was set to be achieved by 2020. The latest UN data shows that Denmark and Finland have implemented ecosystem-based approaches to their marine areas. Sweden is progressing and is deemed to be at a plan adoption/designation stage. There is no data from the UN SDG Global Database indicating any progress in Iceland and Norway towards this target.
Denmark
Target is met
Finland
Target is met
Iceland
Long distance to target, not progressing
Norway
Long distance to target, not progressing
Sweden
Short distance to target
Target 14.3
Minimize and address the impacts of ocean acidification, including through enhanced scientific cooperation at all levels
| 14.3.1 | Average marine acidity (pH) measured at agreed suite of representative sampling stations |
Global trends
While the number of observation stations of ocean acidification, large reporting gaps still exists. However, according to the UN, observation sites in the open ocean show a continuous decline in pH levels over the past 20 to 30 years. Increased acidification is a result of the world’s oceans absorbing carbon dioxide emissions, and represent a threat to the global marine ecosystem. Acidification is expected to increase over the coming decades.
The Nordics
Data for Nordic countries is insufficient for a cross-country comparison and progress assessment. For those OECD countries where there are monitoring stations, the data also shows a consistent decline in pH.
Target 14.4
By 2020, effectively regulate harvesting and end overfishing, illegal, unreported and unregulated fishing and destructive fishing practices and implement science-based management plans, in order to restore fish stocks in the shortest time feasible, at least to levels that can produce maximum sustainable yield as determined by their biological characteristics
| 14.4.1 | Proportion of fish stocks within biologically sustainable levels |
Global trends
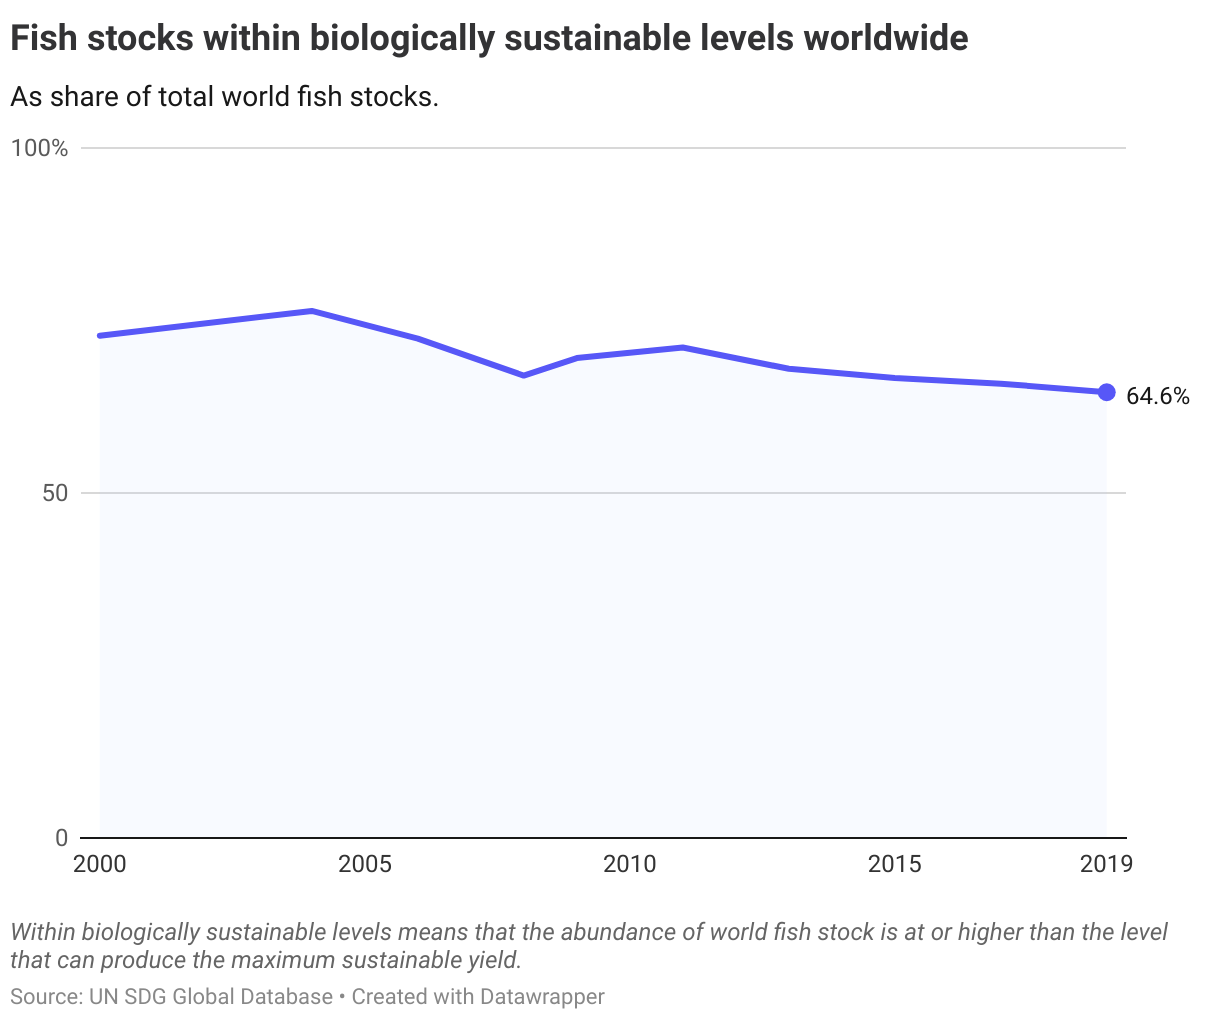
The global share of fish stocks within biologically sustainable levels stood at 64.6% worldwide in 2019, a decline from 72.8% in 2000 and 66.7% in 2015. The share of sustainable fish stocks were lowest in the Southeast Pacific (33.7%) and the Mediterranean and the Black Sea (36.6%), while the highest levels were found in Eastern Central Pacific, Southwest Pacific, Northeast Pacific and Western Central Pacific (ranging from 79 to 87%). According to the UN, improved regulations and monitoring have been key to improving the sustainability of fish stocks, yet such measures suffer from slow adoption, especially in developing countries.
The Nordics
Insufficient data for assessment of progress in the Nordic countries. The UN SDG Global Database provides only two datapoints for one year; 2018 for Finland (80%) and Sweden (69%).
Target 14.5
By 2020, conserve at least 10 per cent of coastal and marine areas, consistent with national and international law and based on the best available scientific information
| 14.5.1 | Coverage of protected areas in relation to marine areas |
Global trends
In 2021 just over 8% of total marine areas worldwide were protected. However, the UN estimates that this will rise closer to the 10% target based on recent new designations. While the target is close to being achieved, it is important to note that there are still important areas that are not protected.
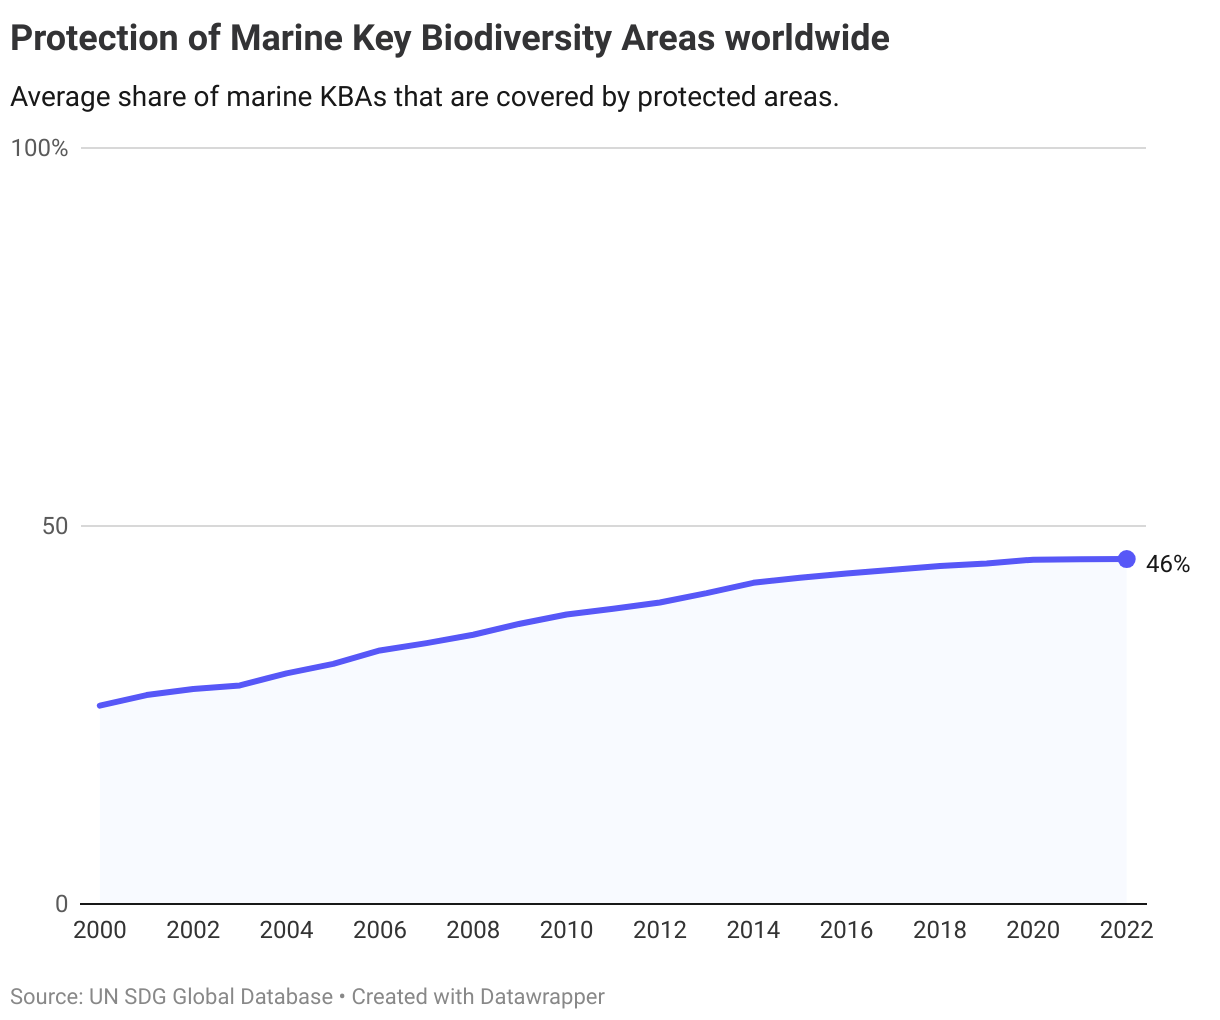
Such areas, called key biodiversity areas (KBA), are deemed to contribute significantly to the global persistence of biodiversity. From 2000 to 2022 the share of marine KBAs that were covered by protected areas increased from 26% to 46%. However, in recent years the increase has slowed.
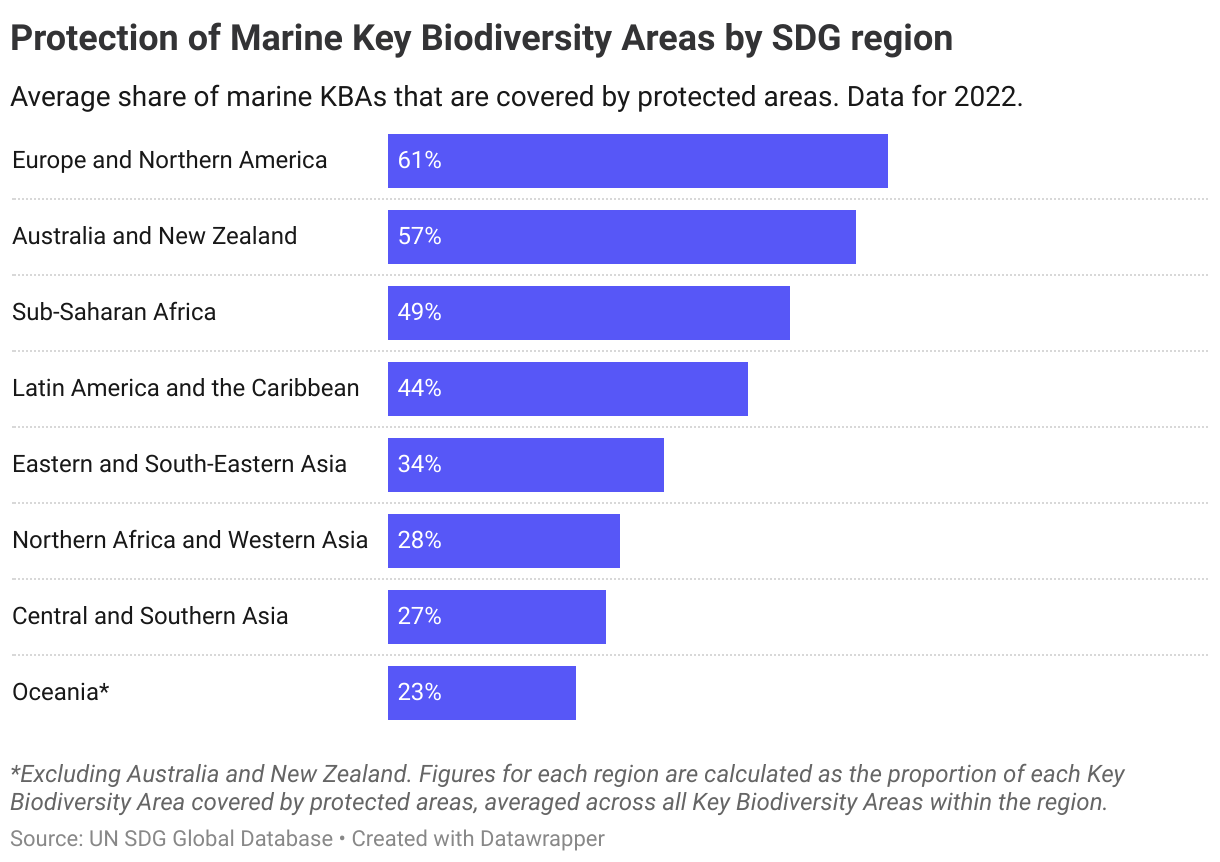
The highest shares of protected marine KBAs as of 2022 can be found in Europe and Northern America, with over 60% of KBAs protected.
The Nordics
According to the latest data from 2021, Denmark, Finland and Sweden had expanded their marine protected areas to above the target level of 10% of their exclusive economic zone. The overall trend in OECD countries, including the Nordics, is that the level of protection has risen over the last two decades.
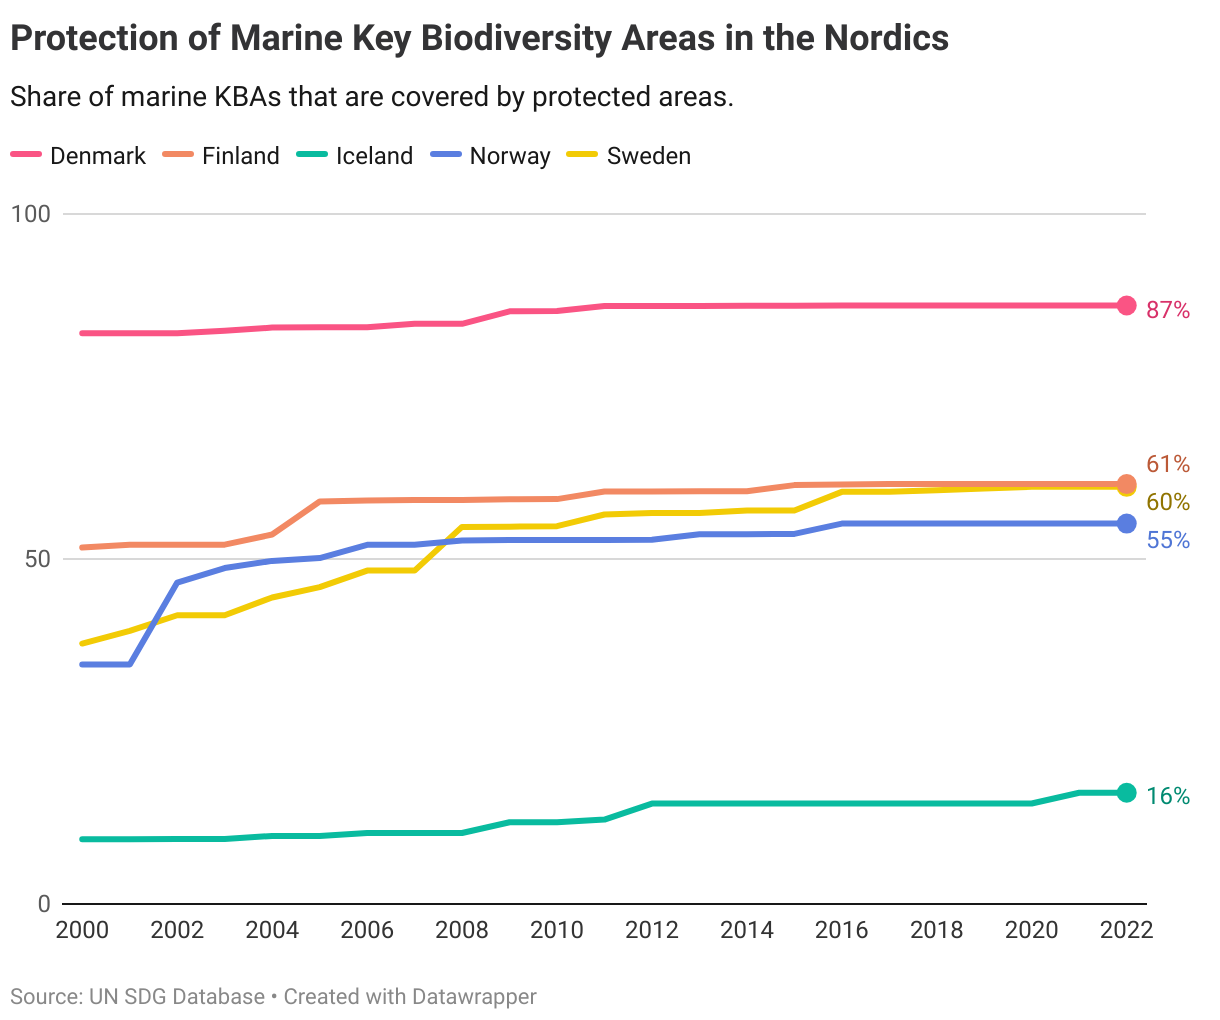
The share of marine key biodiversity areas (KBA) that are protected varies significantly in the Nordics, with 87% coverage levels in Denmark to 16% in Iceland. As there is no set target on the protection level of KBAs, the OECD has operationalised the target at 93%, corresponding to the level of the best OECD performers in 2015. Currently, while some progress is being made, none of the Nordics is on a path to achieve this level by 2030.
Denmark
Short distance to target
Finland
Long distance to target but progressing
Iceland
Long distance to target but progressing
Norway
Long distance to target but progressing
Sweden
Long distance to target but progressing
Target 14.6
By 2020, prohibit certain forms of fisheries subsidies which contribute to overcapacity and overfishing, eliminate subsidies that contribute to illegal, unreported and unregulated fishing and refrain from introducing new such subsidies, recognizing that appropriate and effective special and differential treatment for developing and least developed countries should be an integral part of the World Trade Organization fisheries subsidies negotiation
| 14.6.1 | Degree of implementation of international instruments aiming to combat illegal, unreported and unregulated fishing |
Global trends
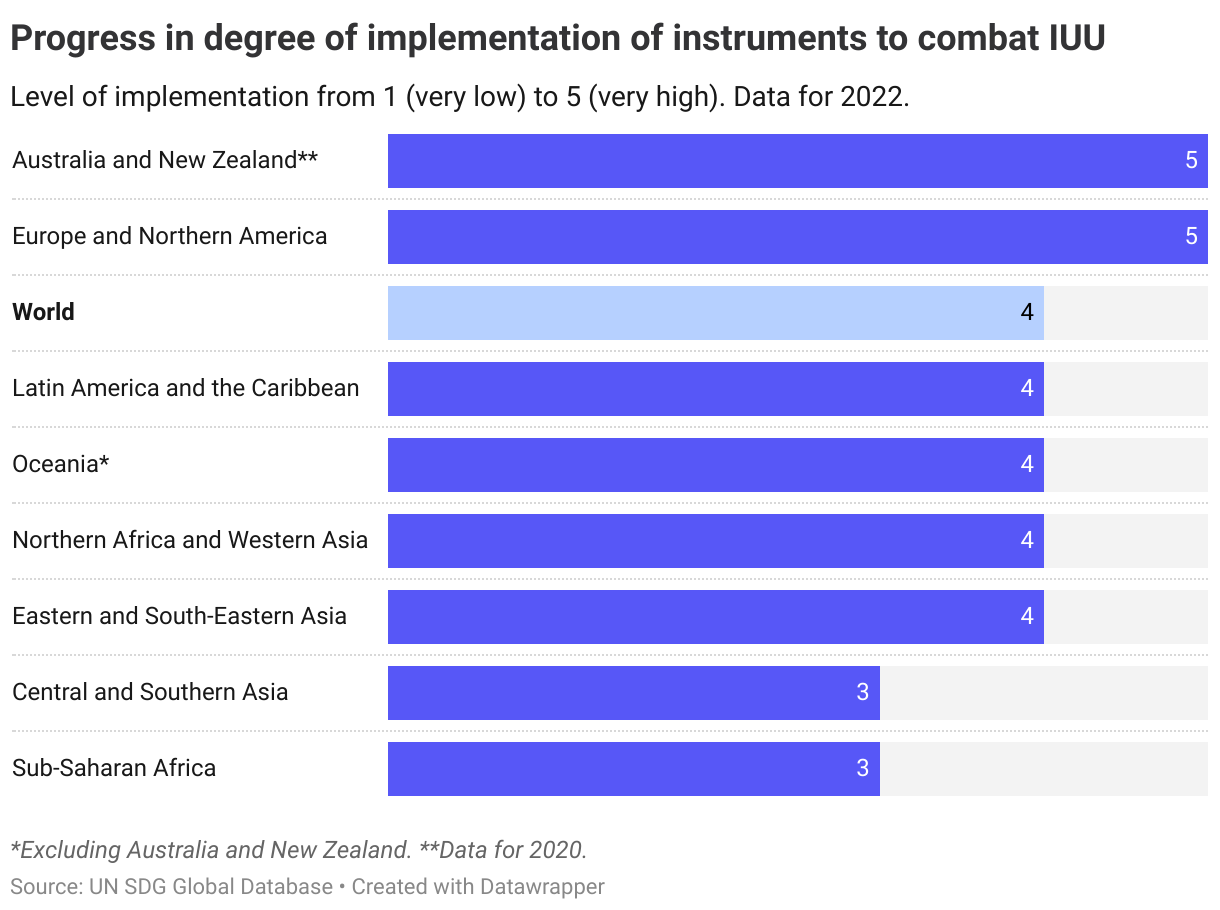
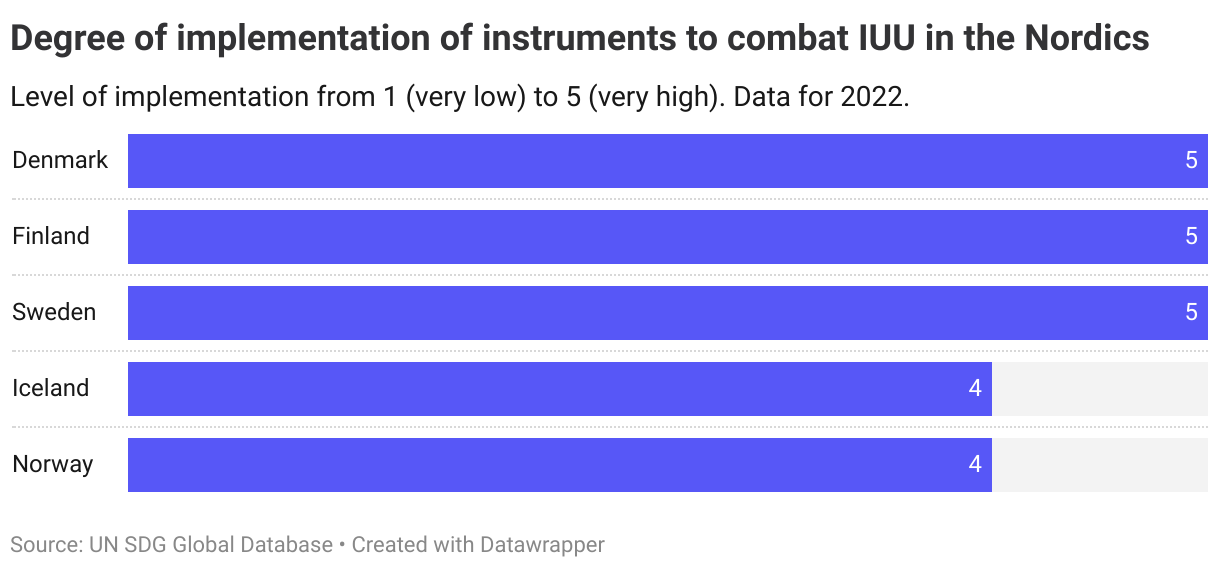
As of 2022, countries worldwide scored an average of 4 out of 5 in their level of implementation of international instruments to combat illegal, unreported and unregulated fishing (IUU). Data shows that progress is being made globally, with the global average increasing from 3 out of 5 in 2018. As a further mark of progress, in June 2022 members of the WTO adopted the Agreement on Fisheries Subsidies to end prohibited fisheries subsidies.
The Nordics
The latest data from 2022 shows that Denmark, Finland and Sweden have reached the target level with a score of 5 out of 5 in their level of implementation of instruments to combat IUU. Norway and Iceland achieve are considered to be at a short distance to the target, with a level of 4 out of 5. Iceland had a level of 5 in 2018 and has thus moved away from the target, while the level in Norway in 2022 is the same as in 2018.
Denmark
Target is met
Finland
Target is met
Iceland
Short distance to target
Norway
Short distance to target
Sweden
Target is met
Target 14.7
By 2030, increase the economic benefits to Small Island developing States and least developed countries from the sustainable use of marine resources, including through sustainable management of fisheries, aquaculture and tourism
| 14.7.1 | Sustainable fisheries as a proportion of GDP in small island developing States, least developed countries and all countries |
Global trends
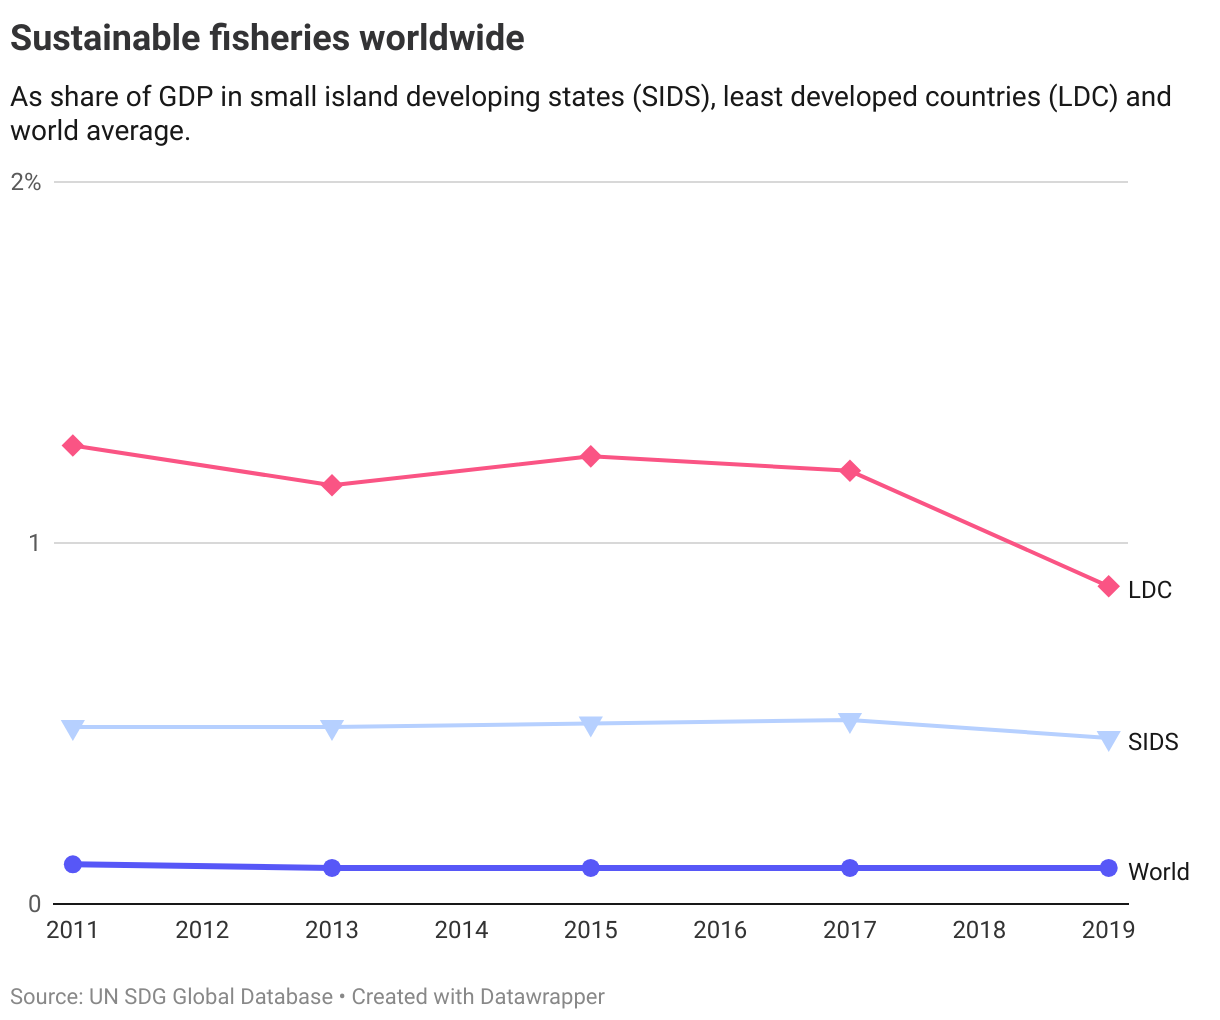
Sustainable fisheries accounted for a total of 0.1% of world GDP in 2019, a level which was unchanged from 2011 (earliest available data). In least developed countries and small island states, which to a larger degree depend on fishing, the share has declined compared to the level in 2011. The decline, according to the UN, reflects increasing pressures on wild stocks, impacting in particular Eastern and South-Eastern Asia.
The Nordics
Target not applicable to the Nordic countries.
Target 14.a
Increase scientific knowledge, develop research capacity and transfer marine technology, taking into account the Intergovernmental Oceanographic Commission Criteria and Guidelines on the Transfer of Marine Technology, in order to improve ocean health and to enhance the contribution of marine biodiversity to the development of developing countries, in particular small island developing States and least developed countries
| 14.a.1 | Proportion of total research budget allocated to research in the field of marine technology |
Global trends
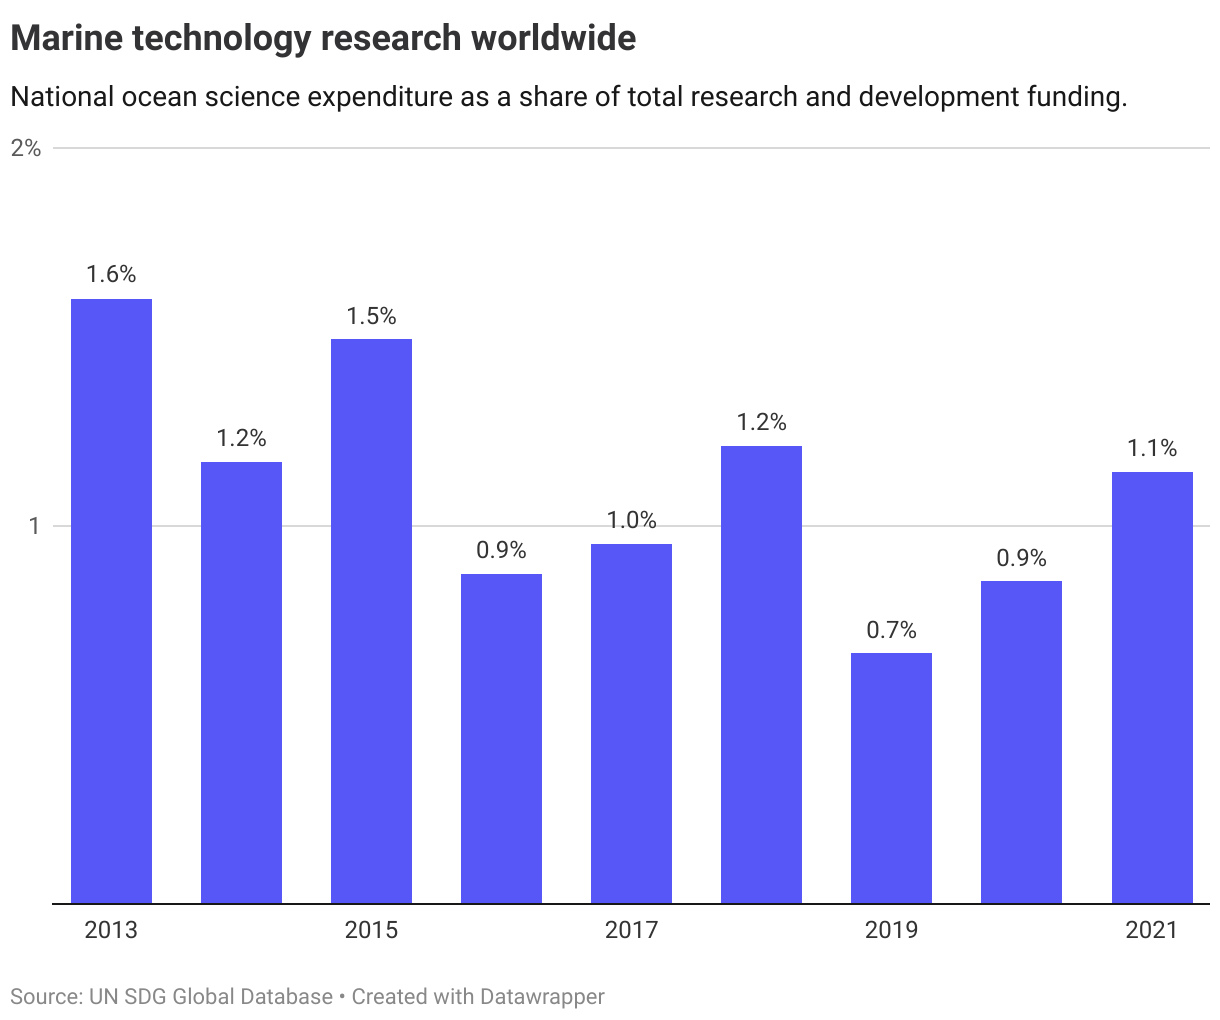
There is no set target level for this indicator, and data is not available for all countries. The latest UN data shows a decline from 1.5% in 2015 to 1.1% in 2021 for the global average. However, this should be interpreted with caution as the changes in the share allocated to marine technology in terms of total research allocations could depend on many factors.
The Nordics
No assessment of progress is performed for the Nordic countries as allocations will depend on national needs and priorities.
Target 14.b
Provide access for small-scale artisanal fishers to marine resources and markets
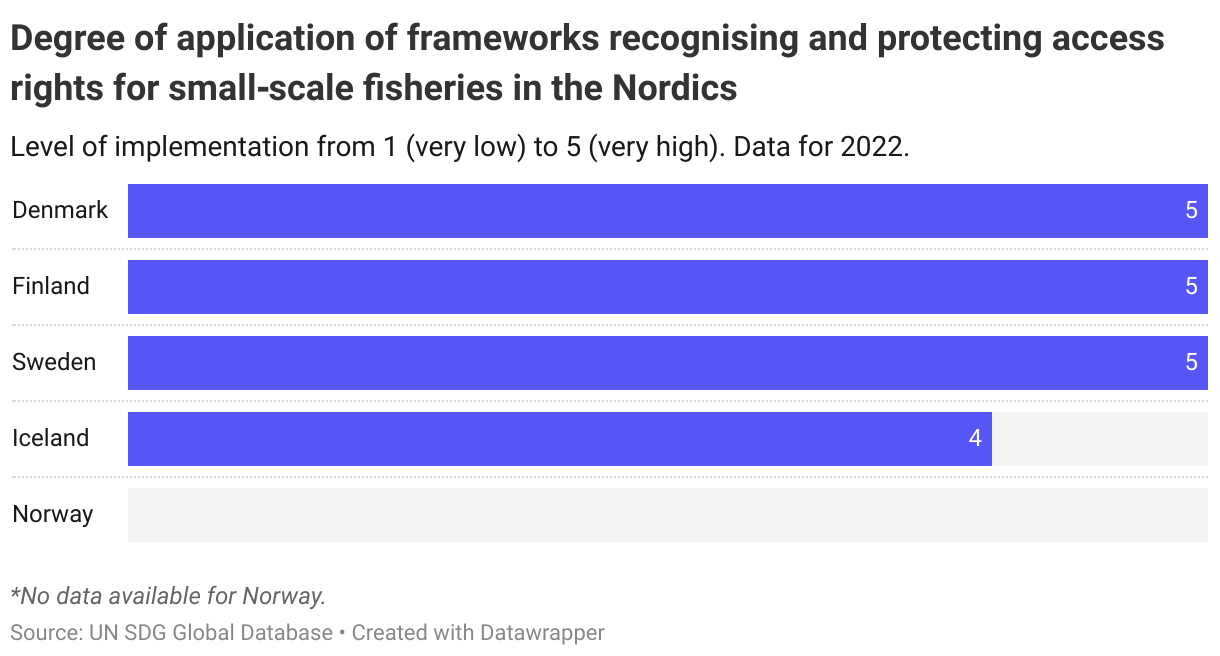
| 14.b.1 | Degree of application of a legal/regulatory/policy/institutional framework which recognises and protects access rights for small‐scale fisheries |
Global trends
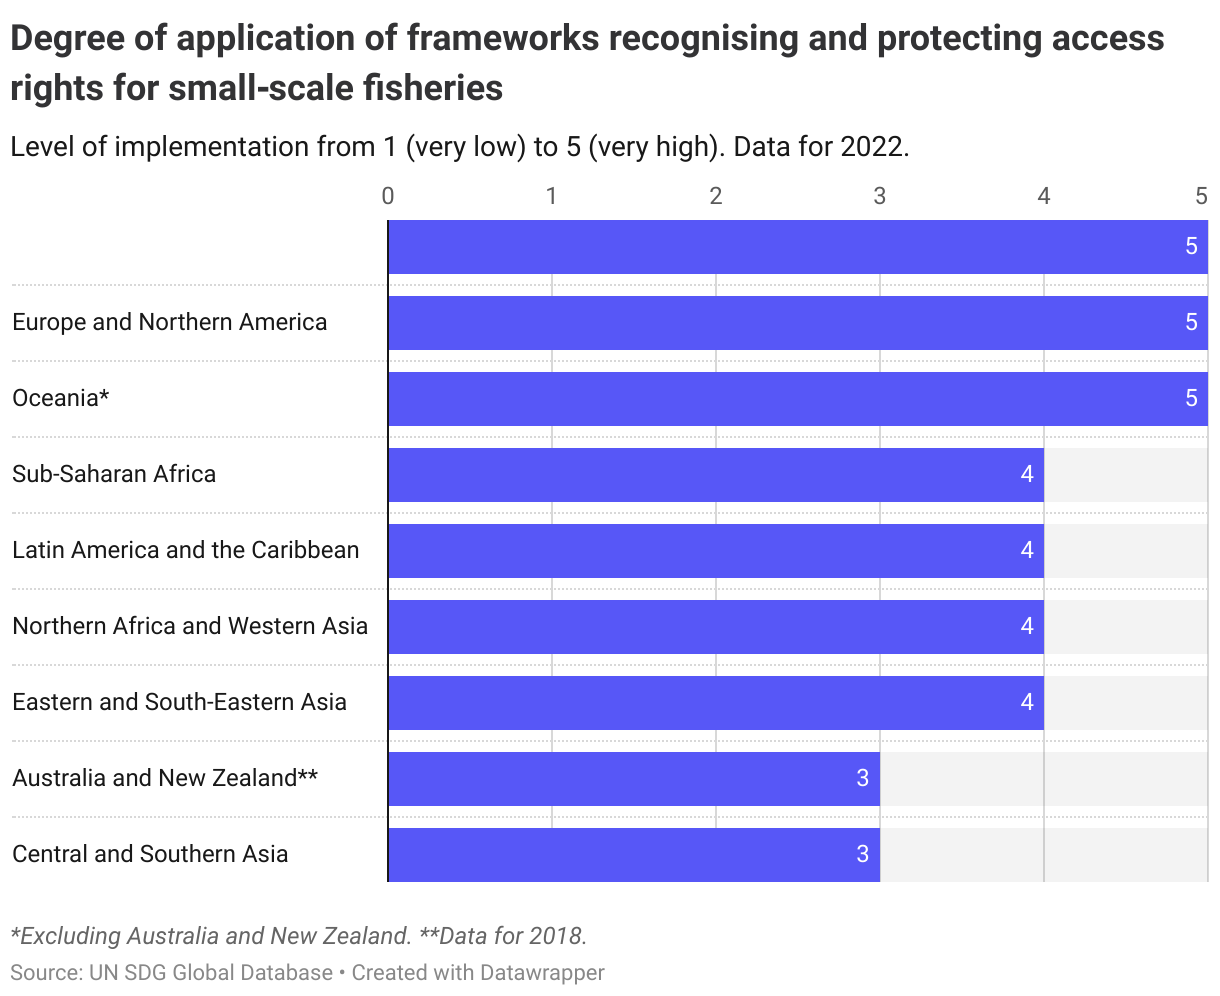
In 2022 the world average implementation of frameworks that recognises and protects access rights of small-scale fisheries reached a score of 5 out of 5, up from 3 out of 5 in 2018. The increase is due to increased global efforts to support small-scale fisheries, according to the UN. Regional data, however, shows that implementation is uneven with Central and Southern Asia as well as Australia and New Zealand scoring 3 out of 5.
The Nordics
Denmark, Finland and Sweden have all reached the target level of scoring 5 out of 5 in the degree of implementation in 2022. Iceland scores 4 out of 5, the same level as in 2018. No data is available for Norway on this indicator.
Denmark
Target is met
Finland
Target is met
Iceland
Short distance to target
Norway
No data
Sweden
Target is met
Target 14.c
Enhance the conservation and sustainable use of oceans and their resources by implementing international law as reflected in United Nations Convention on the Law of the Sea, which provides the legal framework for the conservation and sustainable use of oceans and their resources, as recalled in paragraph 158 of "The future we want"
| 14.c.1 | Number of countries making progress in ratifying, accepting and implementing through legal, policy and institutional frameworks, ocean-related instruments that implement international law, as reflected in the United Nations Convention on the Law of the Sea, for the conservation and sustainable use of the oceans and their resources |
Insufficient data available for analysis of global or regional trends.
The Nordics
Data is only available for Denmark and Iceland, showing that both have ratified the United Nations Convention on the Law of the Sea and it's two implementing agreements. Iceland also achieves almost a full score (97 of 100) on its level of implementation of the two agreements, with Denmark scoring 90 out of 100.