Introduction
This data tracker analyses the Nordic countries’ progress towards achieving Sustainable Development Goal 12: Ensure sustainable consumption and production patterns. The goal is comprised of 11 targets.
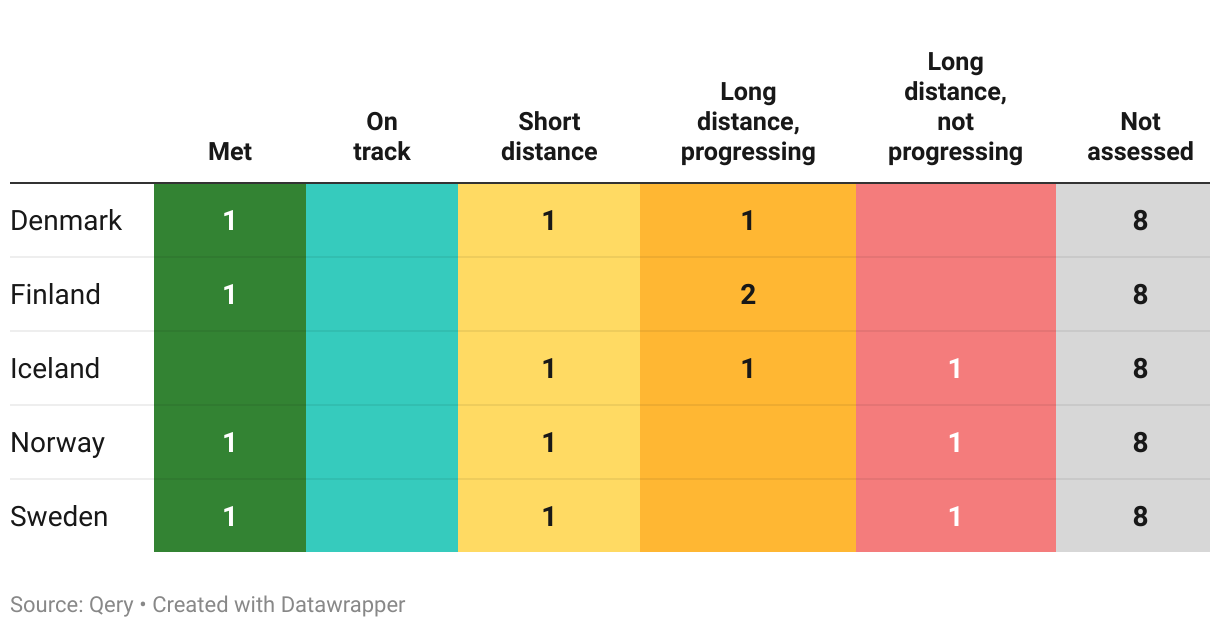
The Nordic countries – Denmark, Finland, Iceland, Norway and Sweden – are classified into one of five categories for each target:
Met: The country has already met the 2030 target.
On track: The country has not yet met the target but is on track to do so by 2030.
Short distance: The country has not met the target and is not projected to do so but is close to achieving it. This category also applies when the country currently meets the target but is projected to move away from it.
Long distance but progressing: The country is far from the target but is making progress towards it.
Long distance and not progressing: The country is far from the target and is not making progress towards reaching it.
Details on the methodology used, together with the overall assessment for all 17 goals, can be found on our overview page. Note that the analysis is currently work in progress.
Overall assessment of progress
As of mid-2023, this is our assessment of the Nordic countries progress on the 11 targets part of SDG 12:
The Nordic countries’ performance on the different targets part of this goal can be explored further below. Each section follows the same structure:
- First, the official target text and related indicators is described and the latest global and regional trends are highlighted briefly.
- Second, where data is available, we then zoom in on the Nordic countries to describe how they are progressing, and assess their likelihood of achieving the target by the 2030 deadline.
- Note that both sections above strictly uses data from the UN SDG Global Database and/or the OECD.
Target 12.1
Implement the 10-Year Framework of Programmes on Sustainable Consumption and Production Patterns, all countries taking action, with developed countries taking the lead, taking into account the development and capabilities of developing countries
| 12.1.1 | Number of countries developing, adopting or implementing policy instruments aimed at supporting the shift to sustainable consumption and production |
Global trends
Insufficient data for analysis of global and regional trends.
The Nordics
Available data from the UN SDG Global Database shows that Finland, Noway and Sweden have in place policies and plans to promote sustainable consumption and production (SCP). However, no assessment of progress is performed on this indicator as data is lacking on the degree of implementation of such plans and policies.
Global trends
As of 2021, only 26 countries worldwide had in place national action plans for sustainable consumption and production (SCP) or had mainstreamed SCP as a priority or target in national policies. Half of the countries were in Europe and Northern America, indicating that the adoption of SCP policies is very uneven geographically.
Looking at the total number of policies in place for SCP worldwide, the latest data from 2021 shows a total of 656 policies in place worldwide, with two-thirds of these within countries in Europe and Northern America.
Note that the regional groupings used in the visualisation above (and all other visualisations on this page with regional data) follow the UN regional classification for the Sustainable Development Goals.
Target 12.2
By 2030, achieve the sustainable management and efficient use of natural resources
| 12.2.1 | Material footprint, material footprint per capita, and material footprint per GDP |
| 12.2.2 | Domestic material consumption, domestic material consumption per capita, and domestic material consumption per GDP |
Note that these indicators are identical to those under target 8.4.
Global trends
12.2.1 Global material footprint
The global material footprint is the total amount of raw materials extracted to meet final consumption demands. Over the past two decades, it has increased by almost 40 billion tonnes, reaching close to 100 billion tonnes in 2019.
A central challenge over the next decades is to achieve higher levels of resource efficiency so as to decrease the pressure on raw material extraction. Yet, since 2000 there have been only marginal improvements in the amount of raw materials needed per unit of wealth produced. In 2019 this stood at 1.1 kg of raw materials per unit of wealth produced.
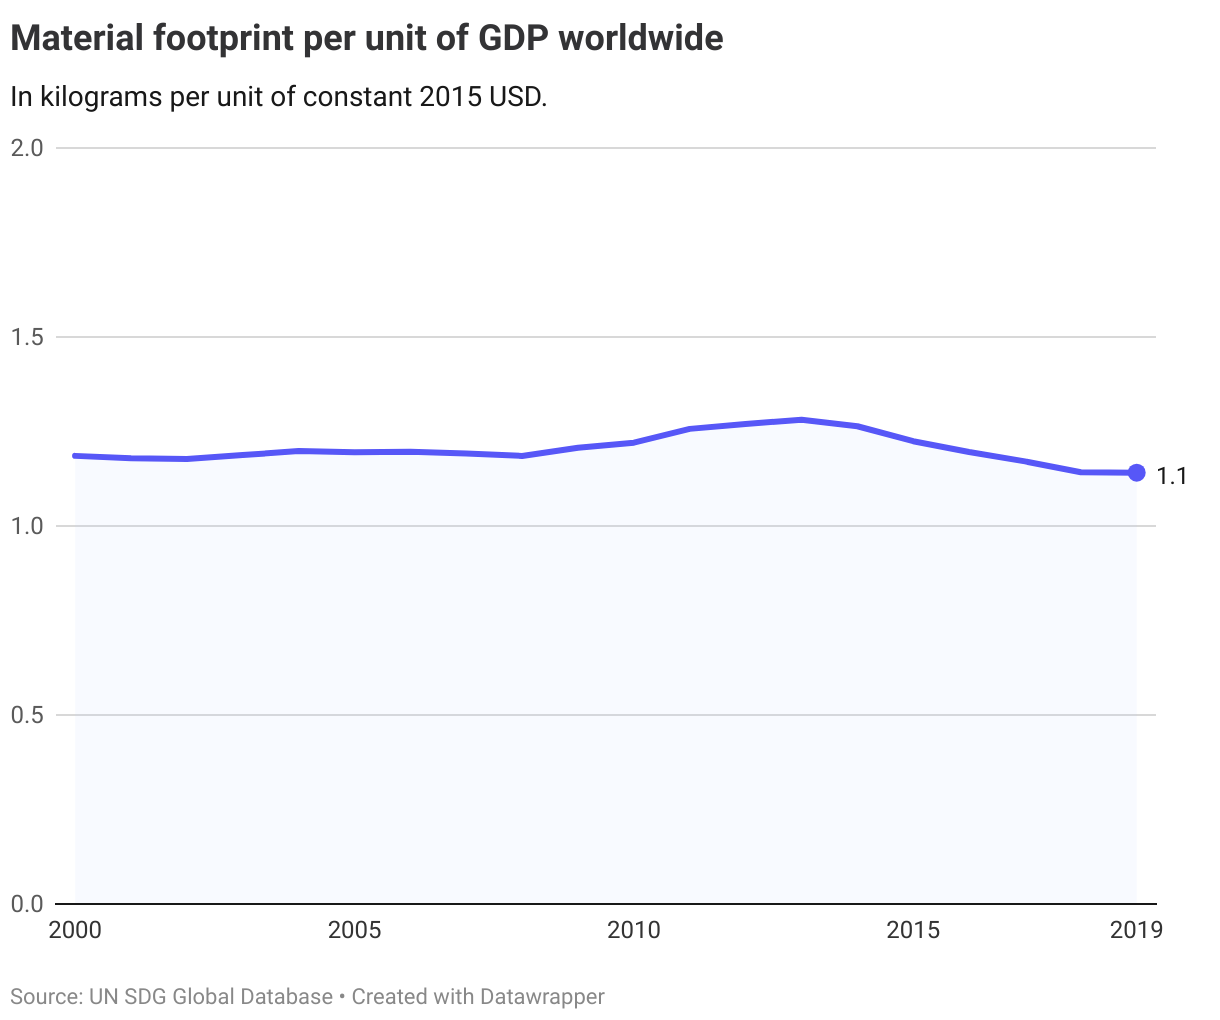
Over the same time period, material footprint per capita has increased by over 30% to 12,4 tonnes (global average) in 2019, which underscores that at the moment there is world is not moving towards improved global resource efficiency.

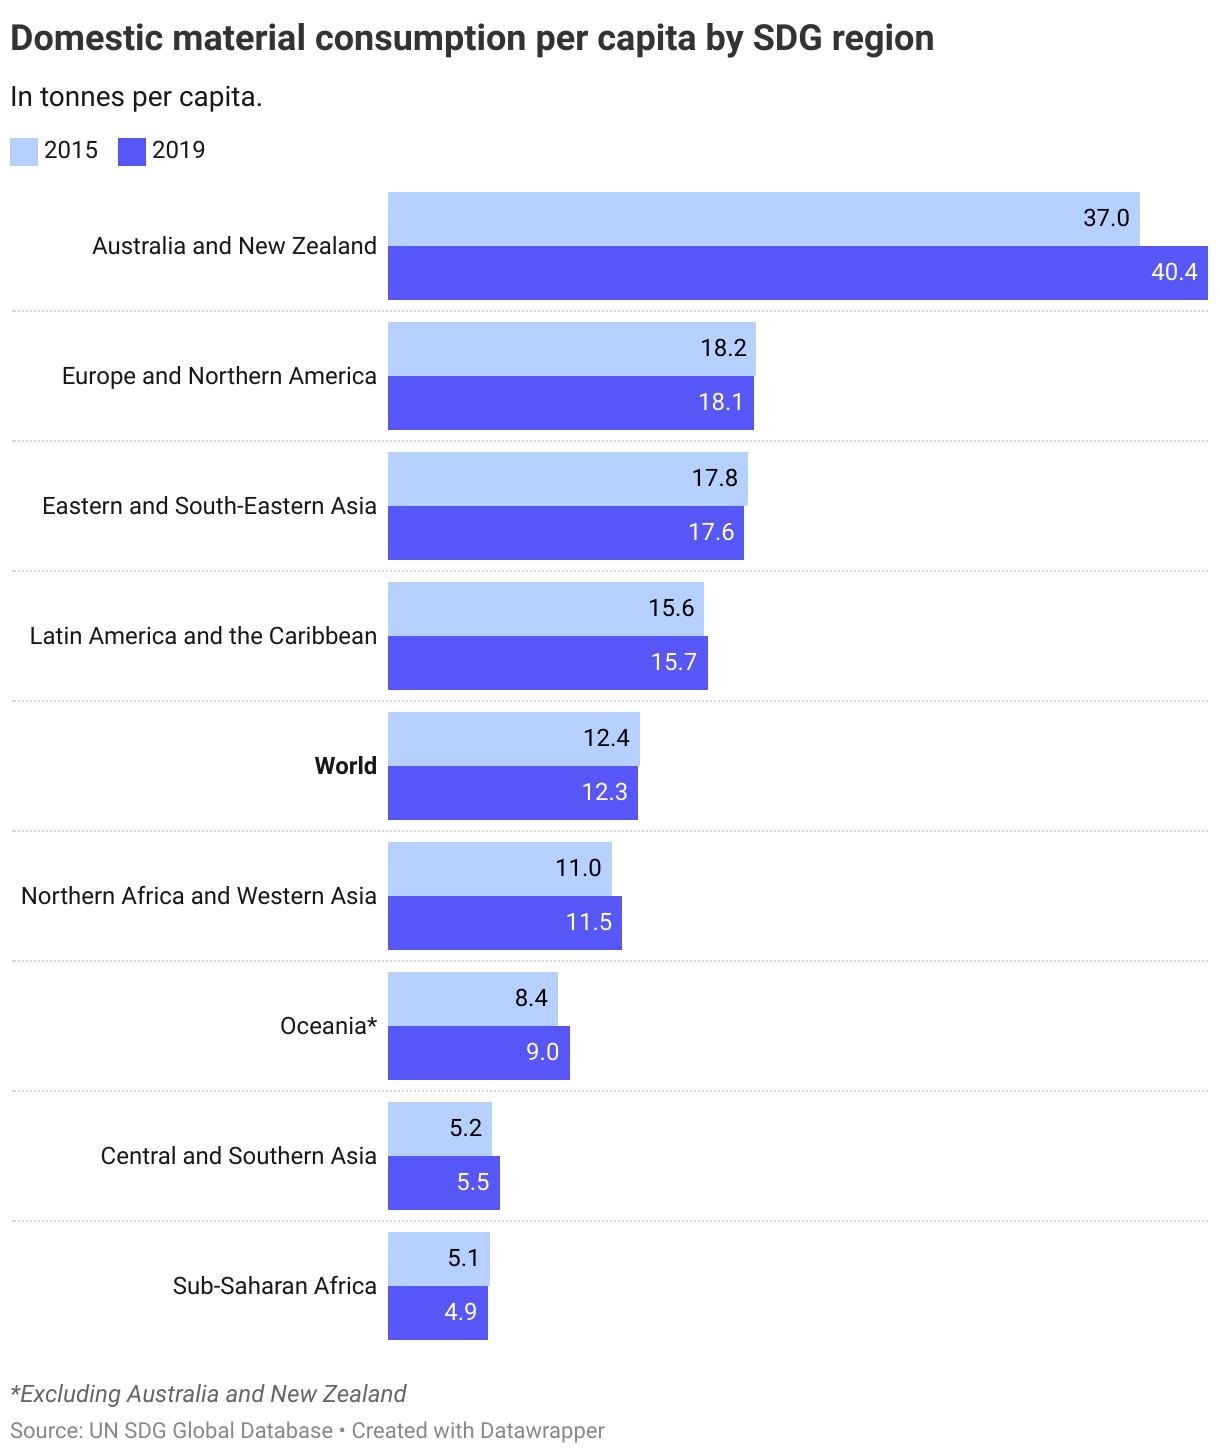
12.2.2 Domestic material consumption
While the first indicator looks at the material footprint at the global level, the second indicator looks at domestic material use. It thus takes into account direct material use inside a country's territory (as well as any direct material imports and exports).
The latest data comparing 2019 with 2015, shows that material productivity has improved slightly worldwide, i.e. less domestic material consumption per unit of wealth produced.
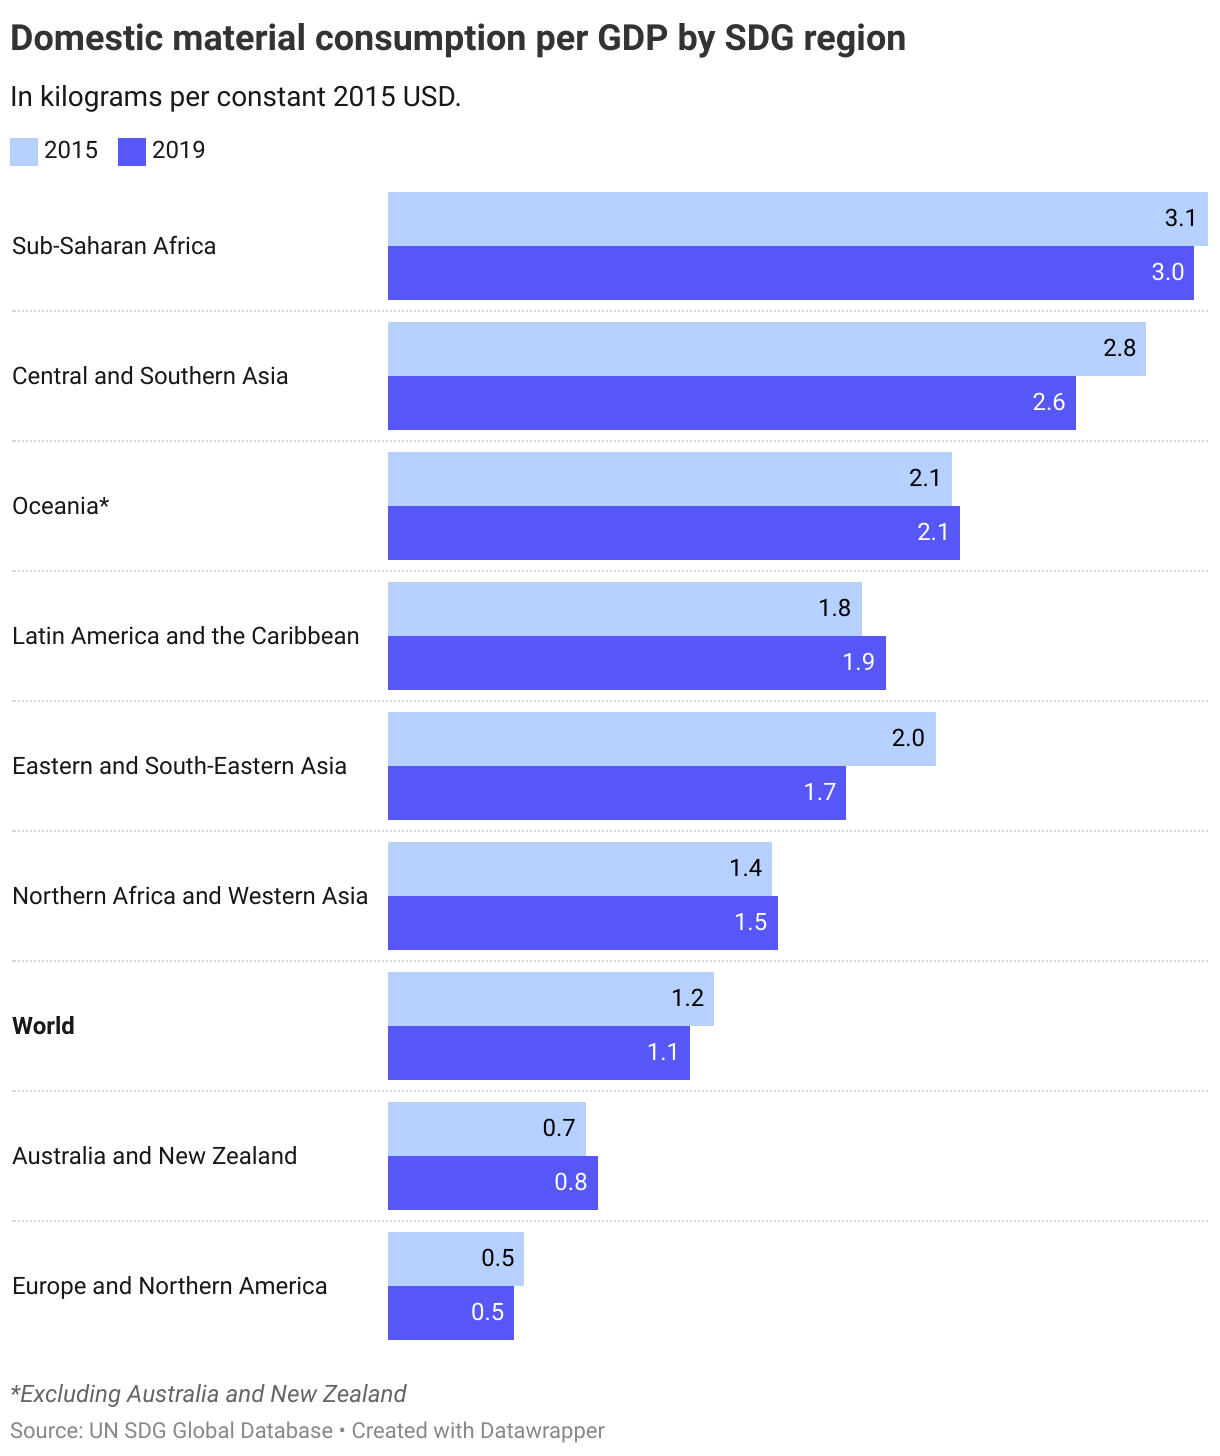
Despite improved material productivity, when measured per capita/per person, the global country-average domestic consumption is more or less unchanged since 2015.
The Nordics
Although the goal is to progressively improve global resource efficiency, there is currently no agreed target level set for 2030 on the indicators discussed above. The OECD has therefore operationalised the target for OECD-countries as the level of domestic material consumption of the top four performers in 2015 which was 0.143 kg per unit of GDP. The most recent data shows that none of the Nordic countries is at or below this level, with Iceland currently the closest.
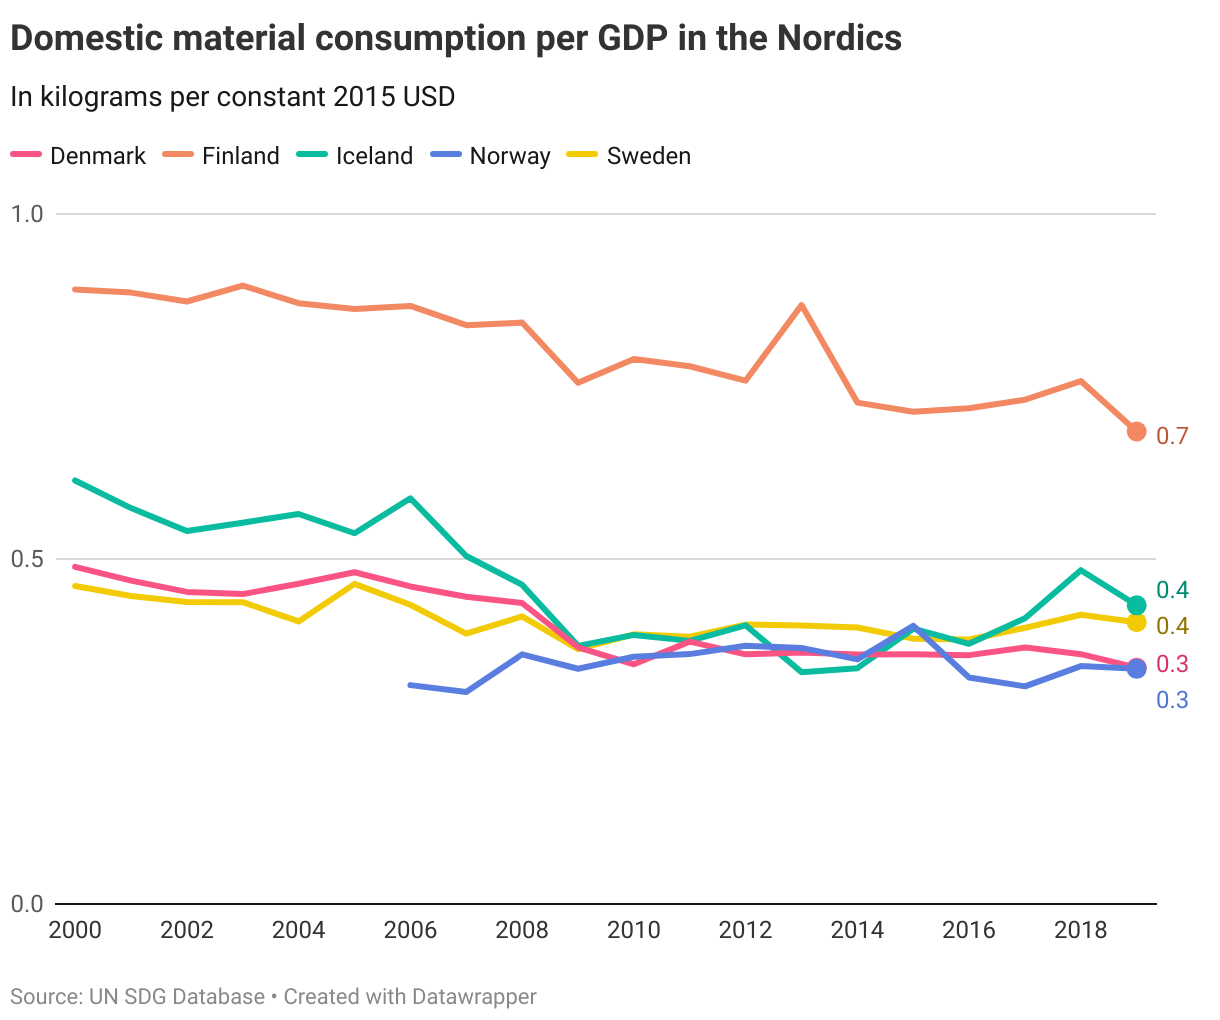
Overall, Denmark, Iceland, Norway and Sweden are at a short distance to the target (less than 0.5 OECD standard deviations away). Finland is at a long distance but is making progress.
Denmark
Short distance to target
Finland
Long distance to target but progressing
Iceland
Short distance to target
Norway
Short distance to target
Sweden
Short distance to target
Target 12.3
By 2030, halve per capita global food waste at the retail and consumer levels and reduce food losses along production and supply chains, including post-harvest losses
| 12.3.1 | (a) Food loss index and (b) food waste index |
Global trends
An estimated 13% of food is lost worldwide between harvesting and reaching retail markets. The share is approximately the same as in 2016. The largest food losses occur in Sub-Saharan Africa, where over 20% of food was lost before reaching markets. Food loss can be impacted by inefficiencies at the farm level, during transportation and storage, and during processing and wholesaling.
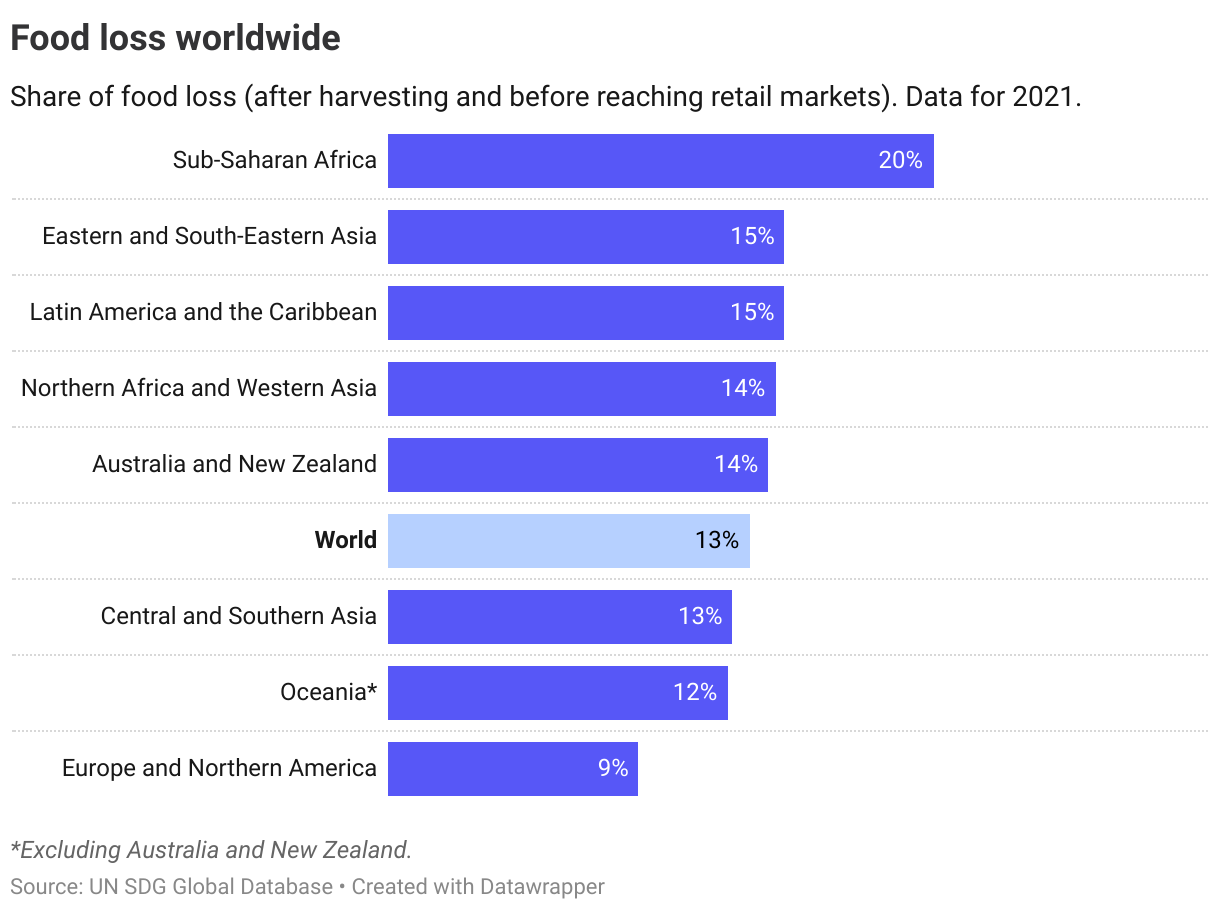
While "food loss" concerns what happens before food reaches consumers, "food waste" looks at how much food is discarded once after it has reached household, food service and retail levels. Data on food waste is sparse, but the UN has estimated that around 17% of food is wasted, with the majority of the waste (60%) happening at the household level.
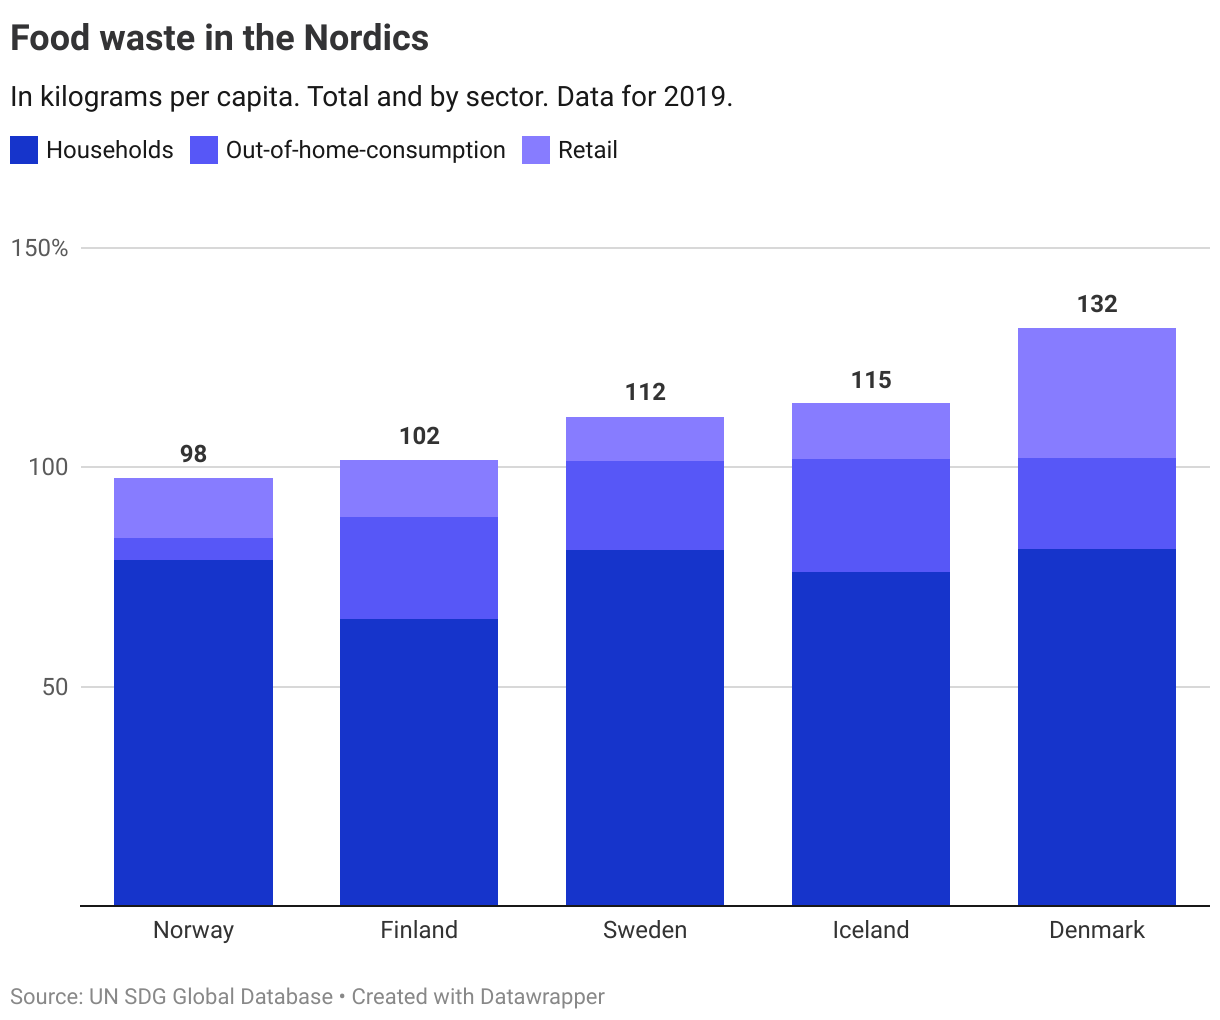
The Nordics
Data on food waste per capita for the Nordics shows that Denmark has the highest level, at a total of 132 kg in 2019, with Norway the lowest at 98 kg per capita. The OECD has operationalised the target for 2030 as 38 kg per capita at the household level, 13 at the food service level (out-of-home-consuption) and 6 for the retail level.
Currently, Norway is the only country that has achieved any of these target levels, recording 5 for the food service level in 2019. However, that the OECD cautions in the interpretation of data on food waste, noting that less than one-fifth OECD estimates are high-conficence estimates. For the Nordics, only Denmark and Sweden are listed in this group. As such, no overall assessment of progress is performed on this indicator.
Target 12.4
By 2020, achieve the environmentally sound management of chemicals and all wastes throughout their life cycle, in accordance with agreed international frameworks, and significantly reduce their release to air, water and soil in order to minimize their adverse impacts on human health and the environment
| 12.4.1 | Number of parties to international multilateral environmental agreements on hazardous waste, and other chemicals that meet their commitments and obligations in transmitting information as required by each relevant agreement |
| 12.4.2 | (a) Hazardous waste generated per capita; and (b) proportion of hazardous waste treated, by type of treatment |
Global trends
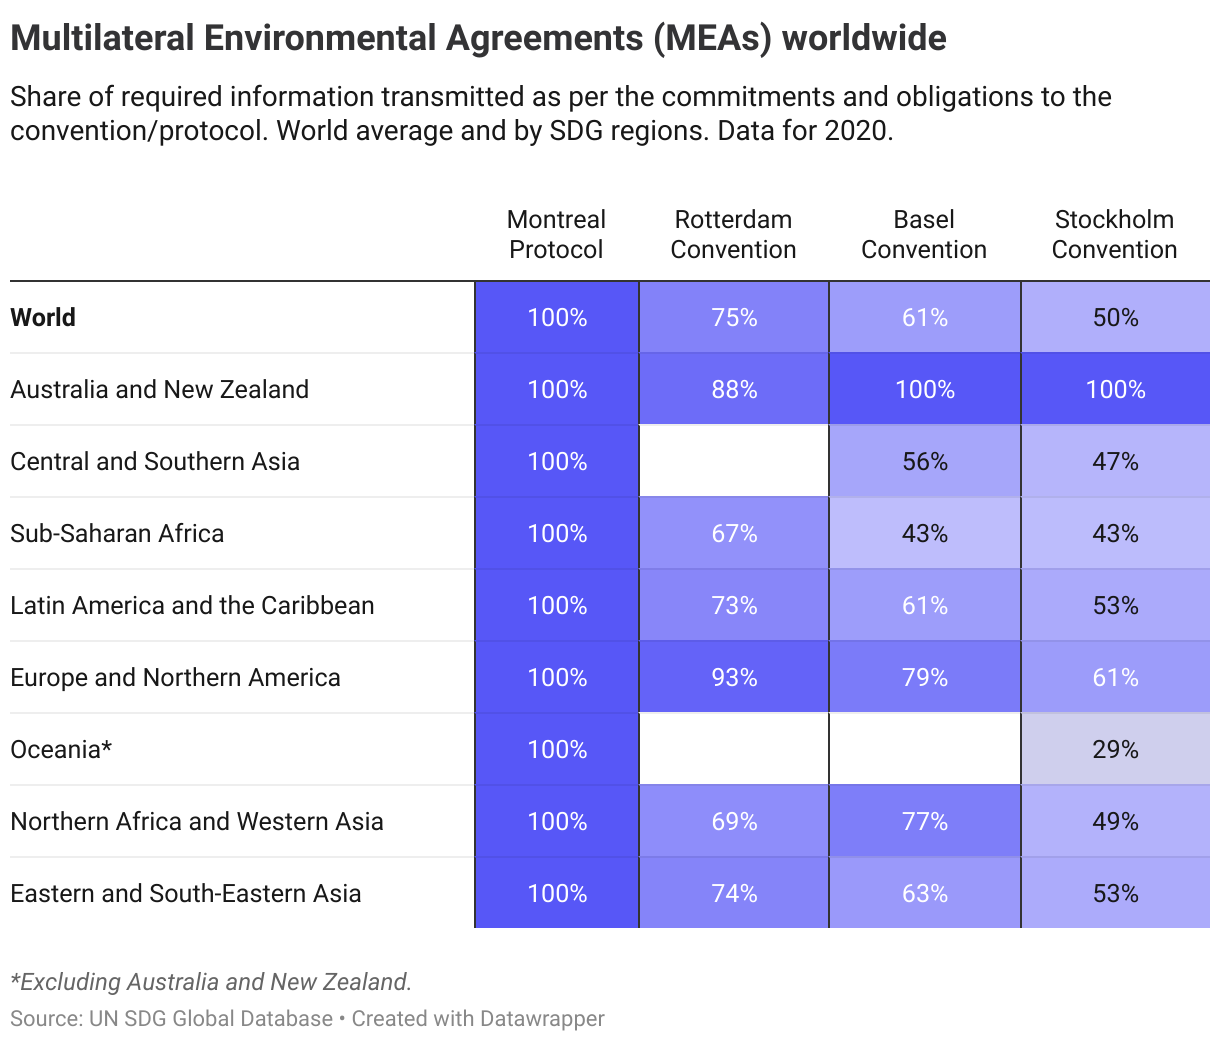
12.4.1. International environmental agreements
The first indicator measures the degree to which countries meet their commitments by transmitting data and information as required by each international agreement. Five international environmental agreements are tracked in the UN SDG indicator framework:
- The Basel Convention on the Control of Transboundary Movements of Hazardous Wastes and their Disposal (Basel Convention);
- The Rotterdam Convention on the prior informed consent procedure for certain hazardous chemicals and pesticides in international trade (Rotterdam Convention);
- The Stockholm Convention on Persistent Organic Pollutants (Stockholm Convention);
- The Montreal Protocol on Substances that Deplete the Ozone Layer (Montreal Protocol);
- Minamata Convention on Mercury (Minamata Convention),
As of 2020, the Montreal protocol had the highest score of implementation (world average), followed by the Rotterdam Convention (75%), Basel Convention (61%) and Stockholm Convention (50%). No data is available on the Minamata Convention at the world or regional level.
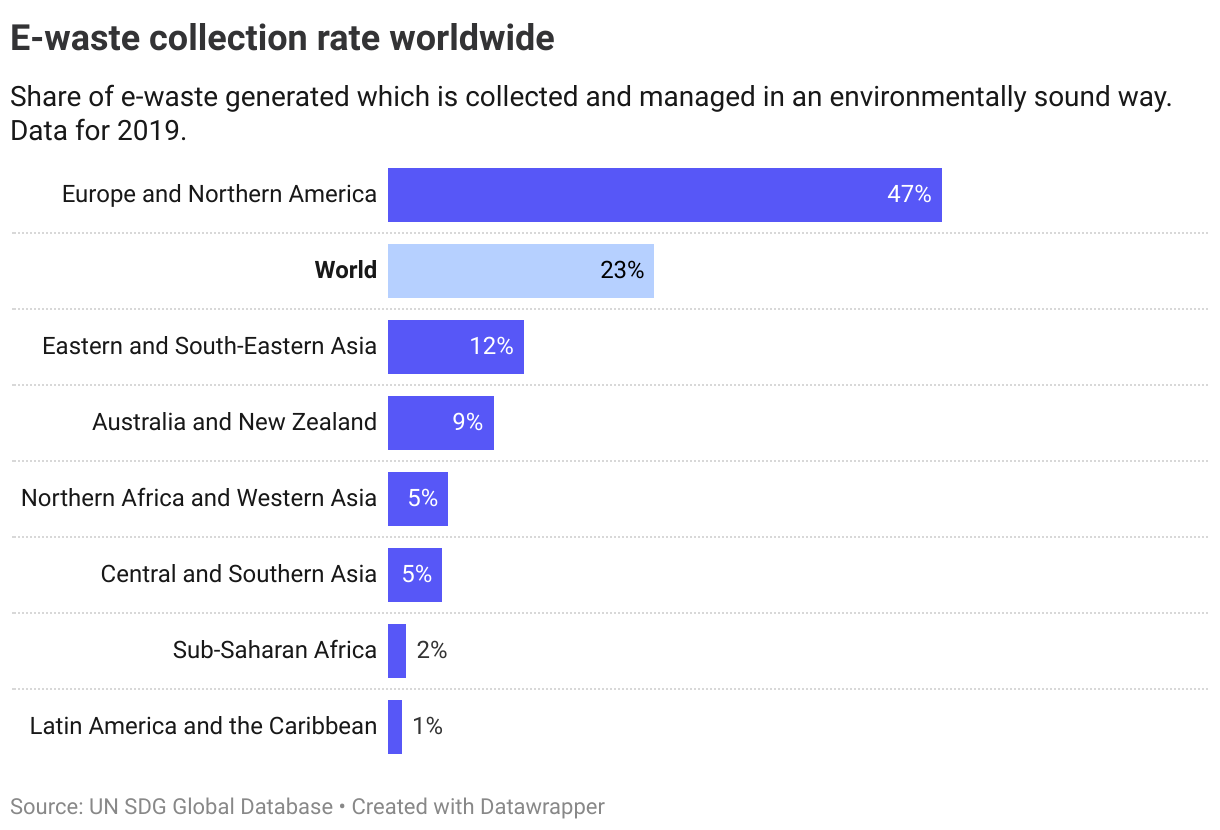
12.4.2. Hazardous waste
On the second indicator of hazardous waste, data is mainly available for e-waste at the global and regional levels. The latest data for 2019 shows that around only 23% of e-waste generated worldwide was collected and managed in an environmentally sound way. Regionally, the rate varies significantly, with almost half of all e-waste in Europe and Northern America at 47% collection rate compared to just 1% in Latin America and the Caribbean and 2% in Sub-Saharan Africa.
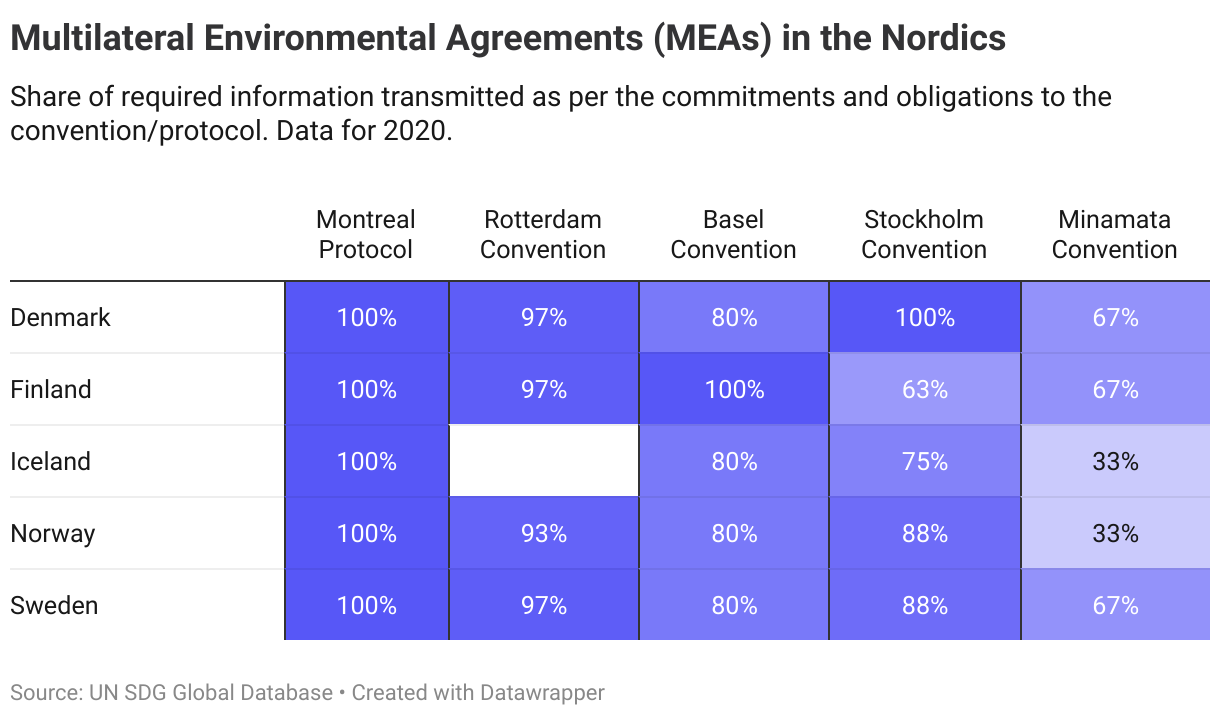
The Nordics
The latest data show a mixed picture for the Nordics with regard to the five multilateral environmental agreements (12.4.1). While all countries have high scores on the Montreal Protocol, levels are lower on the other conventions and protocols. On the Minamata Convention, none of the Nordic countries reports a 100% score.
Data on hazardous waste (12.4.2) is to be expanded, therefore no assessment of progress is made at this moment.
Target 12.5
By 2030, substantially reduce waste generation through prevention, reduction, recycling and reuse
| 12.5.1 | National recycling rate, tons of material recycled |
Global trends
As the indicator concerns the national recycling rate, data is only assessed at the national level for this indicator.
The Nordics
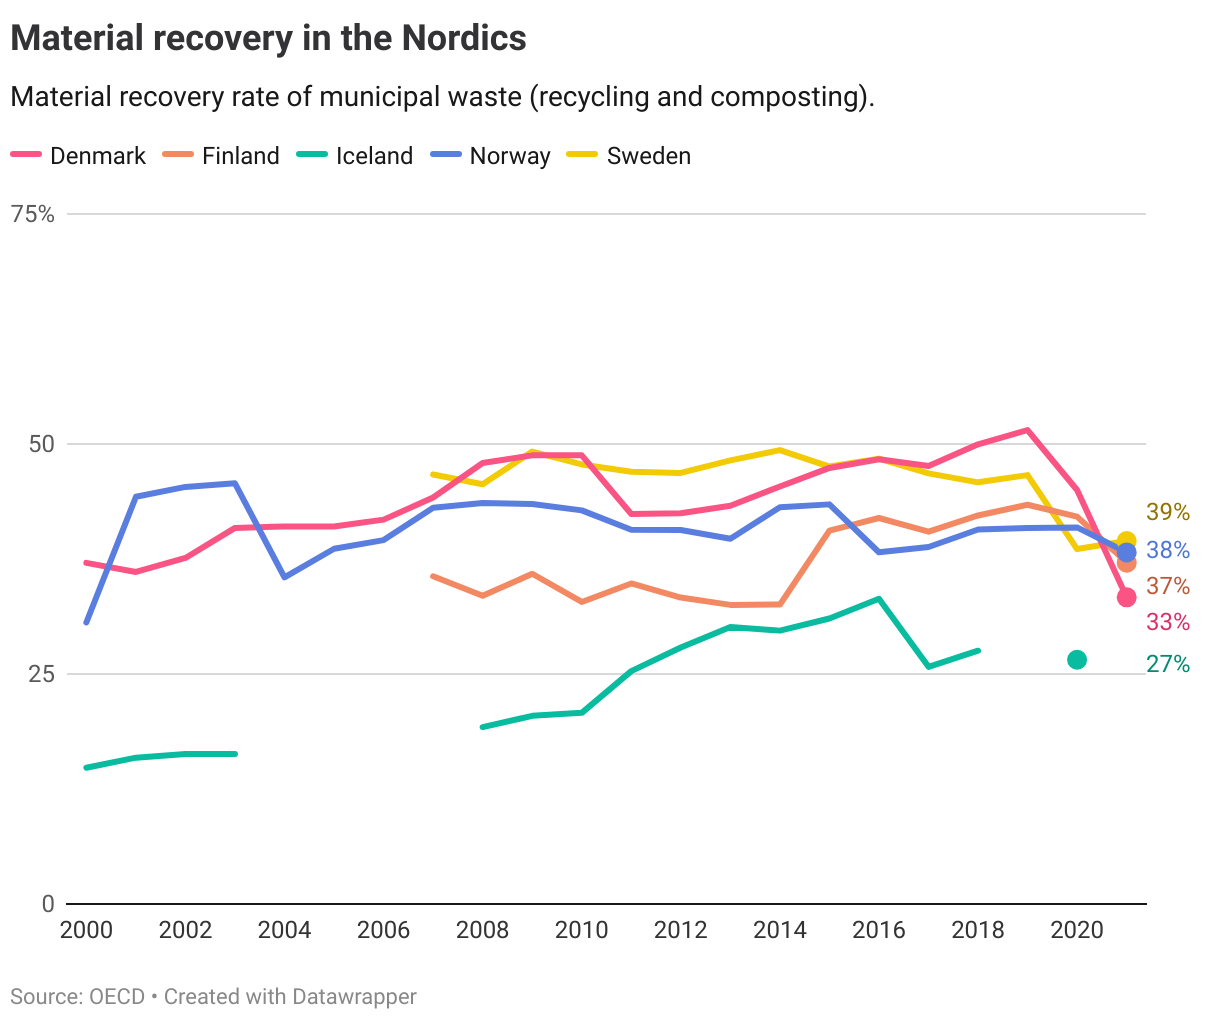
To assess the national recycling rate, the OECD uses data on the share of municipal waste generated that is recovered through recycling and composting. The 2030 target is set at 53%, which was the level of top OECD performers in 2015.
The latest data shows that all the Nordics are at a long distance from this target. While Denmark has previously been above 50%, it has moved away from the target in recent years. Still, the overall picture since 2000 is that Denmark, Finland and Iceland are making progress, despite being at a long distance.
Denmark
Long distance to target but progressing
Finland
Long distance to target but progressing
Iceland
Long distance to target but progressing
Norway
Long distance to target, not progressing
Sweden
Long distance to target, not progressing
Target 12.6
Encourage companies, especially large and transnational companies, to adopt sustainable practices and to integrate sustainability information into their reporting cycle
| 12.6.1 | Number of companies publishing sustainability reports |
Global trends
Since 2016, the number of companies publishing sustainability reports has increased significantly from around 2 600 to over 6,500 in 2021.
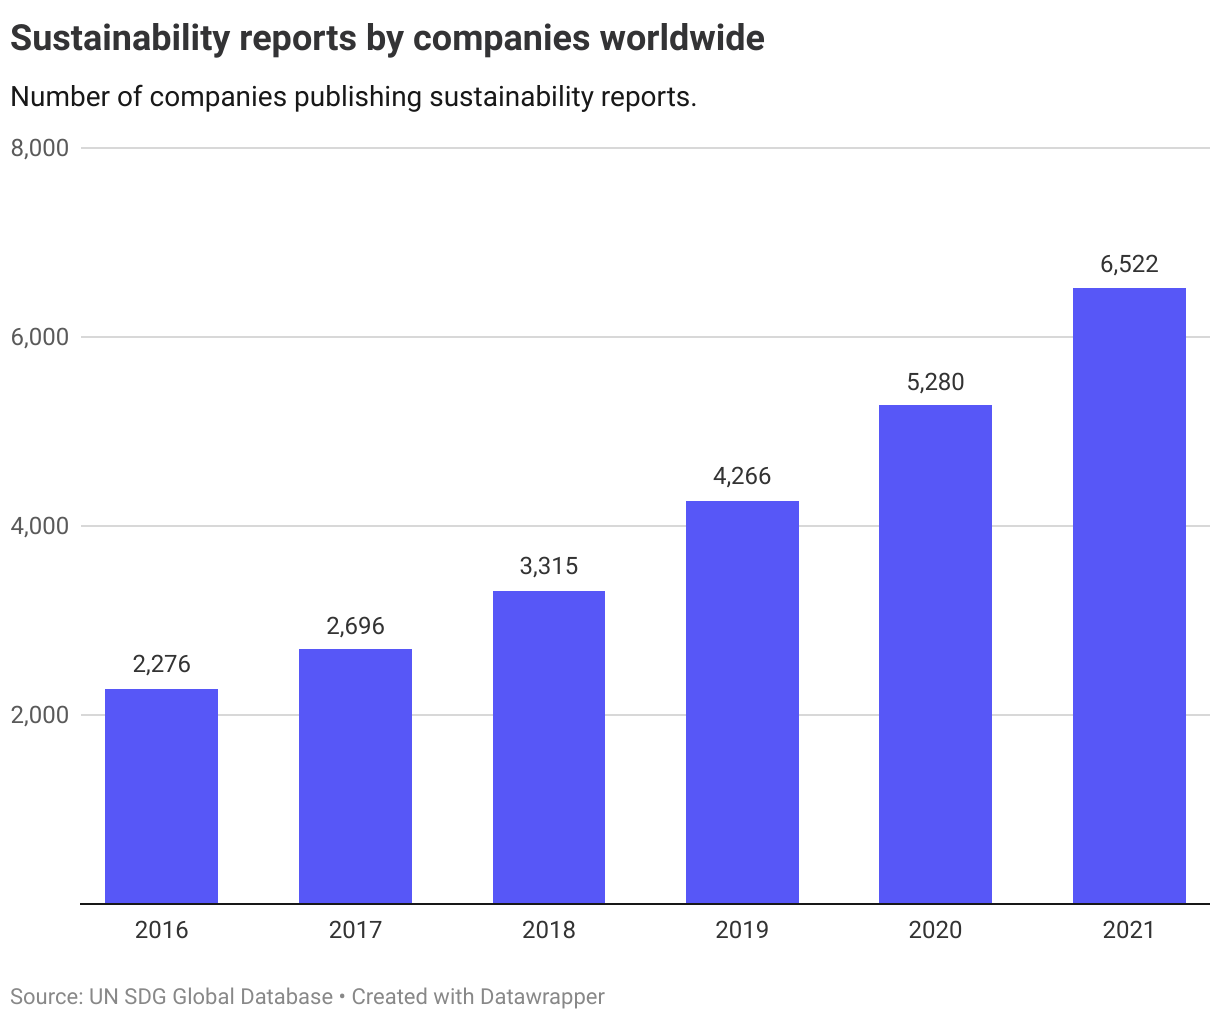
A survey by UNCTAD and UNEP of 10,000 public companies worldwide showed that 60% of large companies published sustainability reports in 2021, also more than double the share in 2016.
While an increase in absolute numbers should be interpreted as a positive development, the current indicator does not assess whether company practices are actually moving in a sustainable direction.
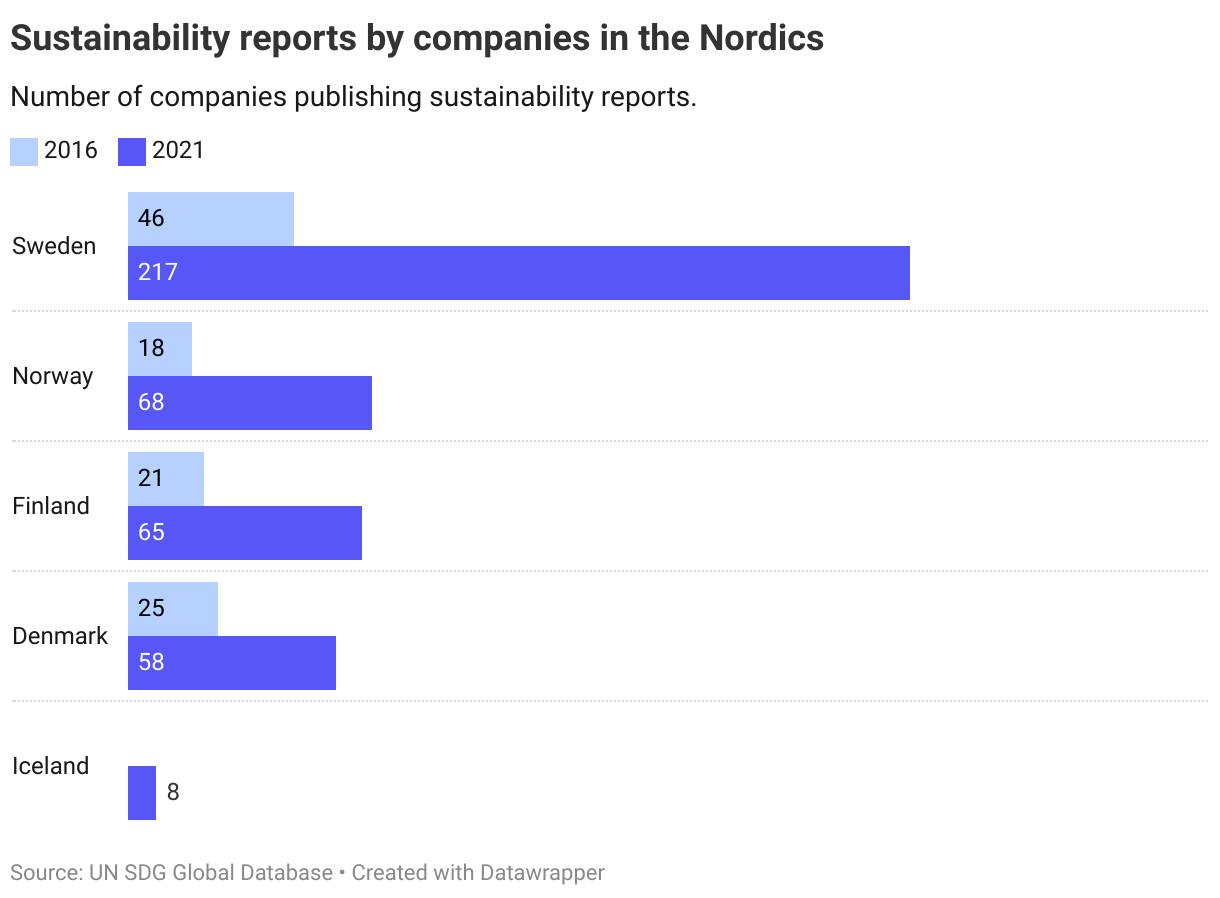
The Nordics
Data on the Nordics shows an increasing number of company reports being published. Still, as noted above, the indicator gives no insight to actual change in company practices.
Target 12.7
Promote public procurement practices that are sustainable, in accordance with national policies and priorities
| 12.7.1 | Number of countries implementing sustainable public procurement policies and action plans |
Global trends
No data is available at the global or regional level.
The Nordics
The latest UN data shows that all the Nordics, with the exception of Iceland, have implemented sustainable public procurement policies and action plans.
Denmark
Target is met
Finland
Target is met
Iceland
Long distance to target, not progressing
Norway
Target is met
Sweden
Target is met
Target 12.8
By 2030, ensure that people everywhere have the relevant information and awareness for sustainable development and lifestyles in harmony with nature
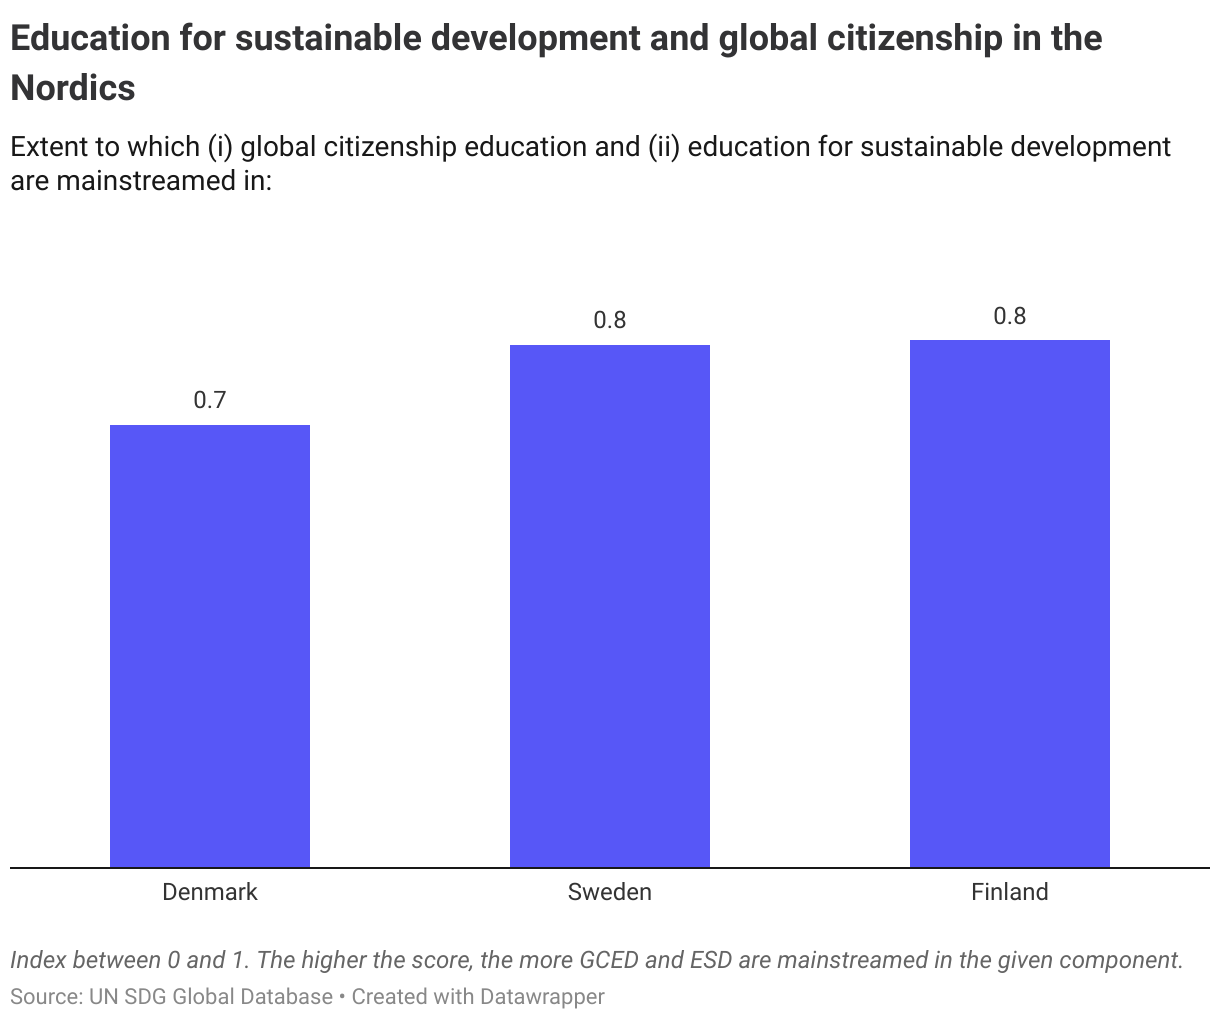
| 12.8.1 | Extent to which (i) global citizenship education and (ii) education for sustainable development are mainstreamed in (a) national education policies; (b) curricula; (c) teacher education; and (d) student assessment |
Note that the indicator is identical to the one under target 4.7.
Global trends
There is ongoing work to develop the indicator used to measure progress towards this target. Each of the four components of the indicator (policies, curricula, teacher education, and student assessment), are measured by a range of criteria which taken together are given a score between 0 and 1, where 1 entails full mainstreaming of the Global Citizenship Education (GCED) and Education for Sustainable Development (ESD). As of 2022, no data is currently available at the global or regional level.
The Nordics
At a Nordic level, Denmark, Finland and Sweden took part in the first round of measuring this indicator (2017-2020). The data showed that as of now, only Sweden has fully mainstreamed GCED and ESD into their national education policies.
Given the lack of data over time, no trend assessment is given for this indicator. New data is set to be released during 2024.
Target 12.a
Support developing countries to strengthen their scientific and technological capacity to move towards more sustainable patterns of consumption and production
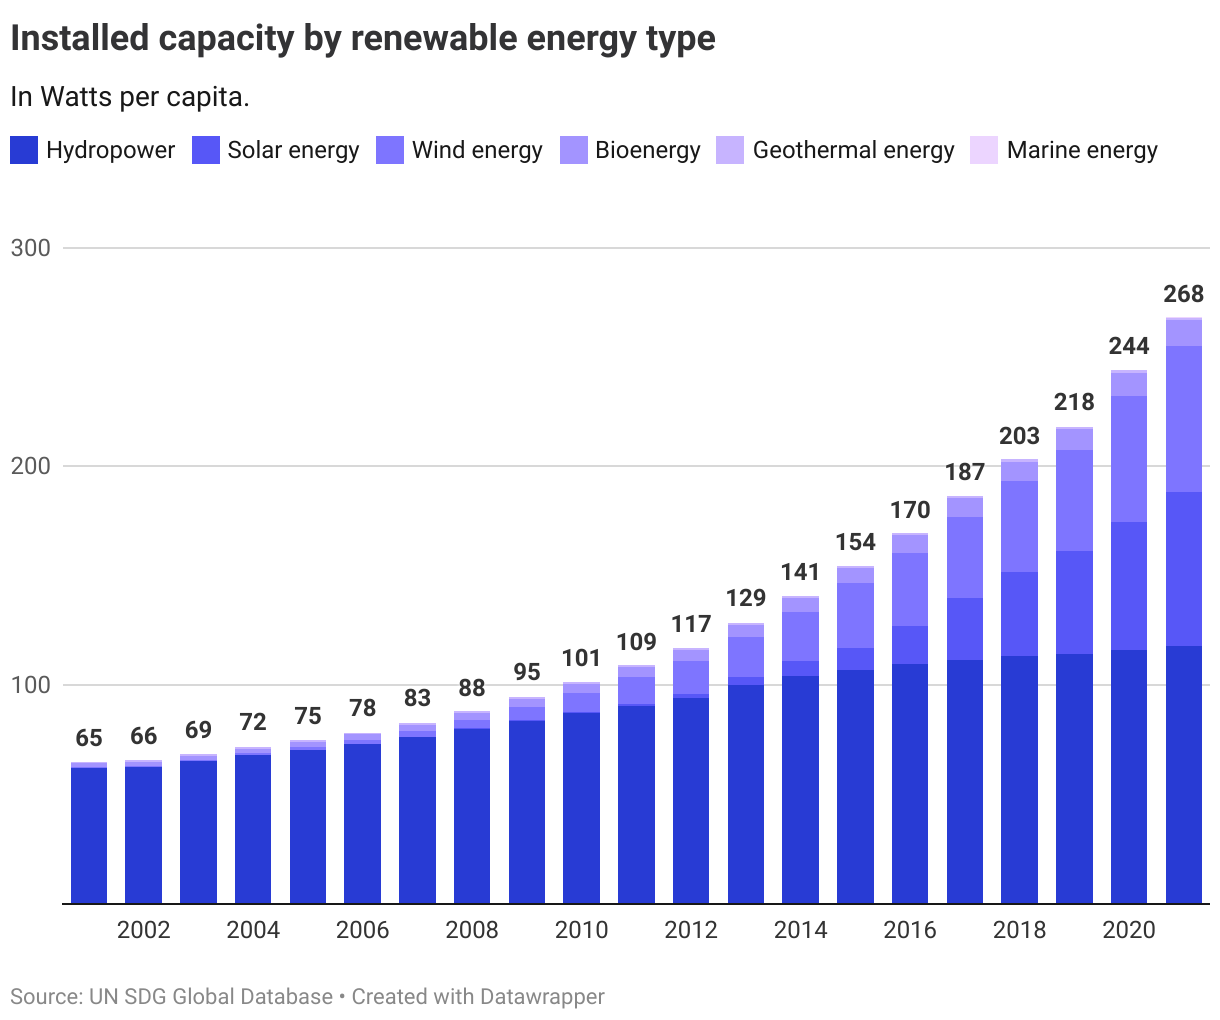
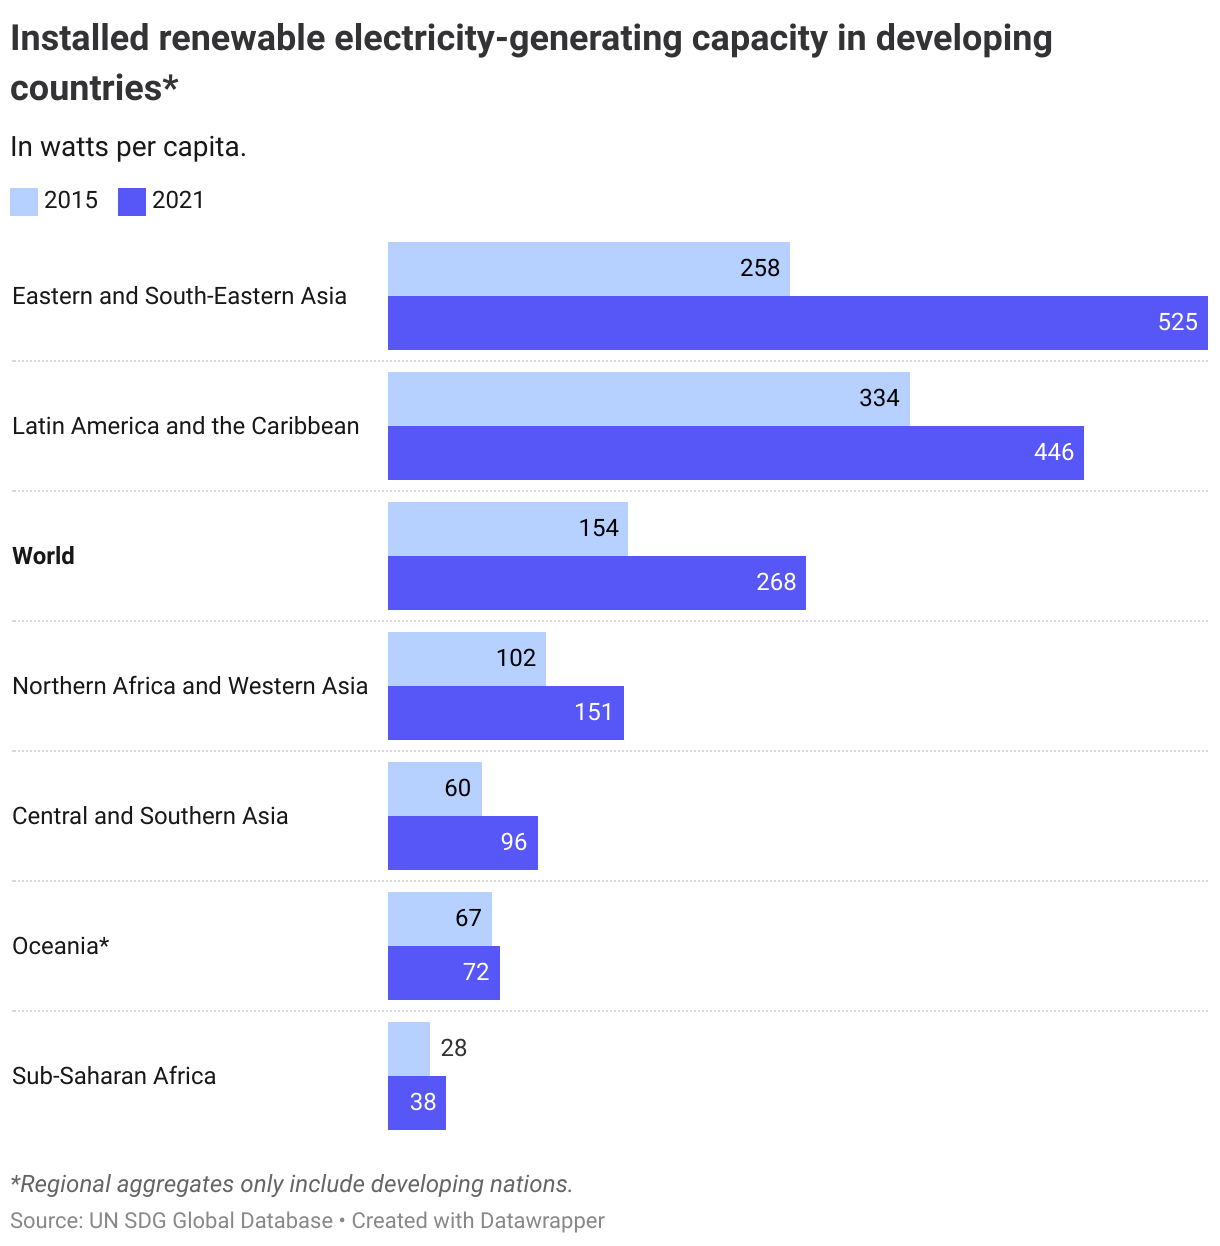
| 12.a.1 | Installed renewable energy-generating capacity in developing countries (in watts per capita) |
Note that the indicator is identical to the one under target 7.b.
Global trends
Renewable capacity in developing countries reach close to 246 Watts per capita in 2020, reaching 36% of total energy-generating capacity in developing countries. Hydropower has been the dominant renewable over the past two decades, yet over the past years growth in hydropower capacity has stalled, with solar and wind accounting for most of the increase. Renewable capacity has expanded in all regions, with the highest increase since 2010 occurring in Eastern and South-Eastern Asia.
The Nordics
Target not applicable for the Nordic countries.
Target 12.b
Develop and implement tools to monitor sustainable development impacts for sustainable tourism that creates jobs and promotes local culture and products
| 12.b.1 | Implementation of standard accounting tools to monitor the economic and environmental aspects of tourism sustainability |
To be expanded. Current data availability seems to be impacted by the pandemic, with a sharp decline in countries reporting data.
Target 12.c
Rationalize inefficient fossil-fuel subsidies that encourage wasteful consumption by removing market distortions, in accordance with national circumstances, including by restructuring taxation and phasing out those harmful subsidies, where they exist, to reflect their environmental impacts, taking fully into account the specific needs and conditions of developing countries and minimizing the possible adverse impacts on their development in a manner that protects the poor and the affected communities
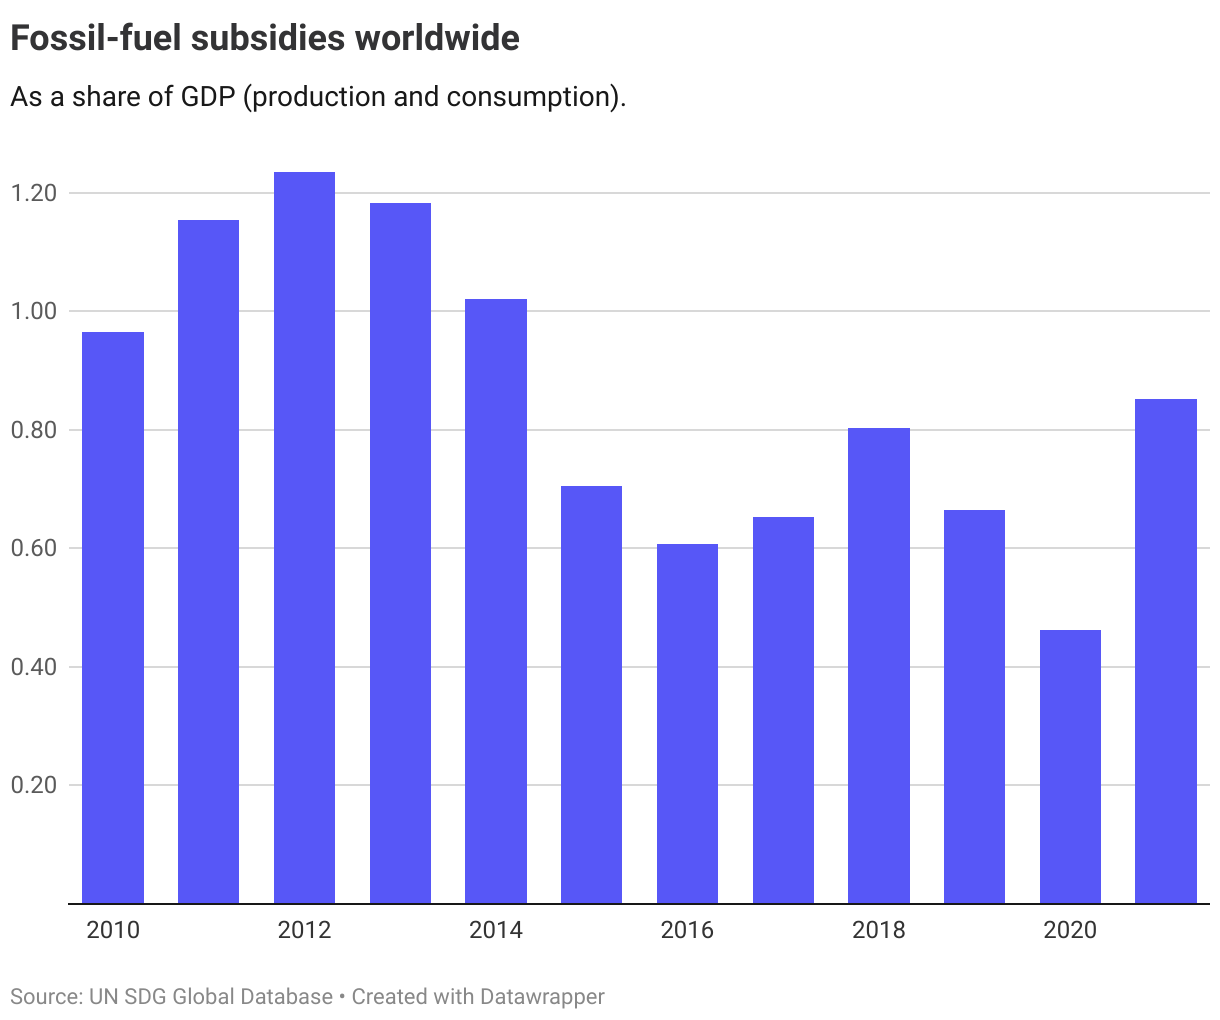
| 12.c.1 | Amount of fossil-fuel subsidies (production and consumption) per unit of GDP |
Global trends
Before the pandemic, governments spent over $500 billion USD on subsidies and other support for fossil fuels, amounting to around 0.67% of the total world GDP. From 2019 to 2020 the amount declined sharply to 0.46% of the total world GDP. However, the UN noted in last years SDG progress report that this decline should not be interpreted as a decline in subsidy levels, but rather that:
This drop was mainly due to low oil prices and reduced demand during the pandemic rather than structural reforms. In 2021, commodity and energy prices rebounded sharply, and we are likely to see a jump in both consumption and production subsidies for fossil fuels.
Indeed, the newly released data for 2021 shows shares increasing again, reaching above pre-pandemic levels.
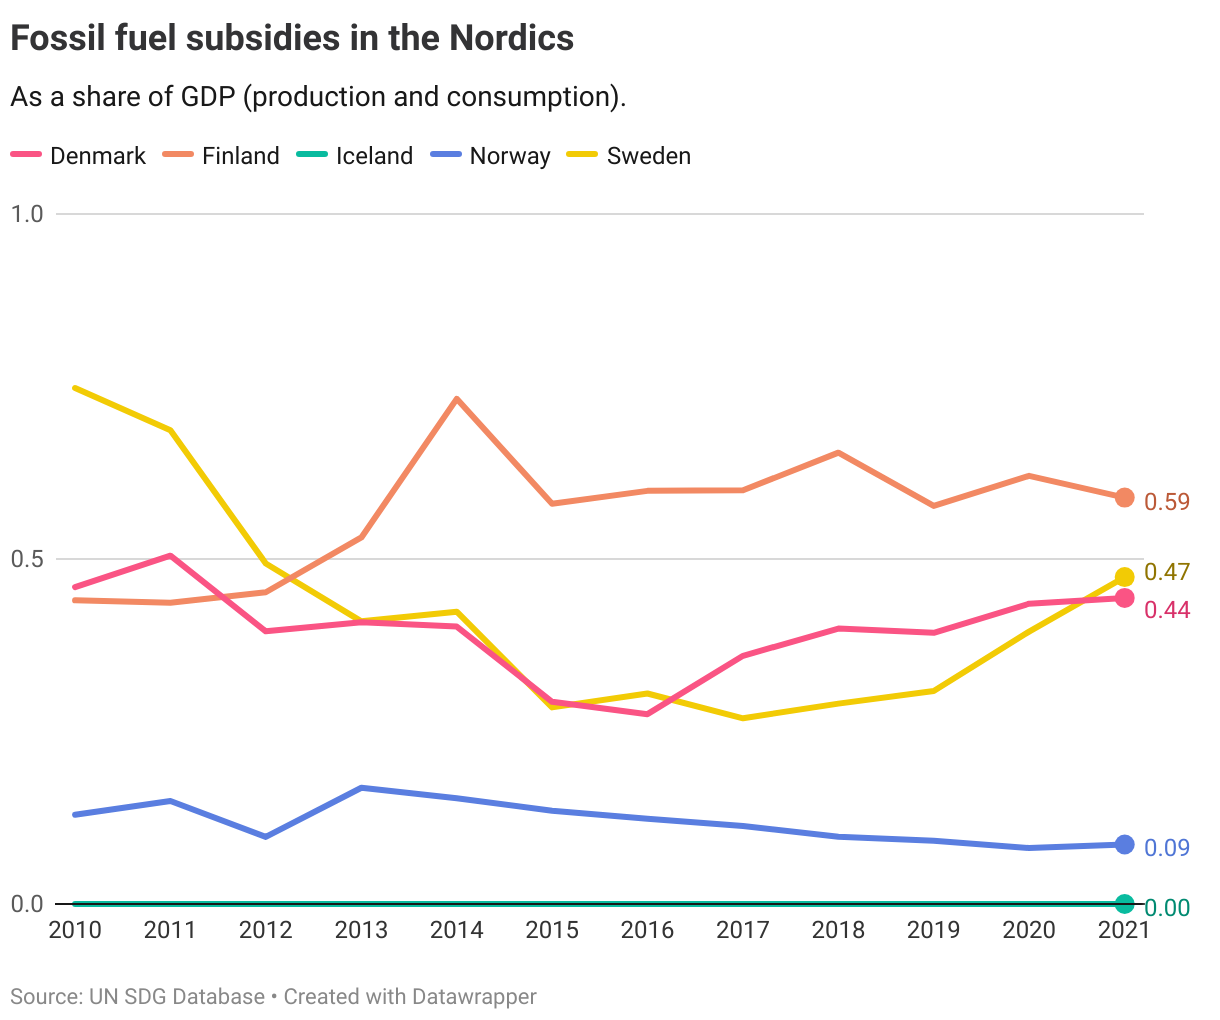
The Nordics
The below chart shows the relative levels of fossil fuel subsidies in the Nordics. However, the OECD cautions against the use of this indicator for cross-country comparisons and thus no assessment of progress is performed. This is largely related to that tax expenditure benefits are difficult to compare across countries.