Introduction
This data tracker analyses the Nordic countries’ progress towards achieving Sustainable Development Goal 3: Ensure healthy lives and promote well-being for all at all ages. The goal is comprised of 13 targets.
The Nordic countries – Denmark, Finland, Iceland, Norway and Sweden – are classified into one of five categories for each target:
Met: The country has already met the 2030 target.
On track: The country has not yet met the target but is on track to do so by 2030.
Short distance: The country has not met the target and is not projected to do so but is close to achieving it. This category also applies when the country currently meets the target but is projected to move away from it.
Long distance but progressing: The country is far from the target but is making progress towards it.
Long distance and not progressing: The country is far from the target and is not making progress towards reaching it.
Details on the methodology used, together with the overall assessment for all 17 goals, can be found on our overview page. Note that the analysis is currently work in progress.
Overall assessment of progress
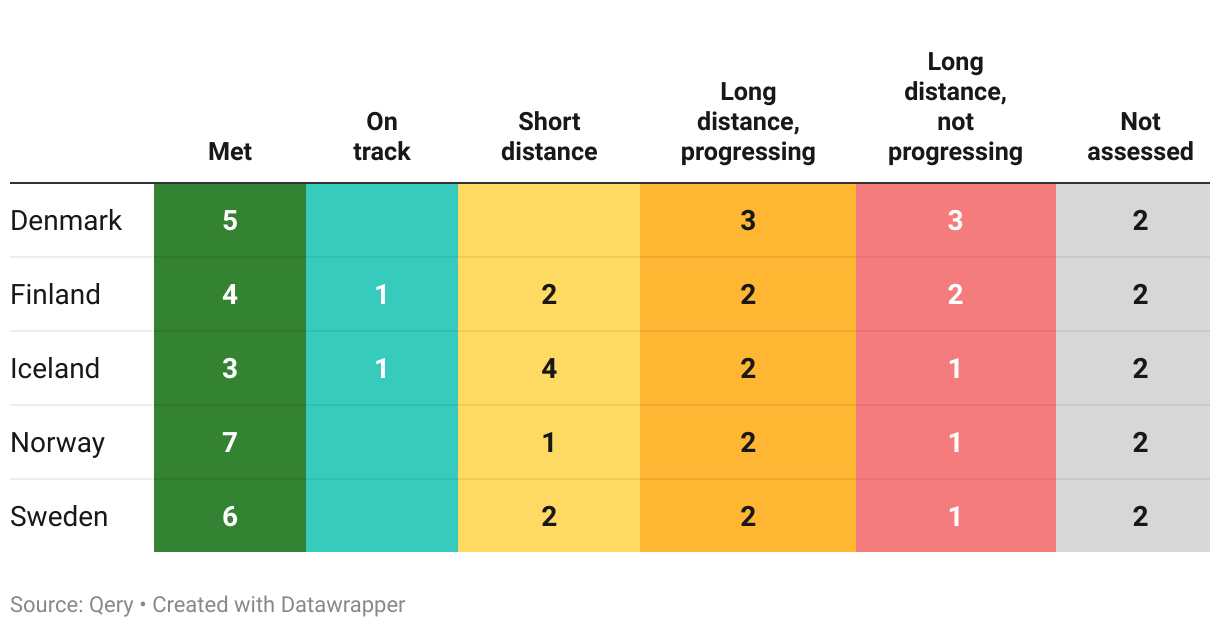
As of mid-2023, this is our assessment of the Nordic countries progress on the 13 targets part of SDG 3:
The Nordic countries’ performance on the different targets part of this goal can be explored further below. Each section follows the same structure:
- First, the official target text and related indicators is described and the latest global and regional trends are highlighted briefly.
- Second, where data is available, we then zoom in on the Nordic countries to describe how they are progressing, and assess their likelihood of achieving the target by the 2030 deadline.
- Note that both sections above strictly uses data from the UN SDG Global Database and/or the OECD.
Target 3.1
By 2030, reduce the global maternal mortality ratio to less than 70 per 100,000 live births
| 3.1.1 | Maternal mortality ratio |
| 3.1.2 | Proportion of births attended by skilled health personnel |
Global trends
3.1.1. Maternal mortality
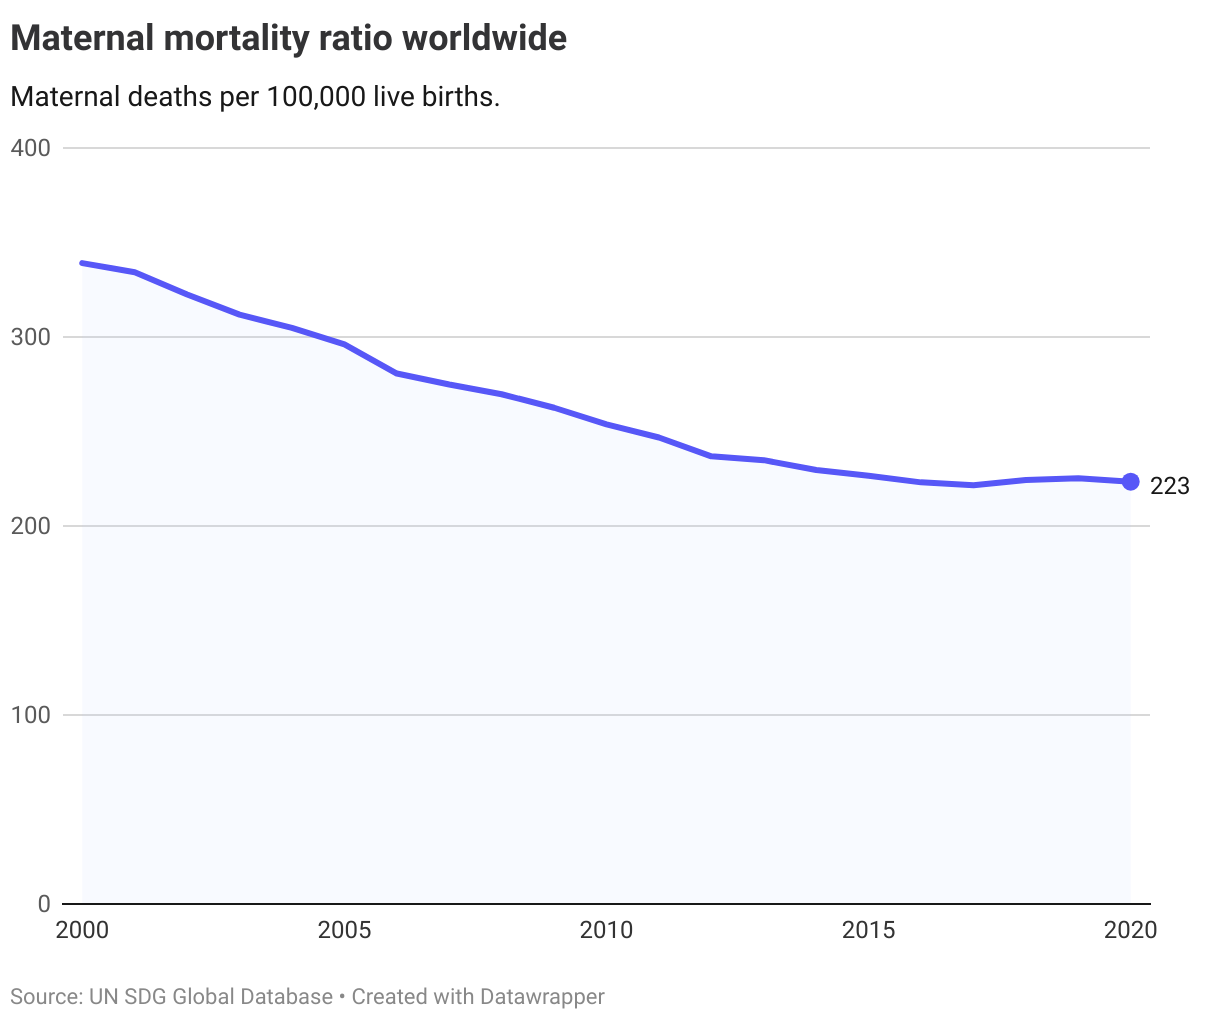
The latest figures from 2020 show that the overall global maternal mortality ratio was above 200 maternal deaths per 100,000 live births. The maternal mortality ratio has declined over the last decades, and the level in 2020 was almost a third lower than in 2000. Still, based on the current trends, with no significant decline since 2017, the target of reducing the ratio to no less than 70 per 100,000 live births by 2030 is not expected to be reached.
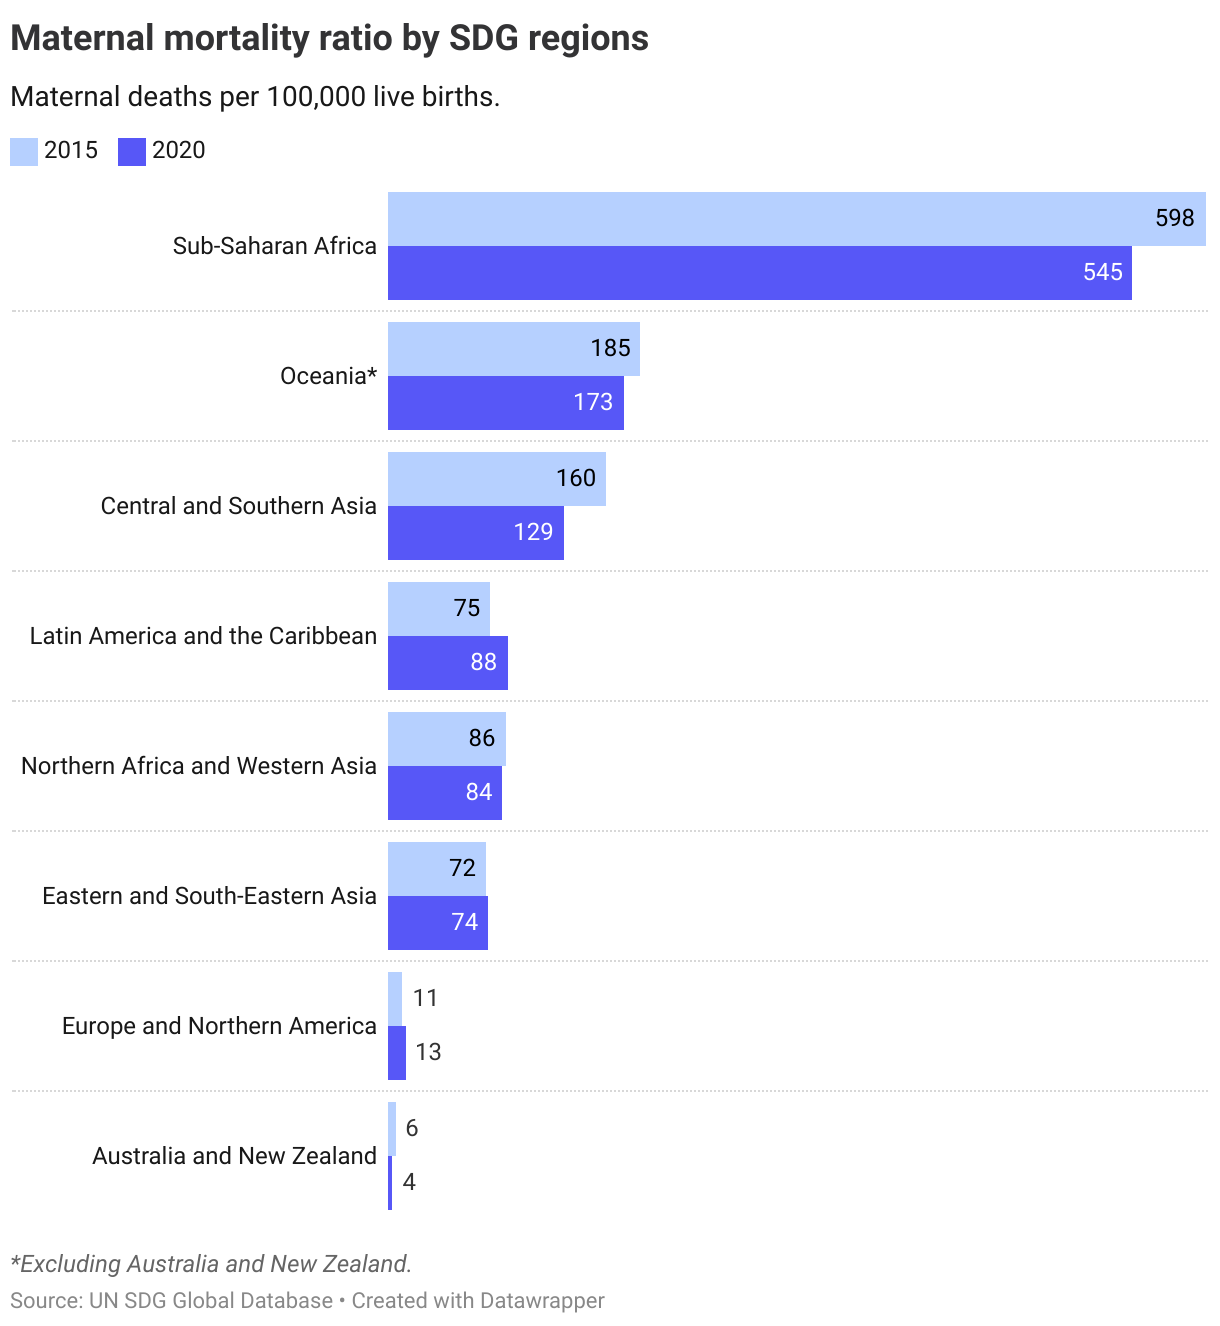
Although all regions have seen a decline in the maternal mortality ratio, the level in Sub-Saharan Africa significantly higher than in other regions, with 545 maternal deaths per 100,000 live births in 2020. Europe and Northern America as well as Oceania are the only regions below the 2030 threshold of 70 maternal deaths per 100,000 live births.
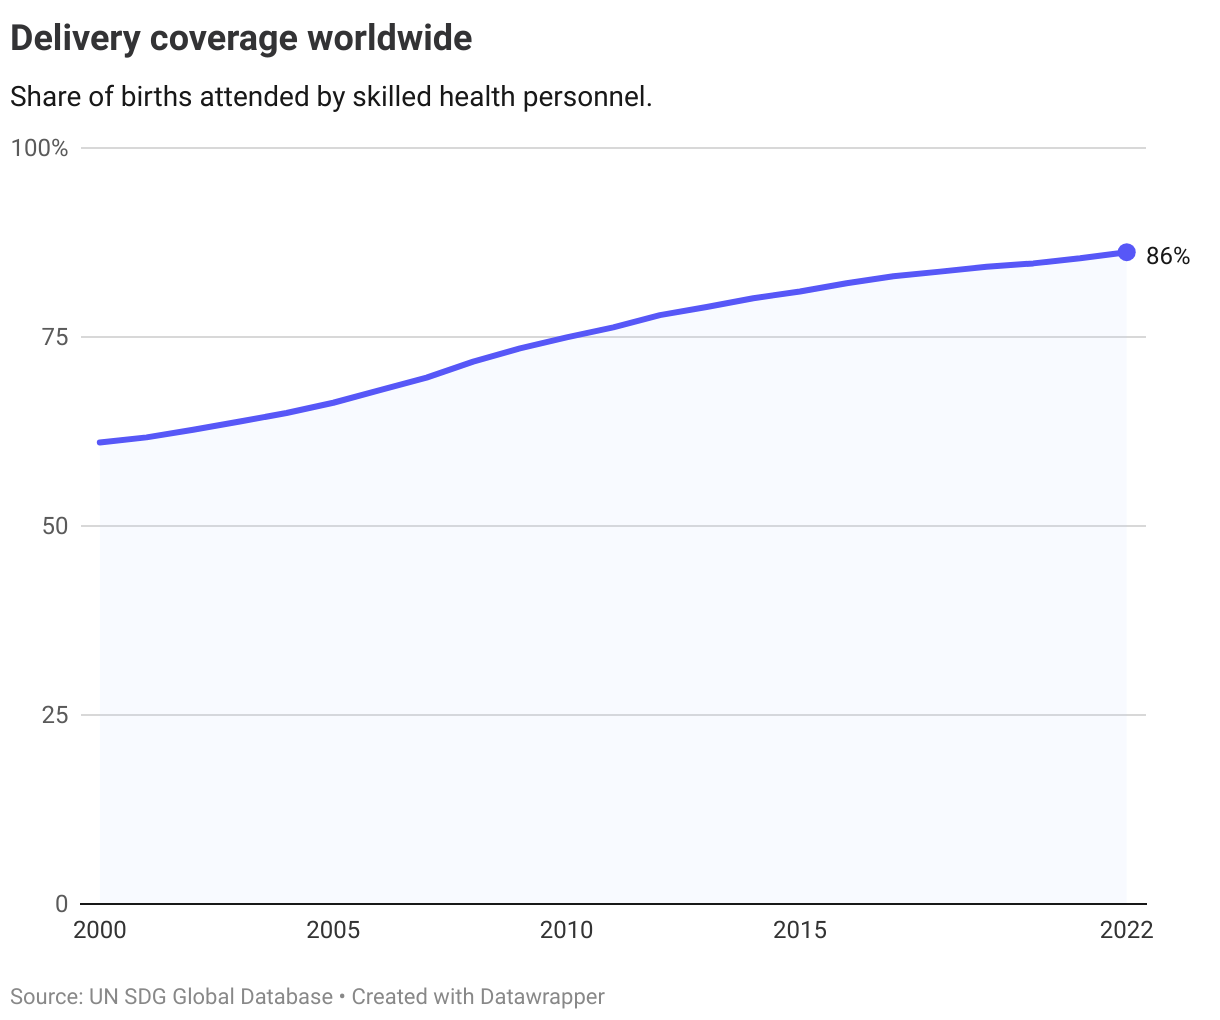
3.1.2. Delivery coverage
Globally, 86% of births in 2022 were assisted by skilled health personnel, a share that has risen steadily in recent years.
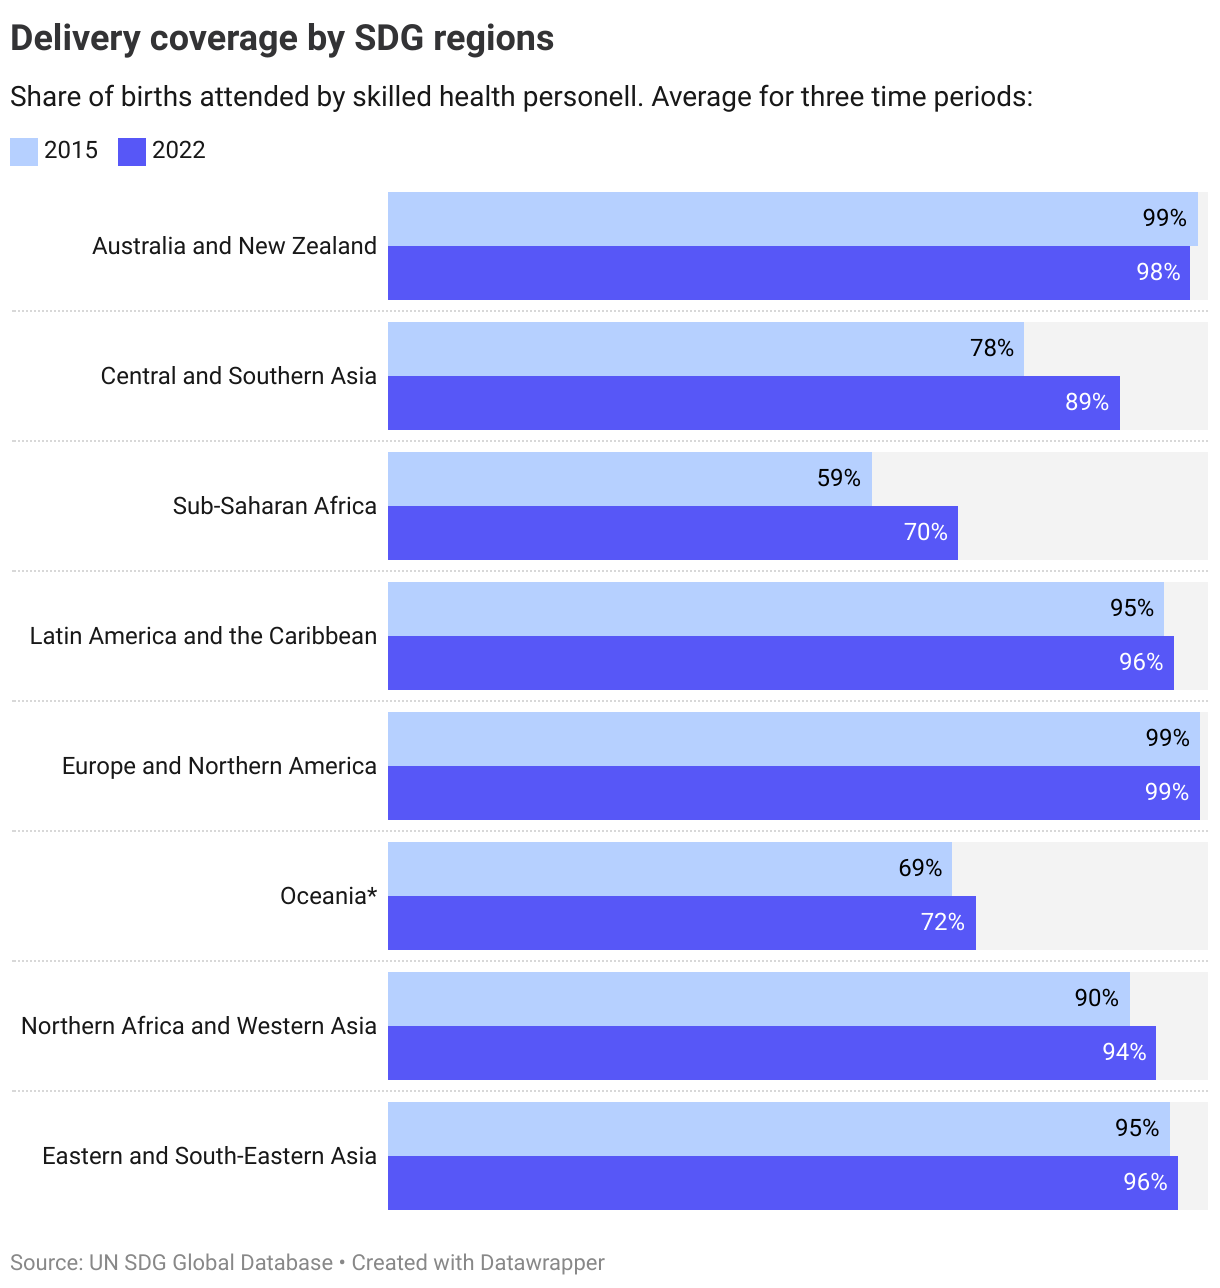
All regions have seen an increase in the share of births attended by skilled health personnel. As with the maternal mortality ratio, Sub-Saharan Africa is the region with the most challenging situation, with only 70% of births attended by skilled health personnel in 2022.
The Nordics
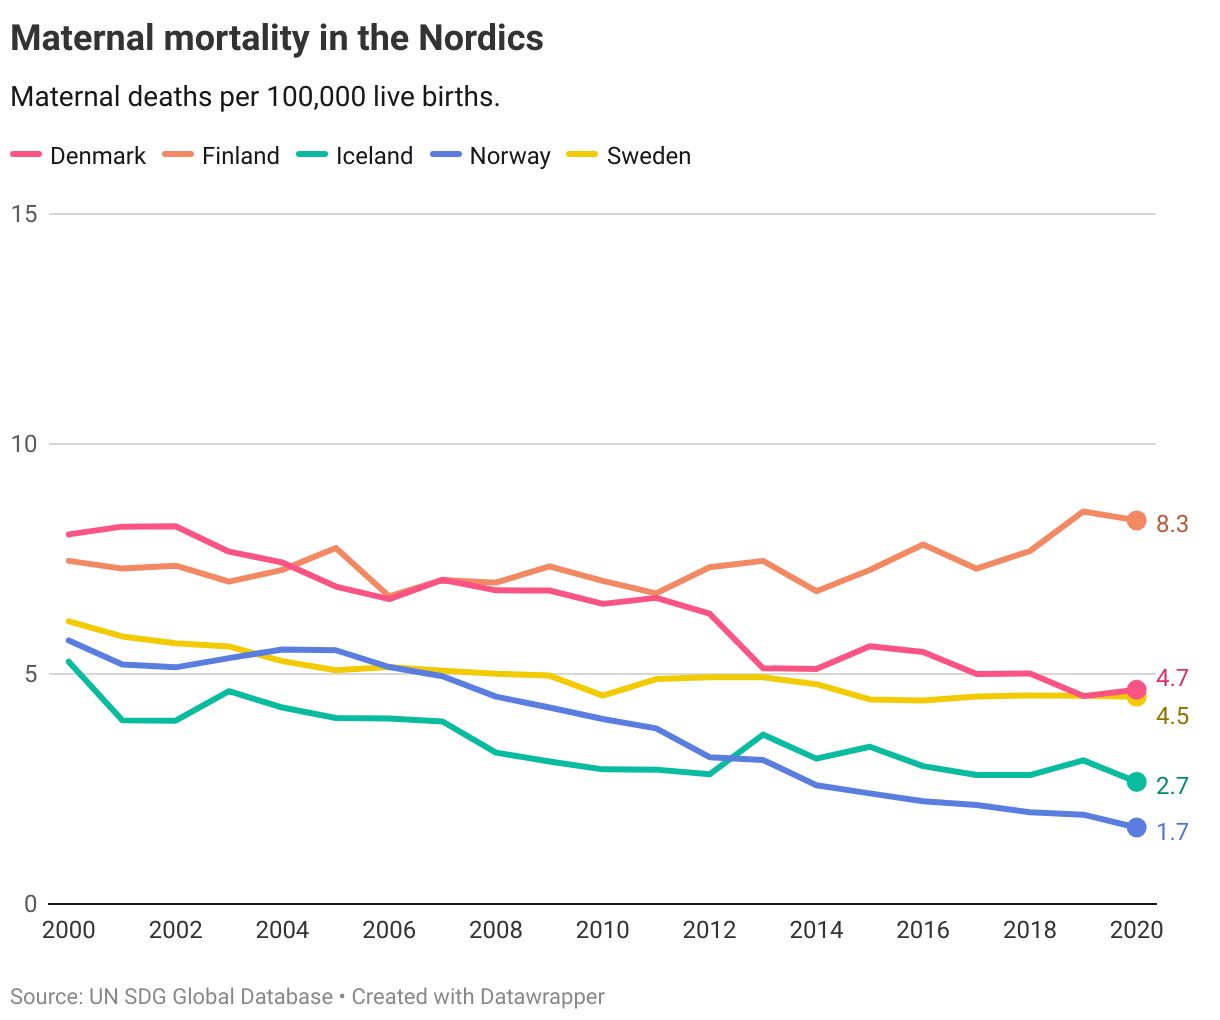
The maternal mortality ratio is very low in the Nordic countries, with the most recent data for 2020 showing all countries at around 8 or lower maternal deaths per 100,000 live births. This is below the 2030 target, and also below the average for the Europe and North America region.
Almost all births in the Nordics are attended by skilled health personnel, and delivery coverage rates range between 95 and 100. However, Denmark and Iceland have seen their coverage rate decline slightly since 2000. With the target operationalised by the OECD at 97% coverage rates, Iceland has currently met the target but trending away, while Denmark is at a long distance to target (more than 0.5 OECD standard deviations away) and trending away from it. Both countries have a low likelihood of achieving full coverage (97%) in 2030 based on current trends.
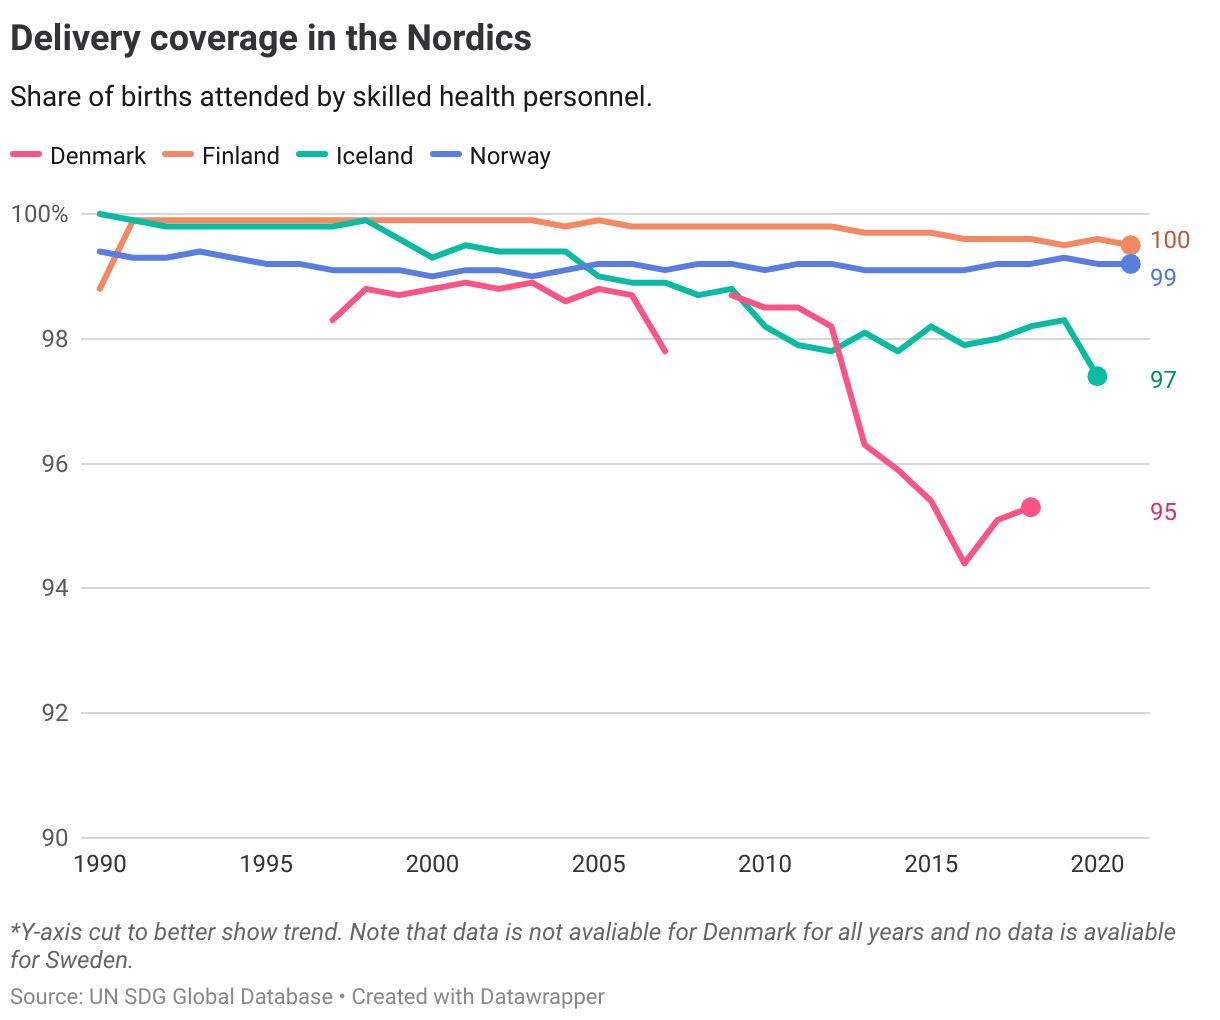
Looking at the progress made towards the two indicators combined, only Finland and Norway have met the target and are on track to achieve it in 2030. No data is available for Sweden on delivery coverage so it is only assessed based on maternal mortality where it has met the target.
Denmark
Long distance to target, not progressing
Finland
Target is met
Iceland
Short distance to target
Norway
Target is met
Sweden
Target is met
Target 3.2
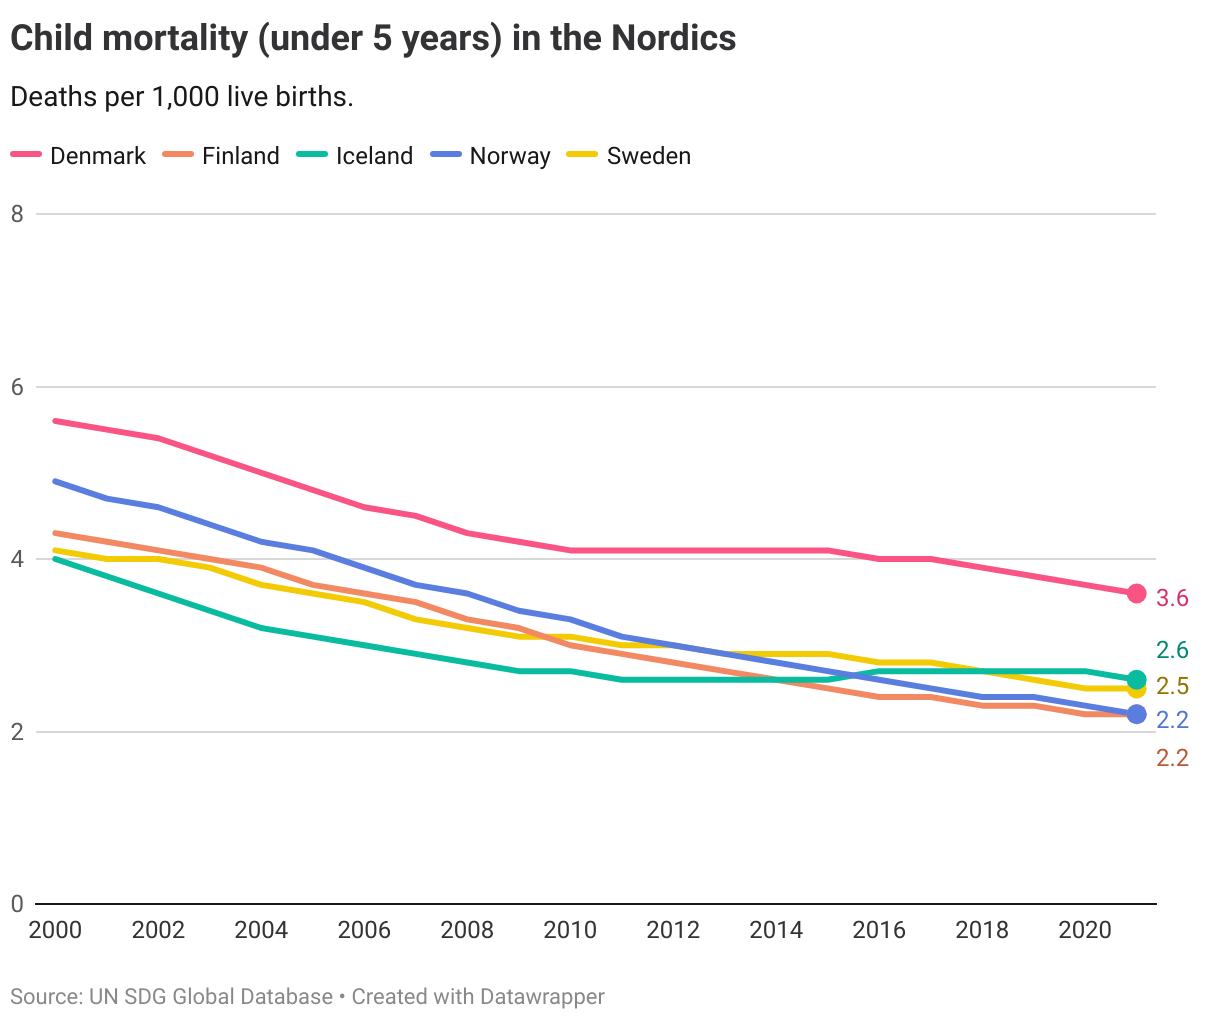
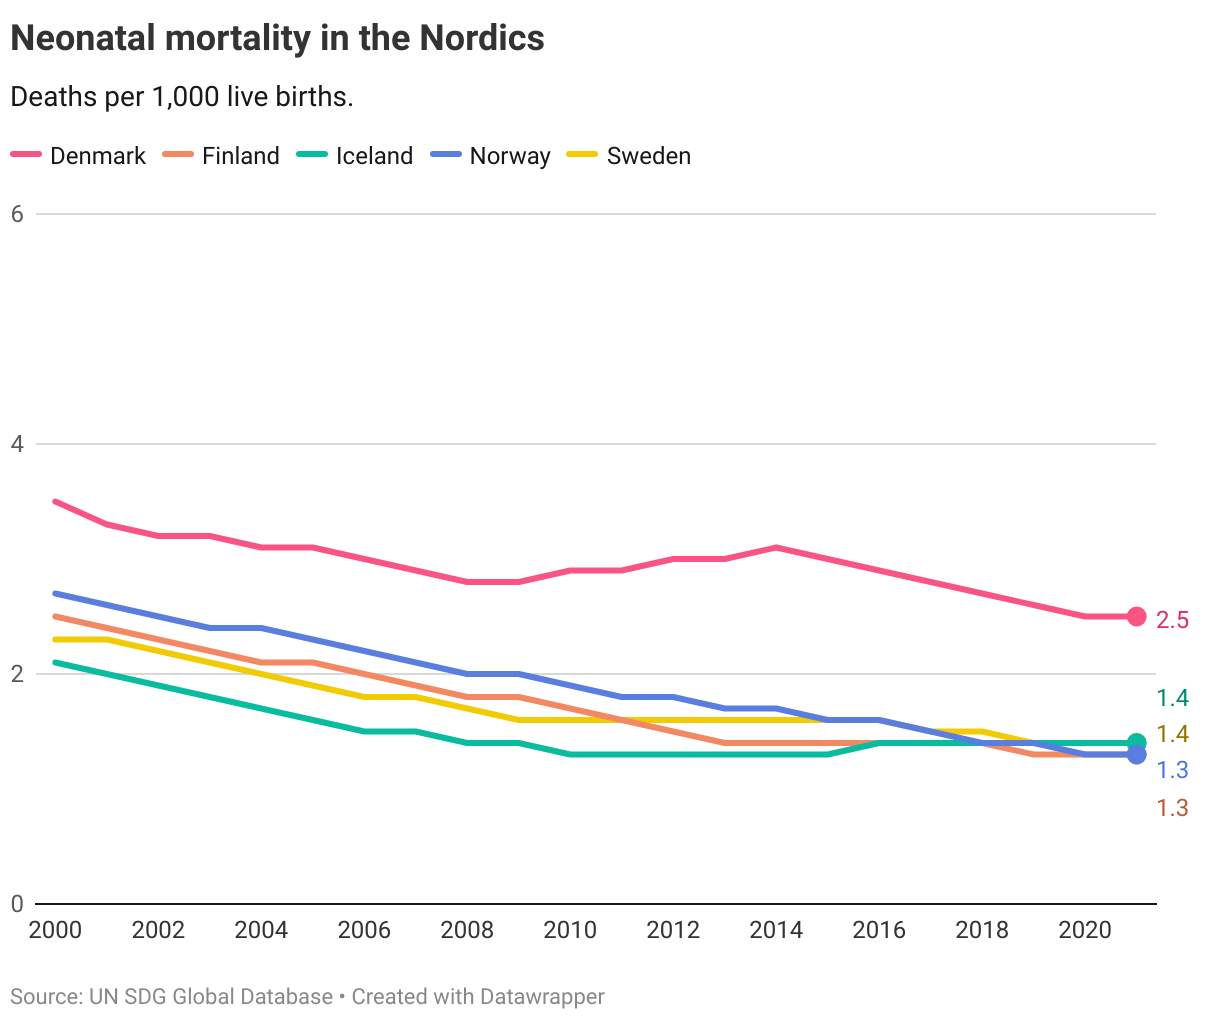
By 2030, end preventable deaths of newborns and children under 5 years of age, with all countries aiming to reduce neonatal mortality to at least as low as 12 per 1,000 live births and under-5 mortality to at least as low as 25 per 1,000 live births
| 3.2.1 | Under-5 mortality rate |
| 3.2.2 | Neonatal mortality rate |
Global trends
3.2.1. Under-5 mortality rate
Progress has been made in reducing child mortality worldwide. In 2021, the global average was 38 deaths per 1,000 live births, compared to 76 in 2000. Yet, the current level is still above the target of reducing it to under 25 deaths per 1,000 live births.
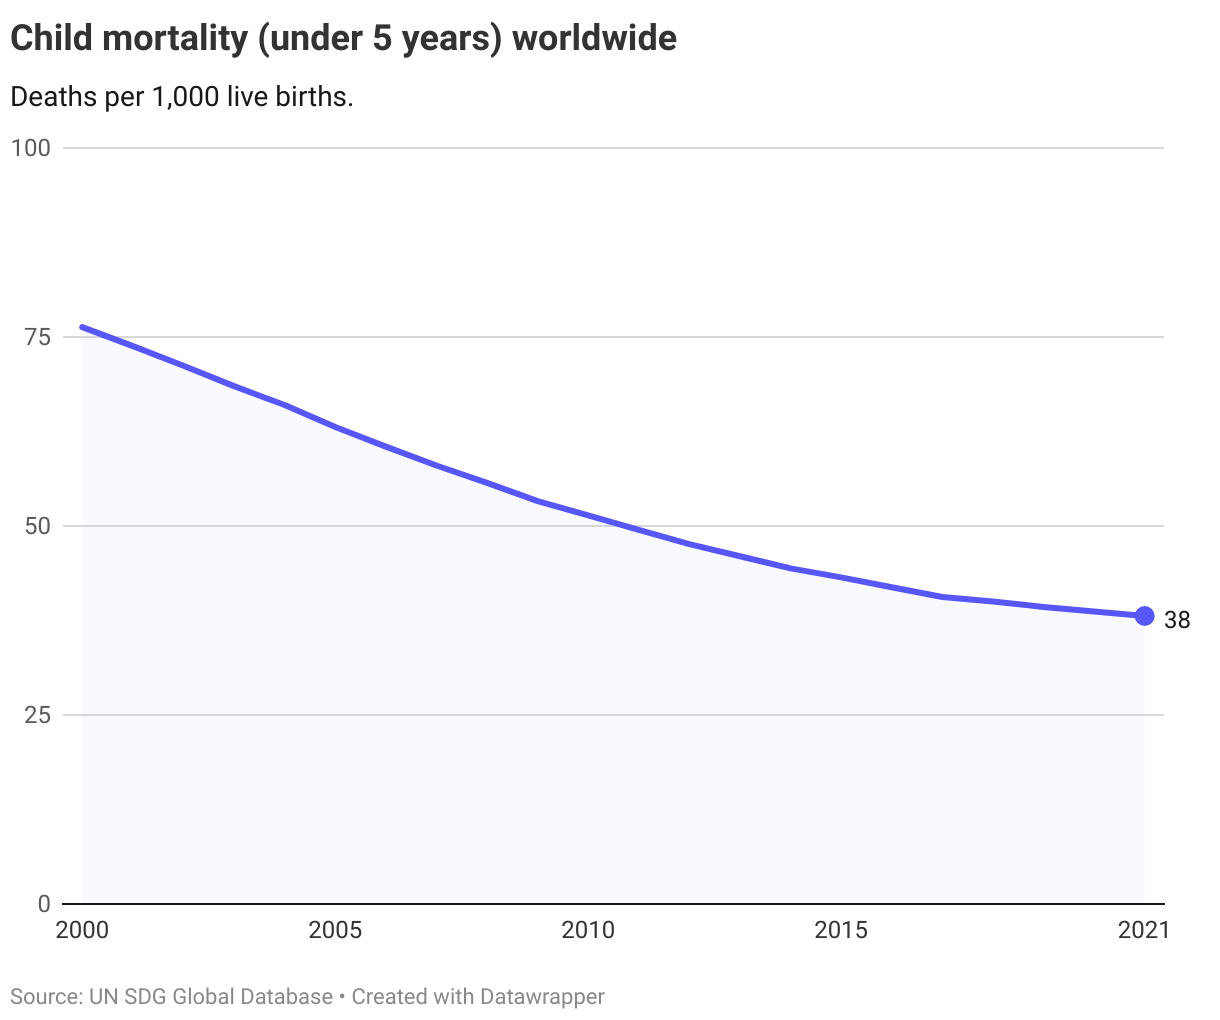
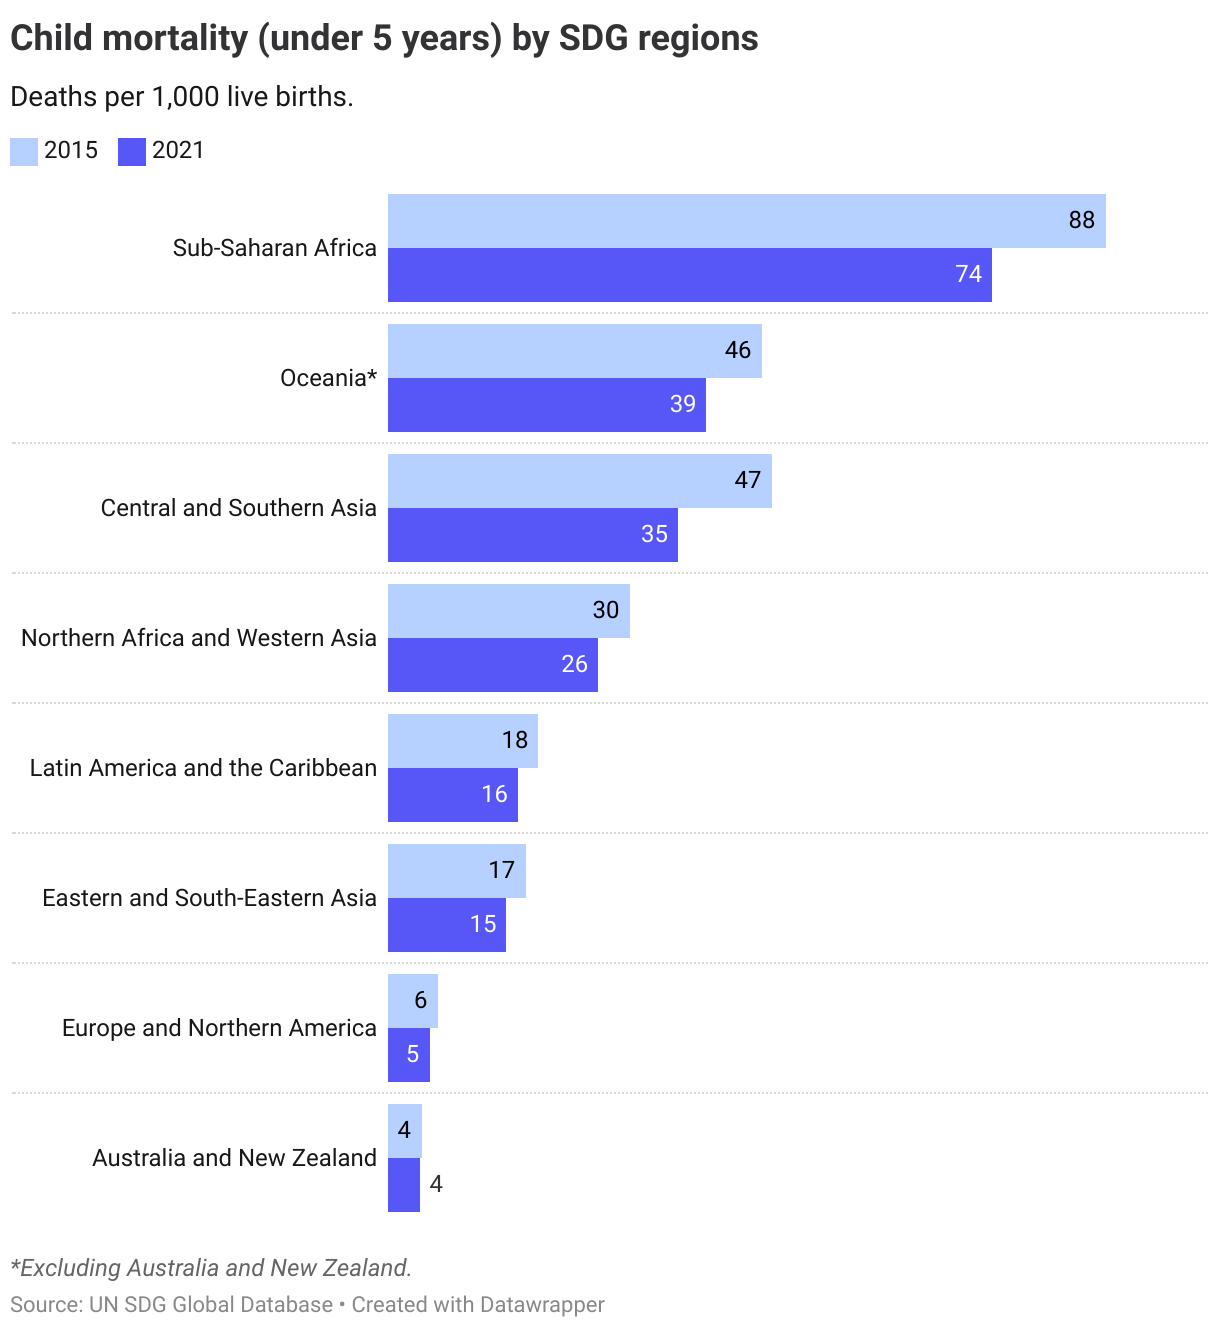
Reductions in the under-5 mortality rate have happened across all regions, with all regions seeing progress since 2015.
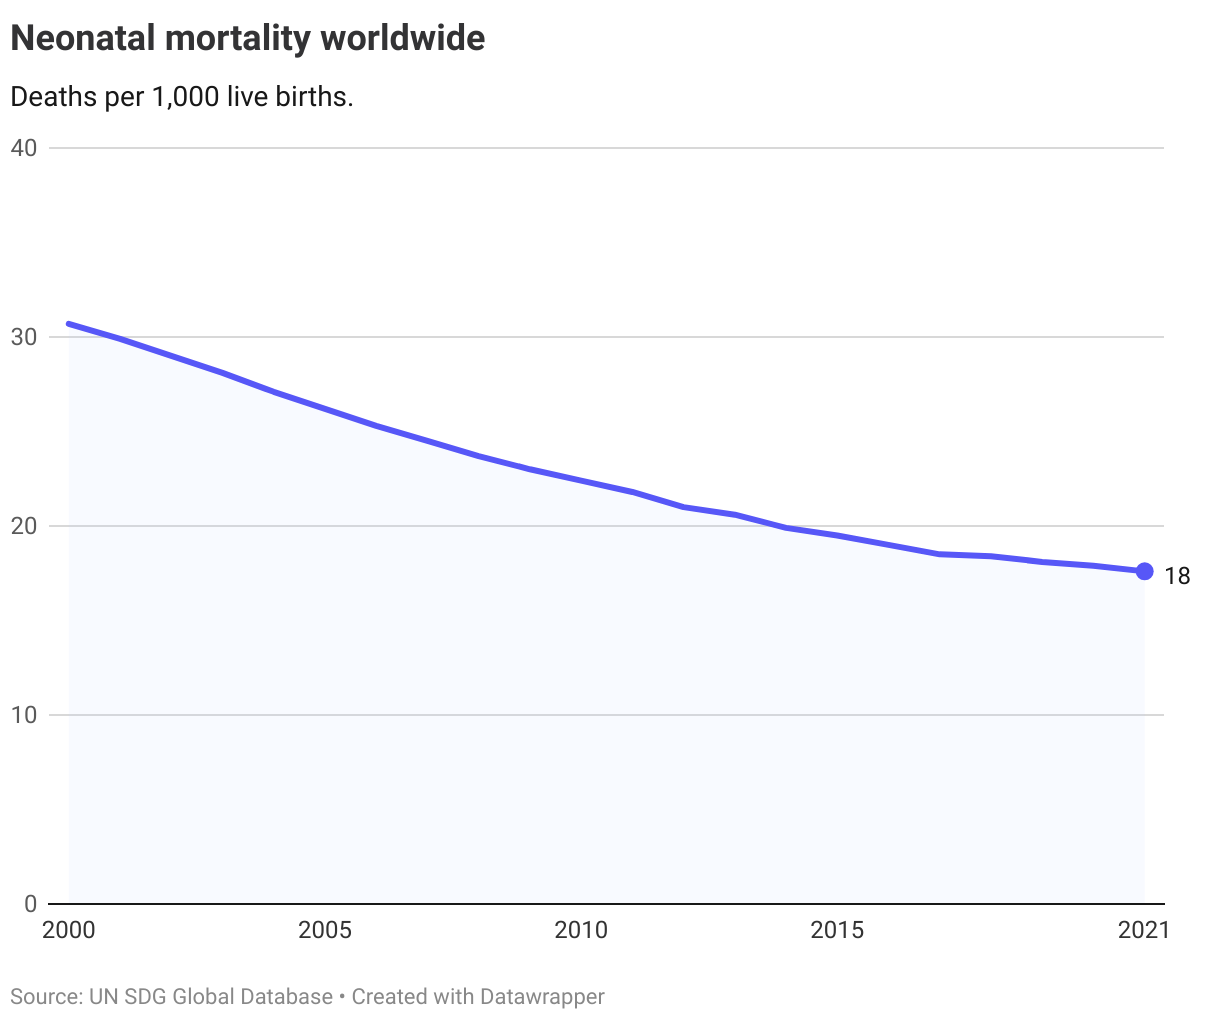
3.2.2. Neo-natal mortality rate
There has been some progress toward reducing the neonatal mortality rate worldwide. From 2015 to 2021 it has fallen from 20 to 18 deaths per 1,000 live births. Yet, also on this indicator accelerated progress is needed to reach the target of reducing it to under 12 deaths per 1,000 live births by 2030.
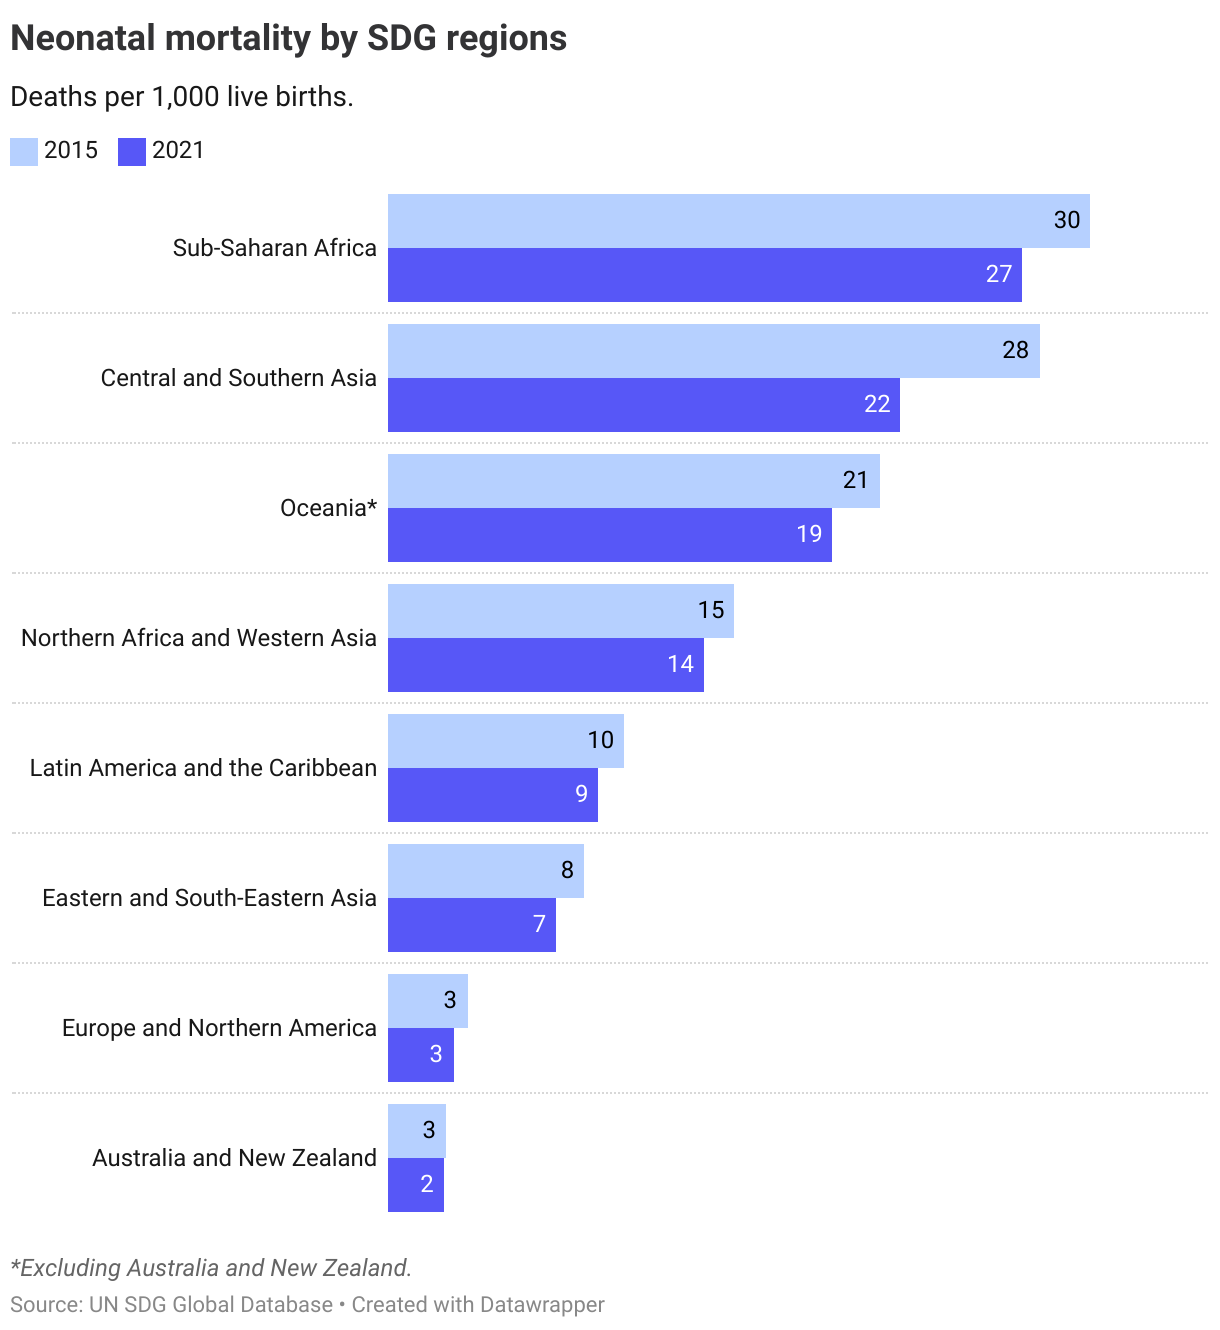
To reach the target of reducing the neonatal mortality rate to 12 deaths per 1,000 live births in 2030, the world is dependent on further progress being made in Sub-Saharan Africa and Central and Southern Asia.
The Nordics
All the Nordic countries have seen declining rates child and neo-natal mortality, and all are currently below the global targets of 12 per 1,000 live births and under-5 mortality to at least as low as 25 per 1,000 live births. The targets for 2030 have thus already been achieved.
Denmark
Target is met
Finland
Target is met
Iceland
Target is met
Norway
Target is met
Sweden
Target is met
Target 3.3
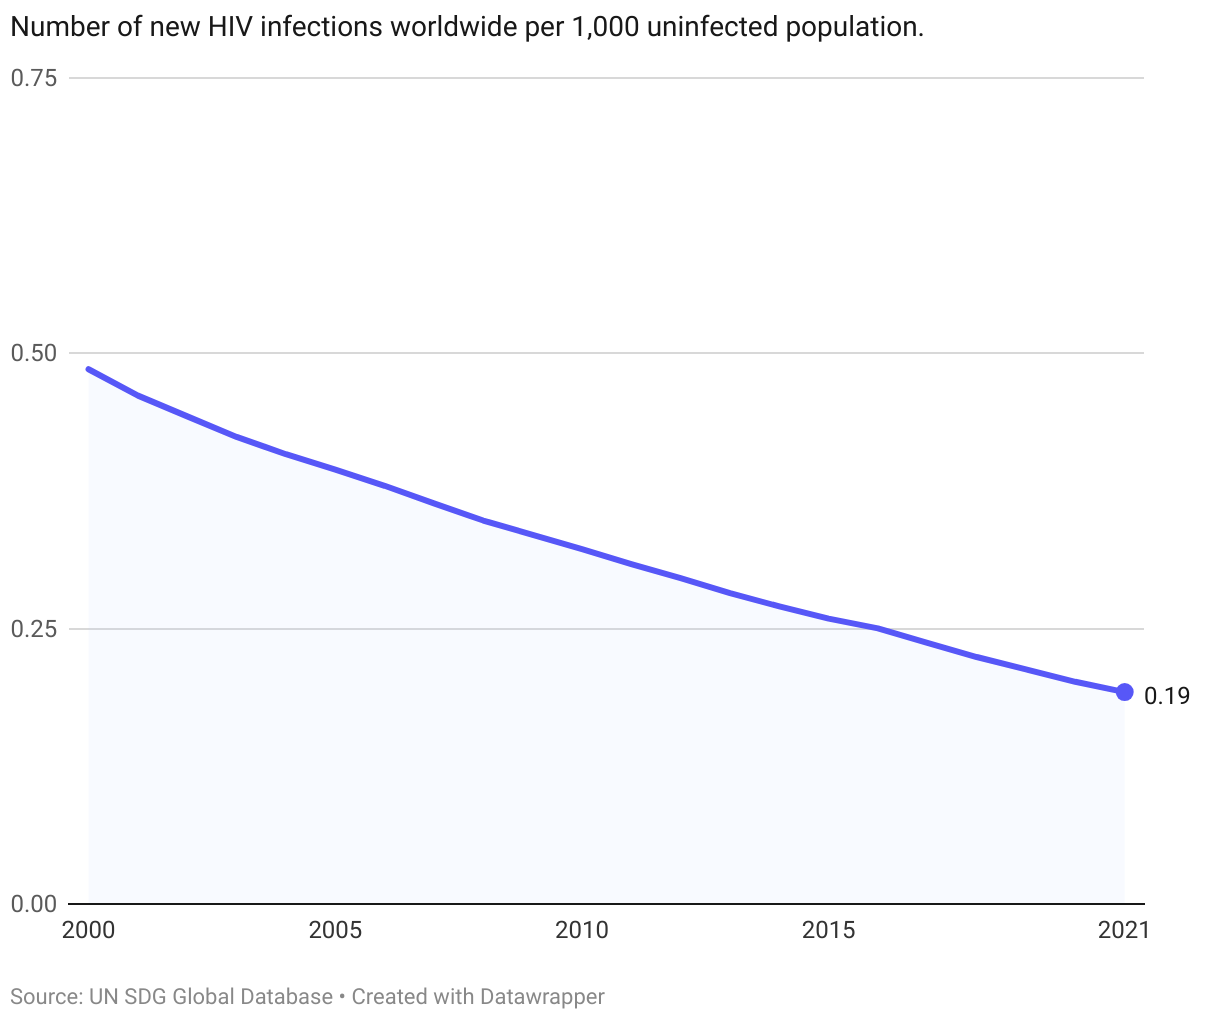
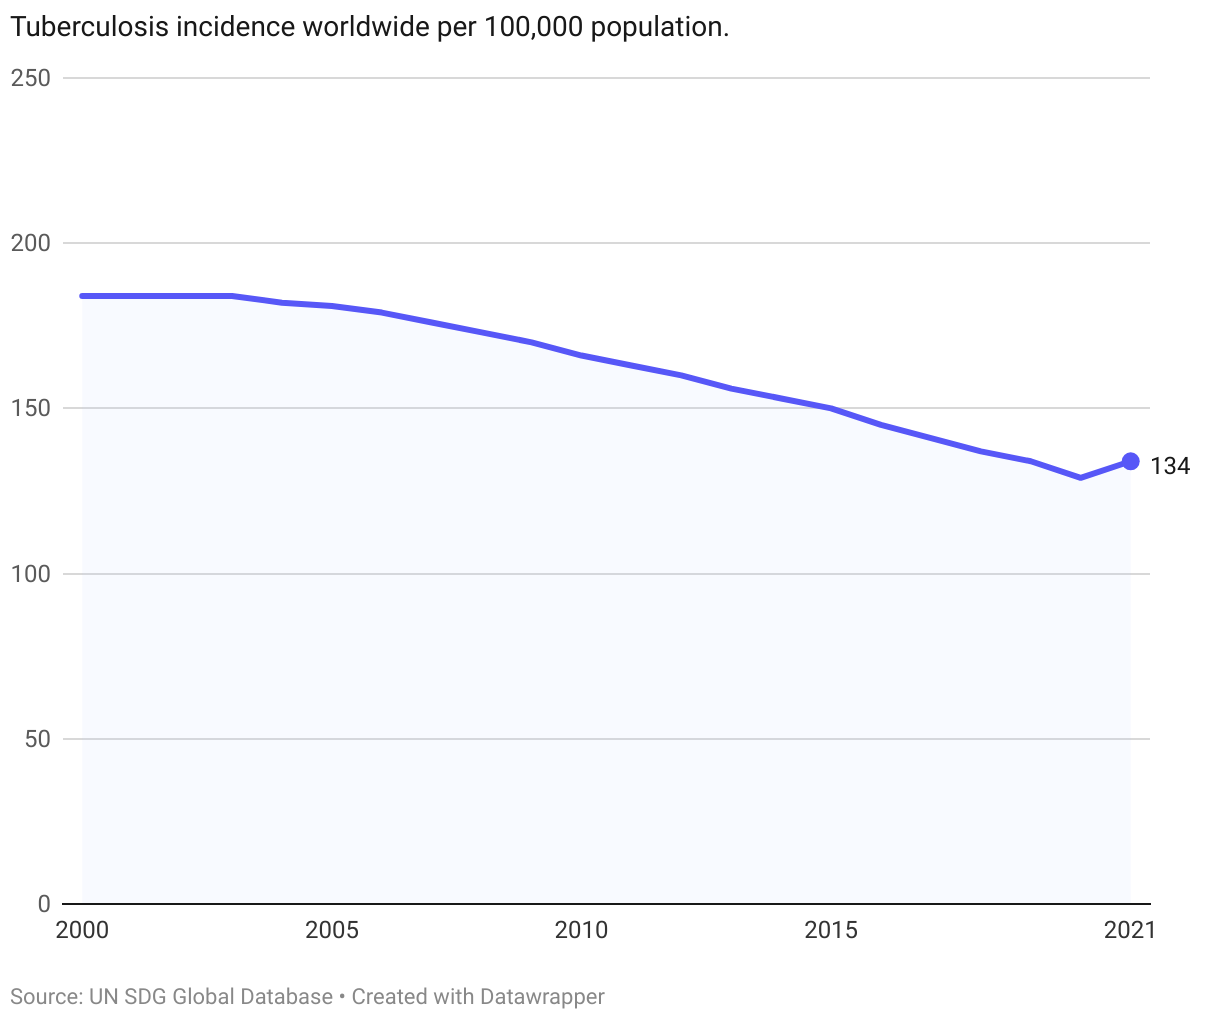
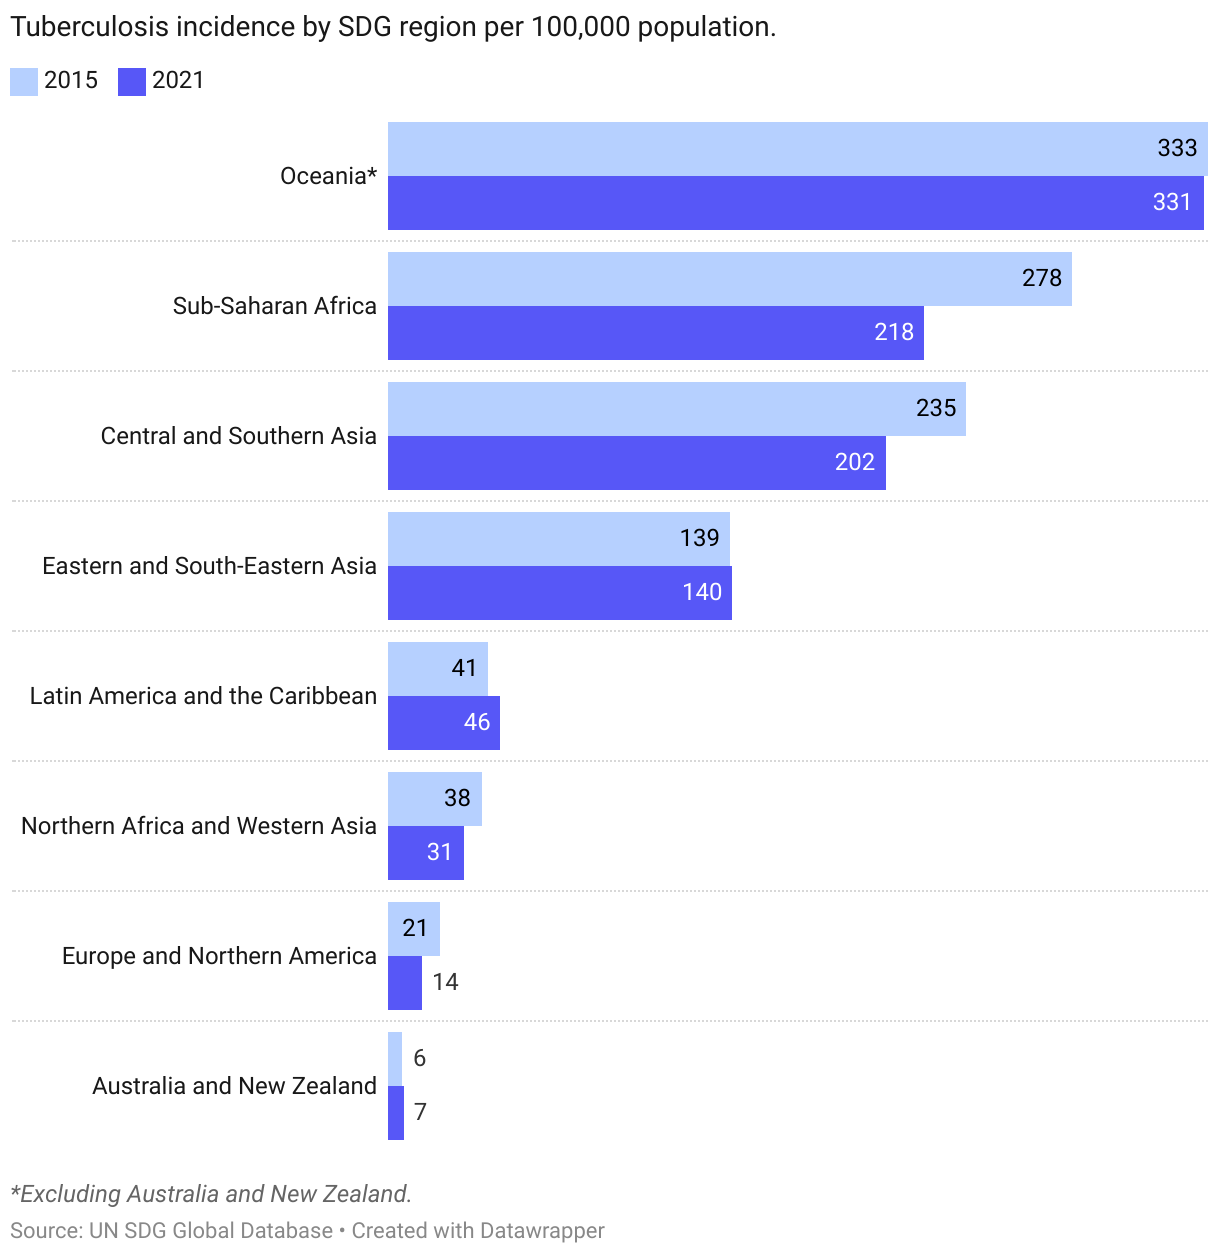
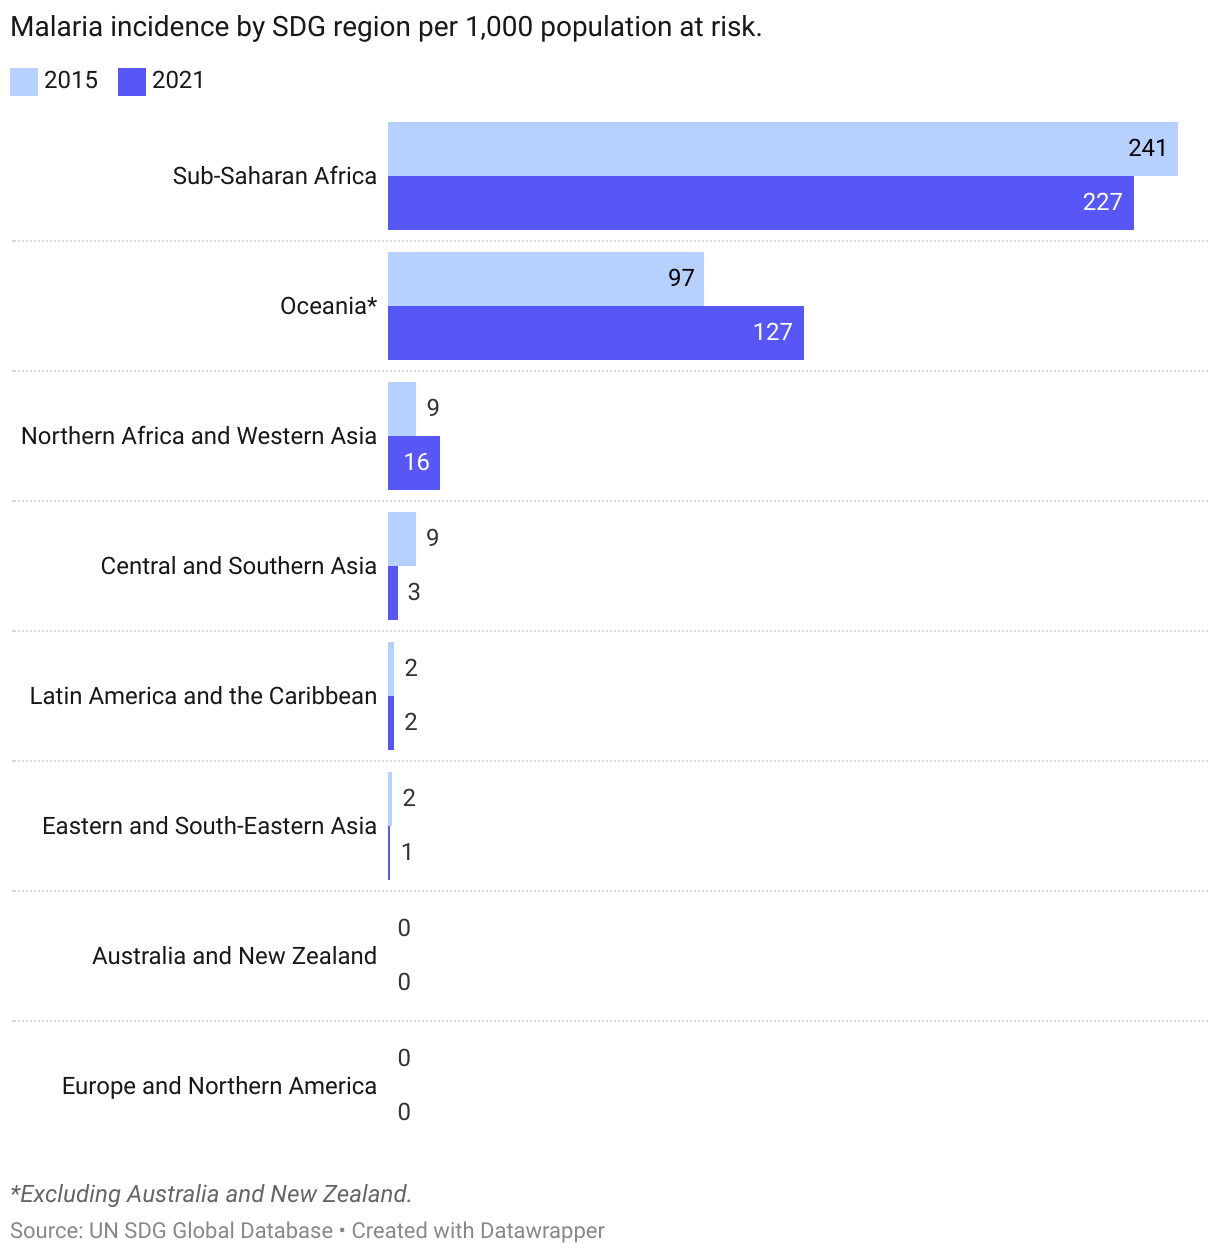
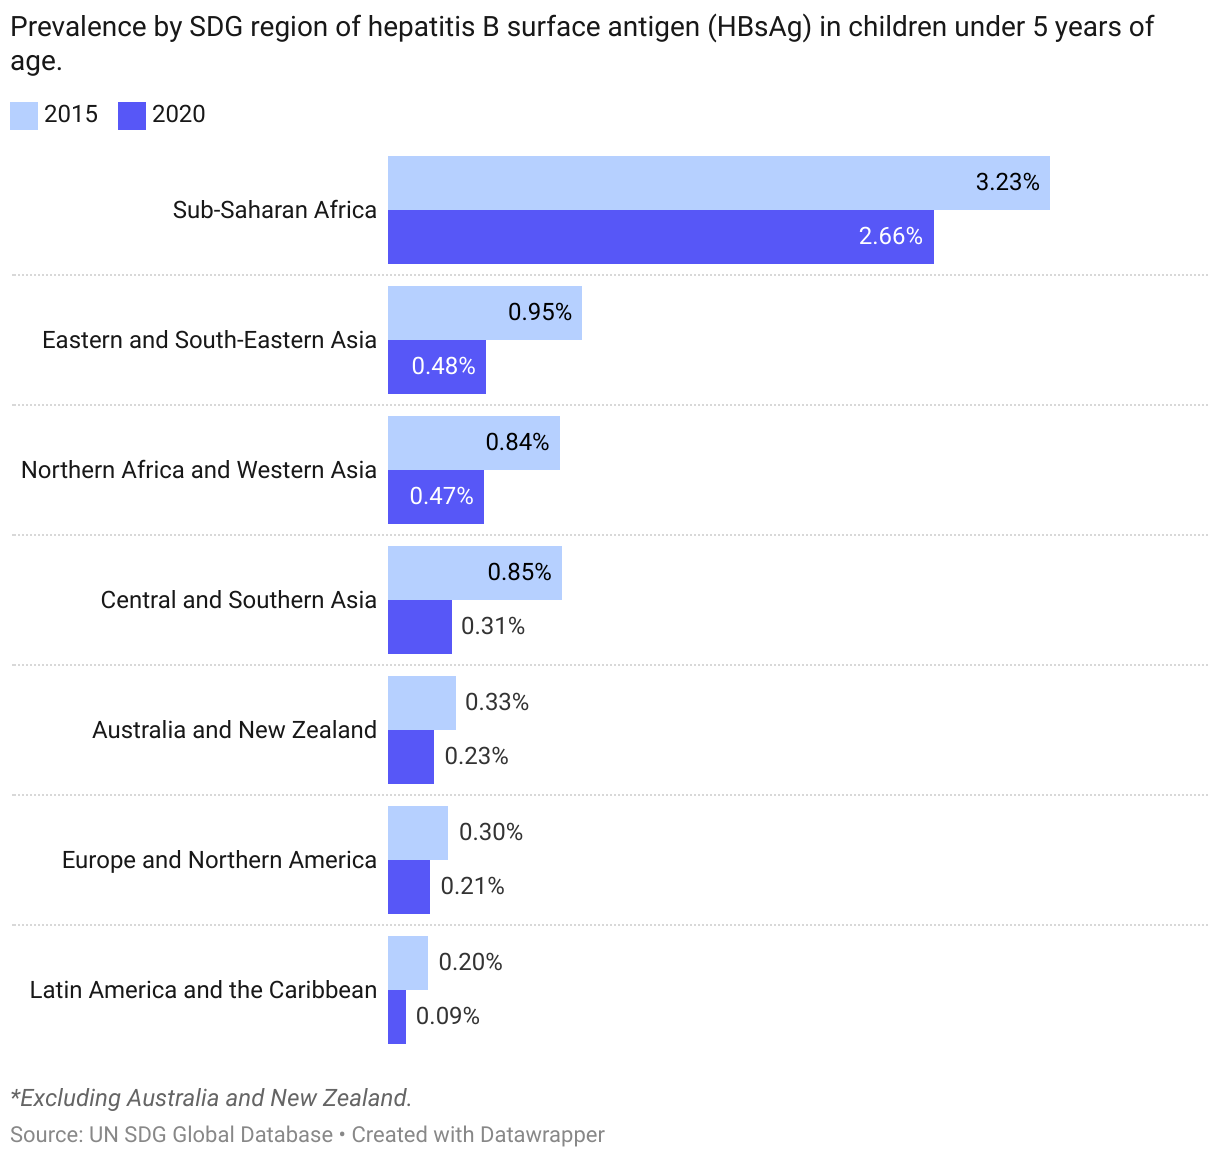
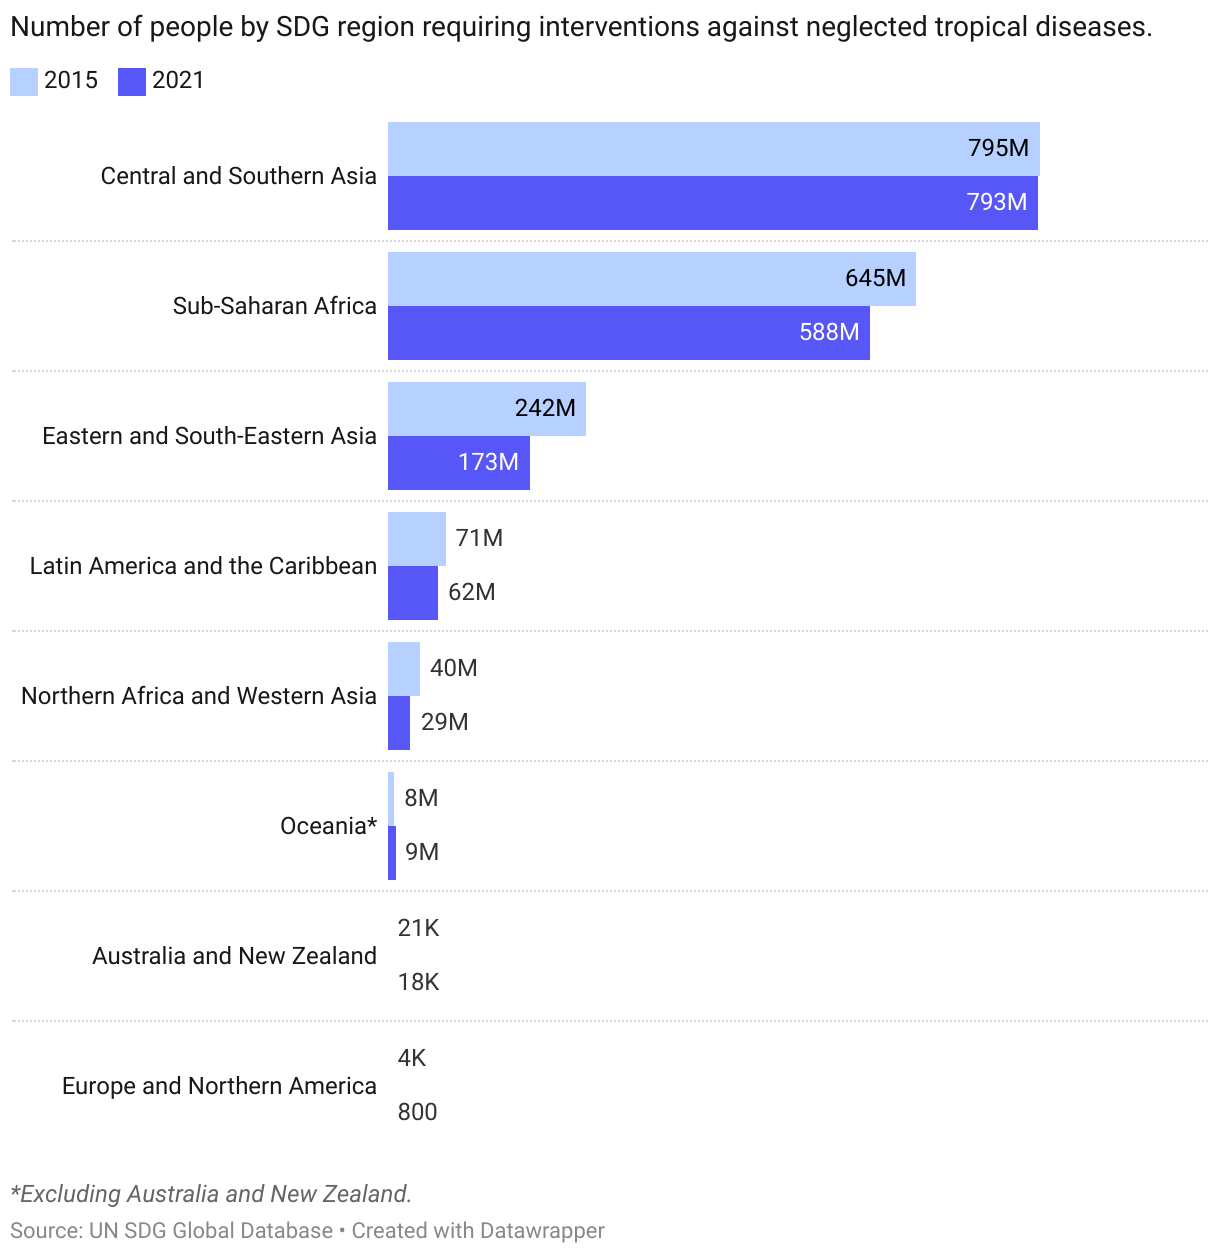
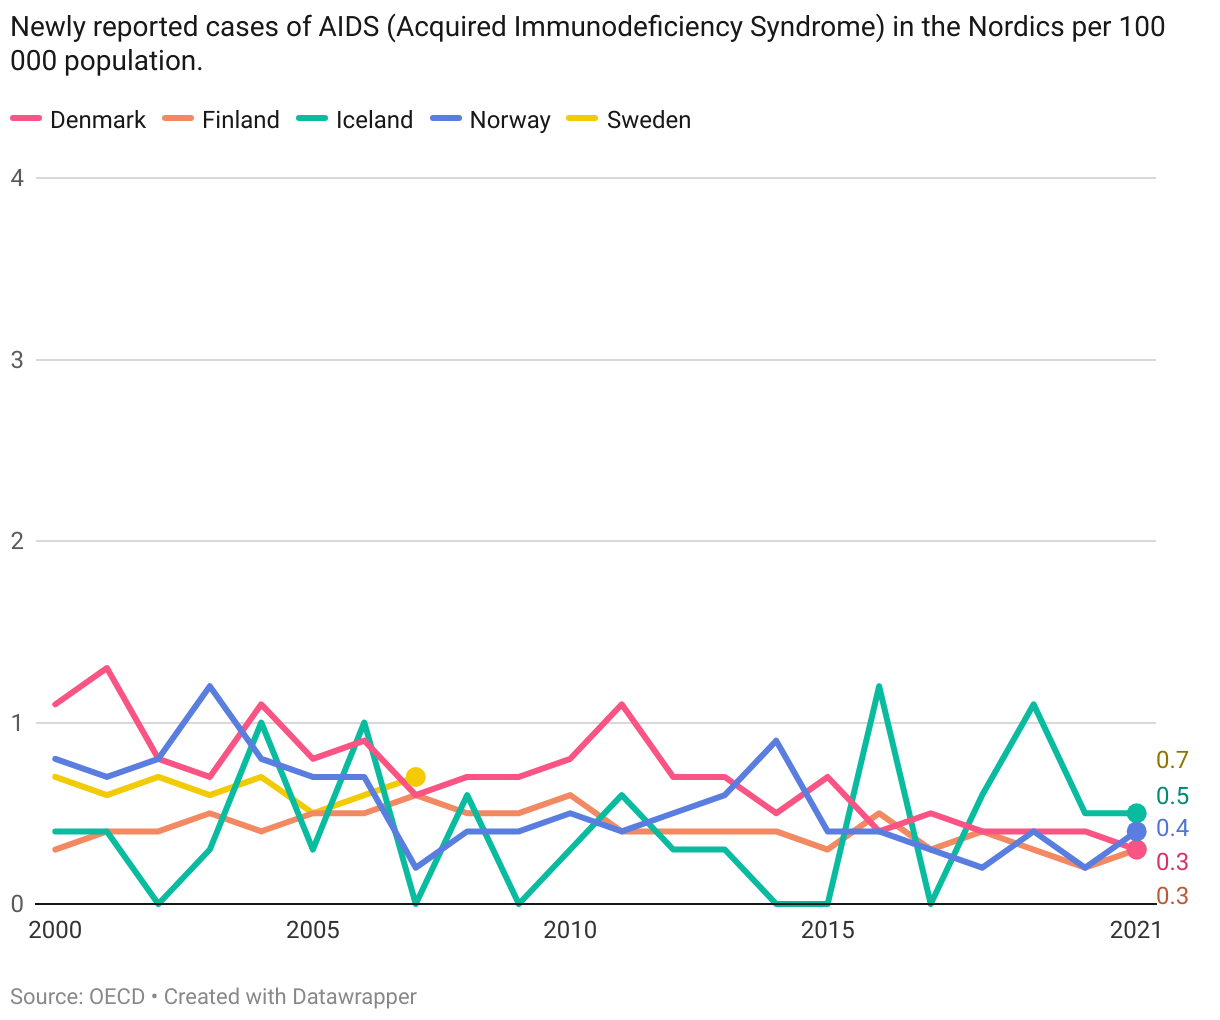
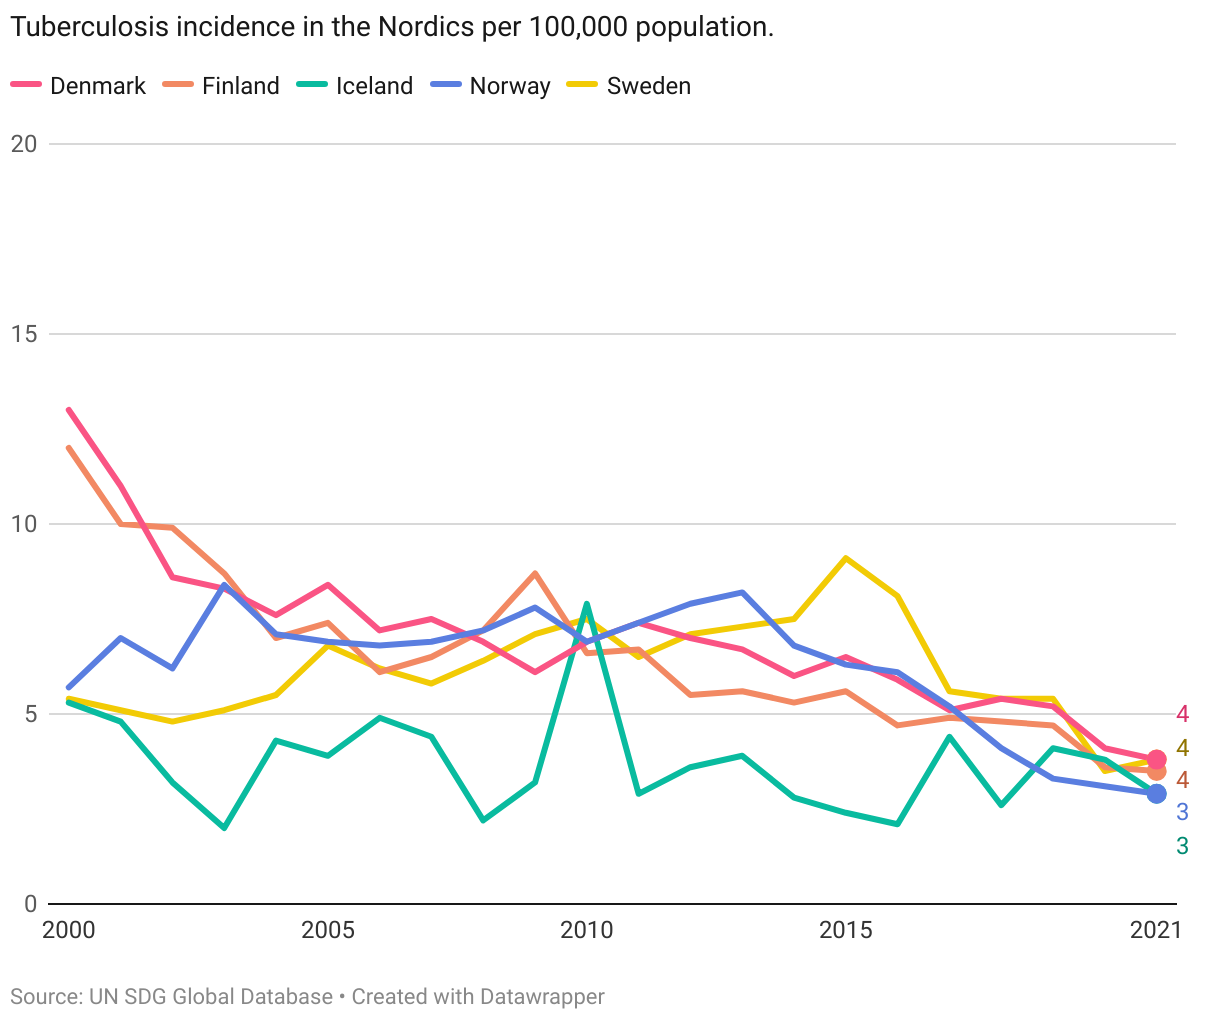
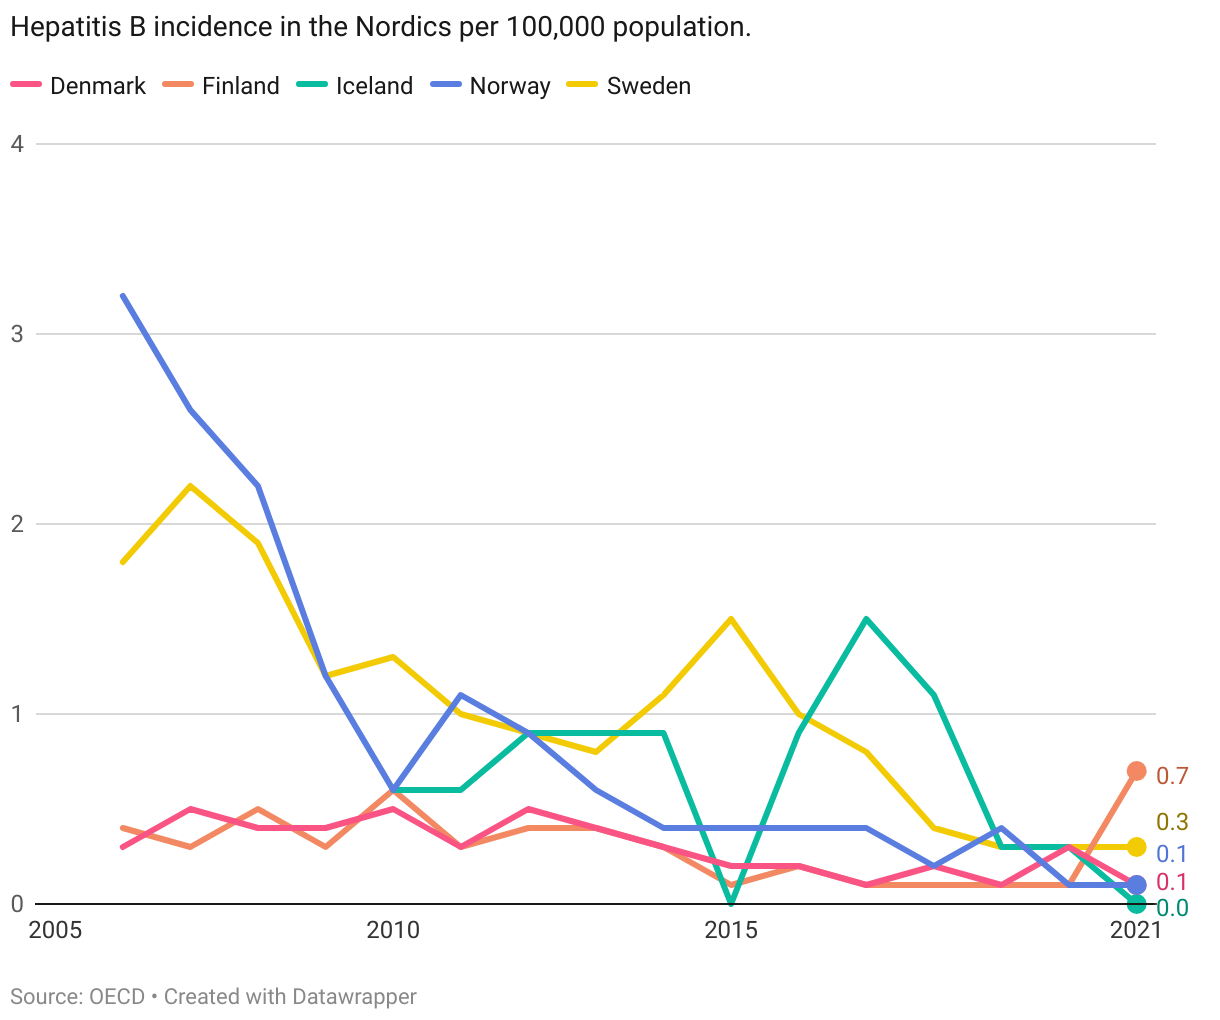
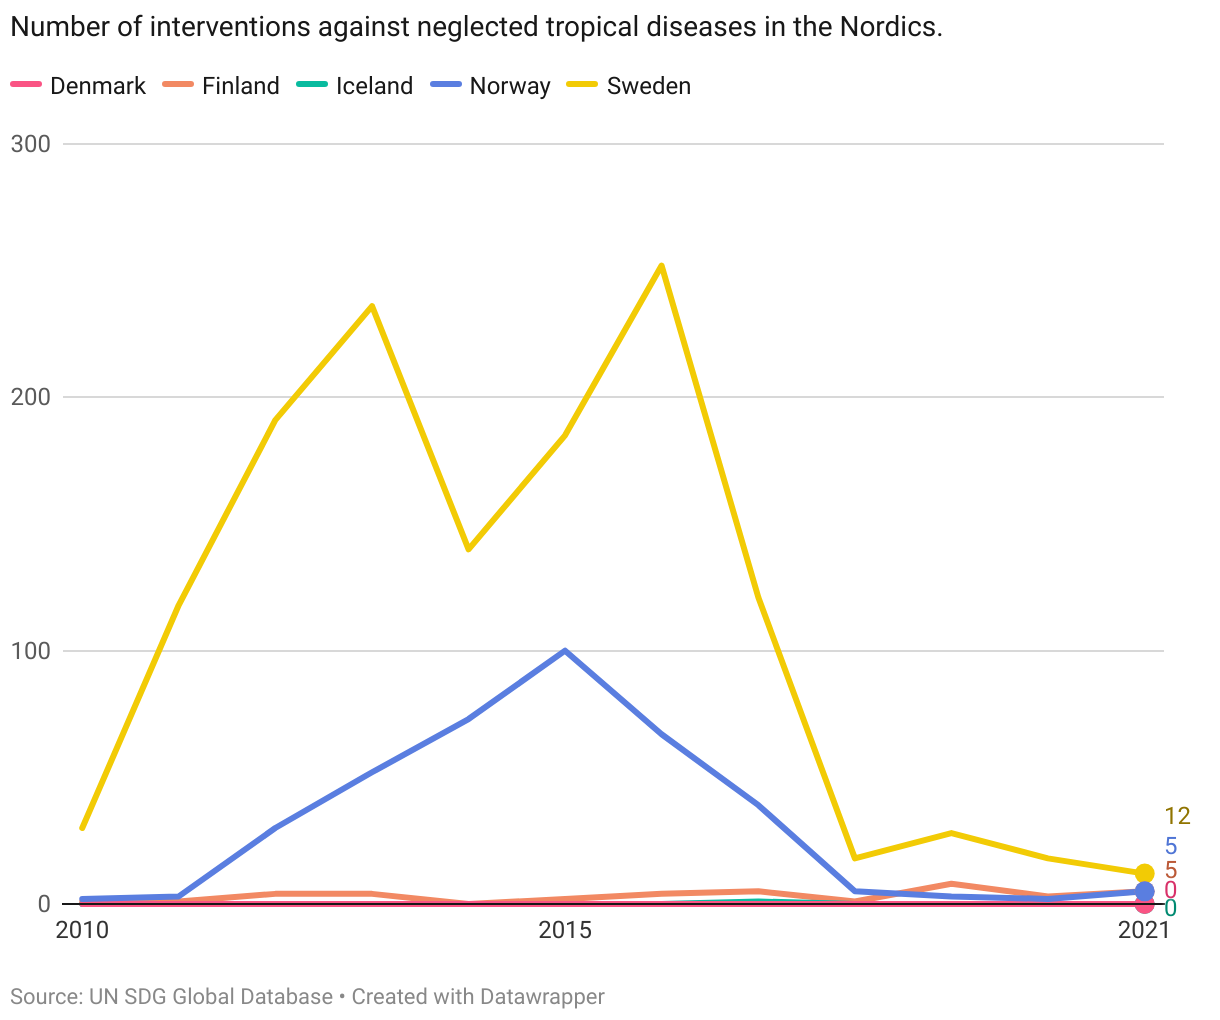
By 2030, end the epidemics of AIDS, tuberculosis, malaria and neglected tropical diseases and combat hepatitis, water-borne diseases and other communicable diseases
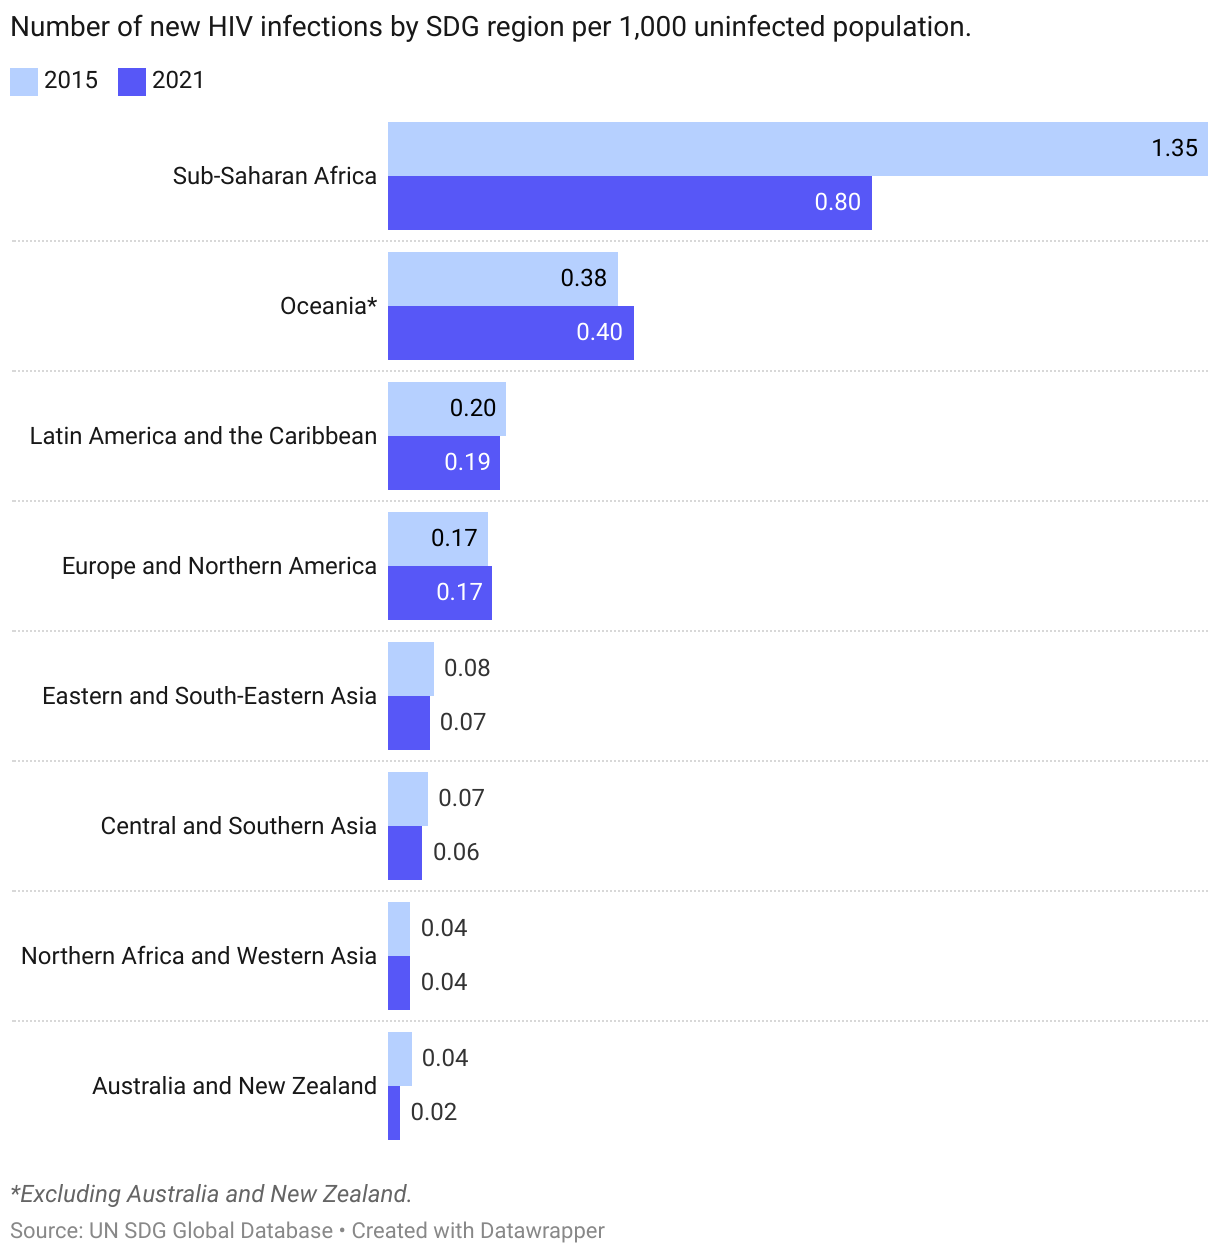
| 3.3.1 | Number of new HIV infections per 1,000 uninfected population |
| 3.3.2 | Tuberculosis incidence per 100,000 population |
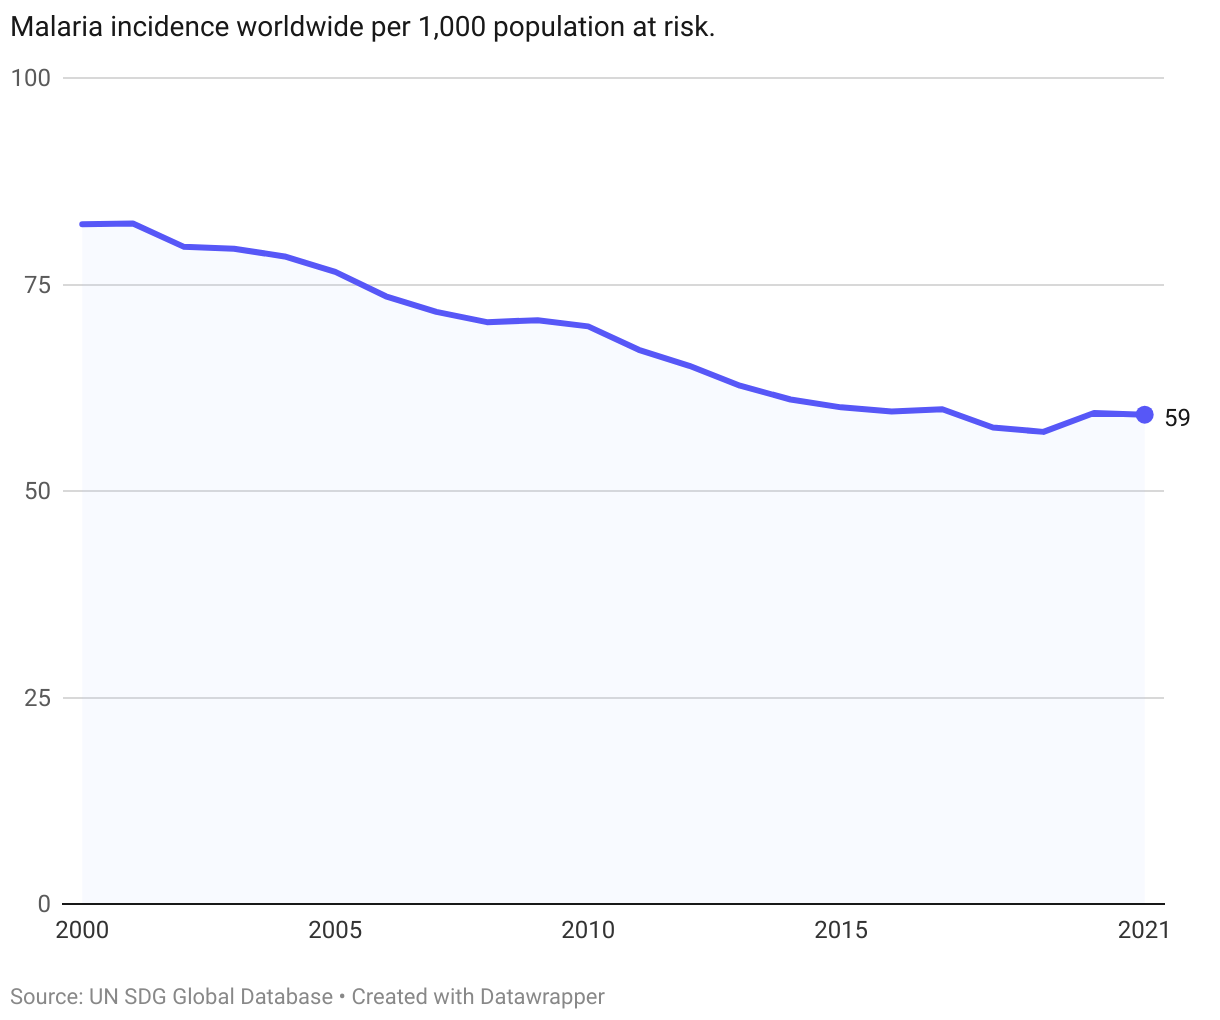
| 3.3.3 | Malaria incidence per 1,000 population |
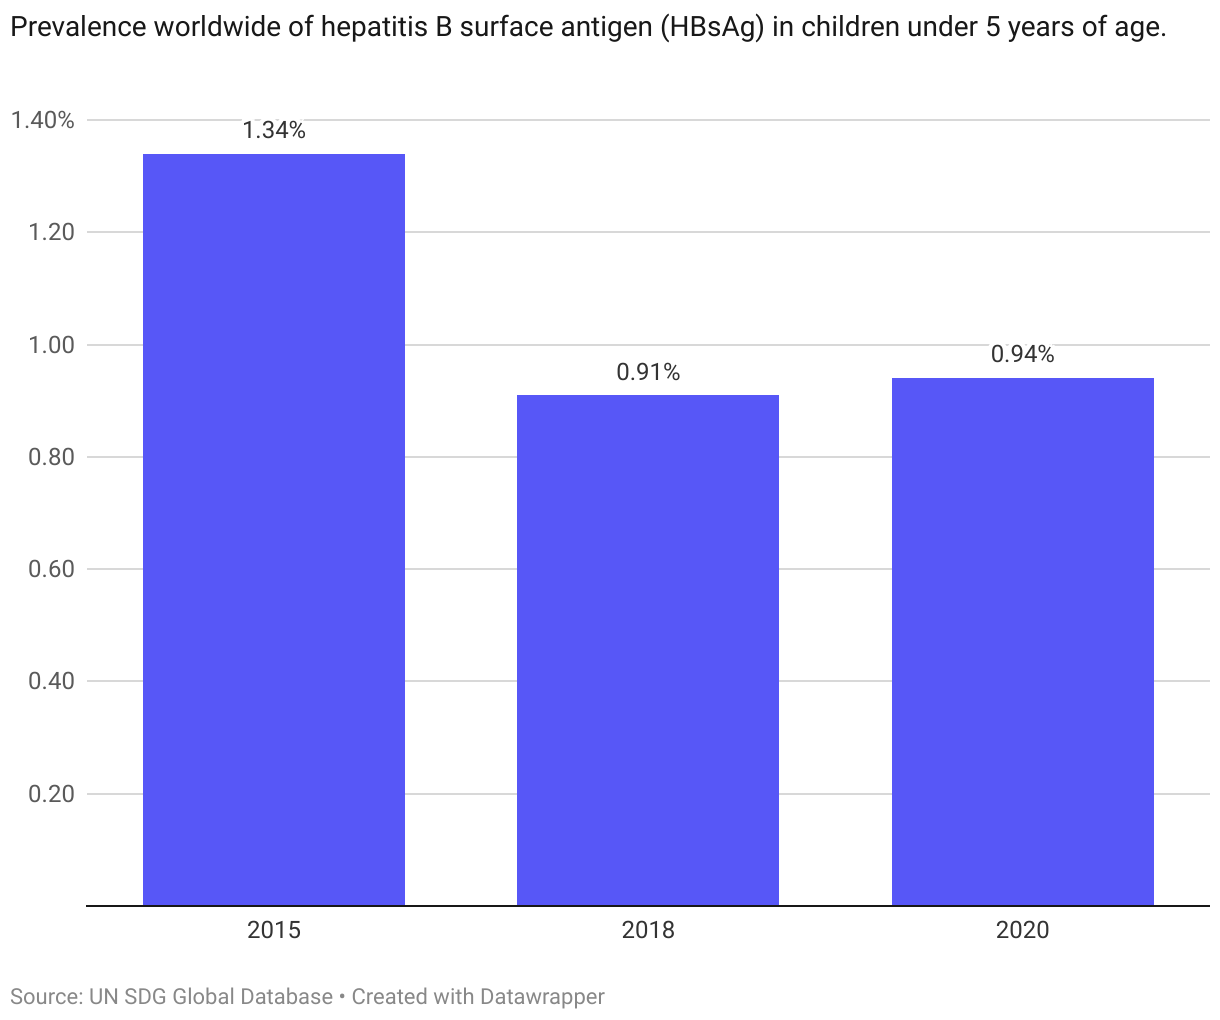
| 3.3.4 | Hepatitis B incidence per 100,000 population |
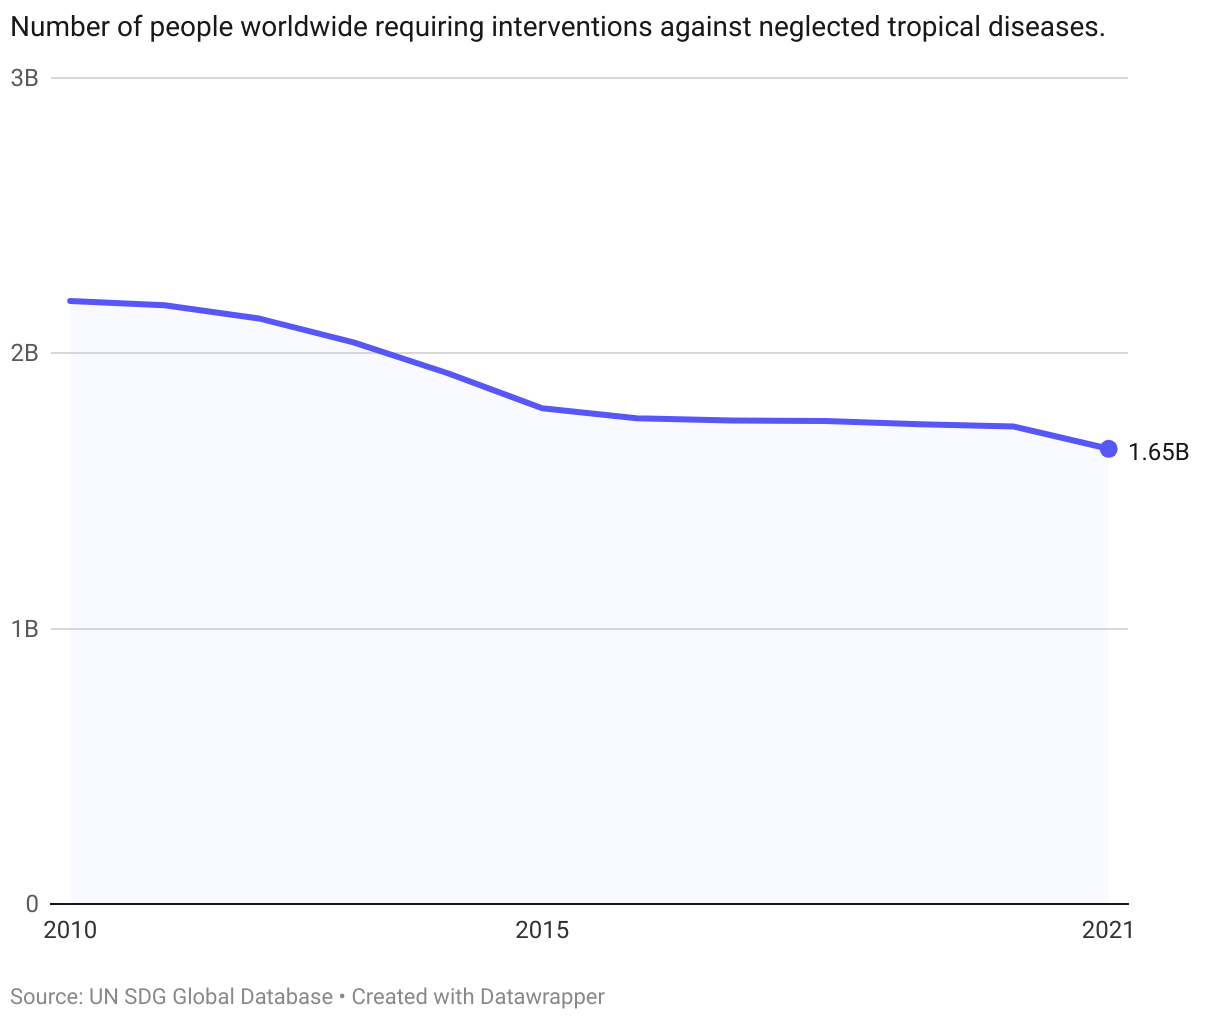
| 3.3.5 | Number of people requiring interventions against neglected tropical diseases |
Global trends
While progress has also been made toward reducing the incidence of communicable diseases, the current pace of progress is not sufficient to reach the target of ending their prevalence by 2030.
Regionally, Sub-Saharan Africa have high incidence rates across all the communicable diseases covered in the target. Notably, significant progress has been made towards reducing HIV incidence rates in the region between 2015 and 2021.
The Nordics
All the Nordic countries have low incidence rates of communicable diseases that are included in this target. (Note that due to data availability, AIDS incidence is used instead of HIV.) Prevalence rates are less than 3 per 100 000 population (the OECD set target) for both AIDS and Hepatitis B. For tuberculosis most countries have either met this target, or are on track to reach it. There is no incidence of malaria in the Nordic countries. Tropical diseases is also negligble across all countries. The combined assessment across all indicators is thus that the Nordic countries have already met this target.
Denmark
Target is met
Finland
Target is met
Iceland
Target is met
Norway
Target is met
Sweden
Target is met
Target 3.4
By 2030, reduce by one third premature mortality from non-communicable diseases through prevention and treatment and promote mental health and well-being
| 3.4.1 | Mortality rate attributed to cardiovascular disease, cancer, diabetes or chronic respiratory disease |
| 3.4.2 | Suicide mortality rate |
Global trends
3.4.1. Non-communicable diseases
The latest UN data from 2019 shows that the four main non-communicable diseases (NCDs), cardiovascular diseases, cancer, diabetes, or chronic respiratory disease, caused over 33 million deaths worldwide in 2019.
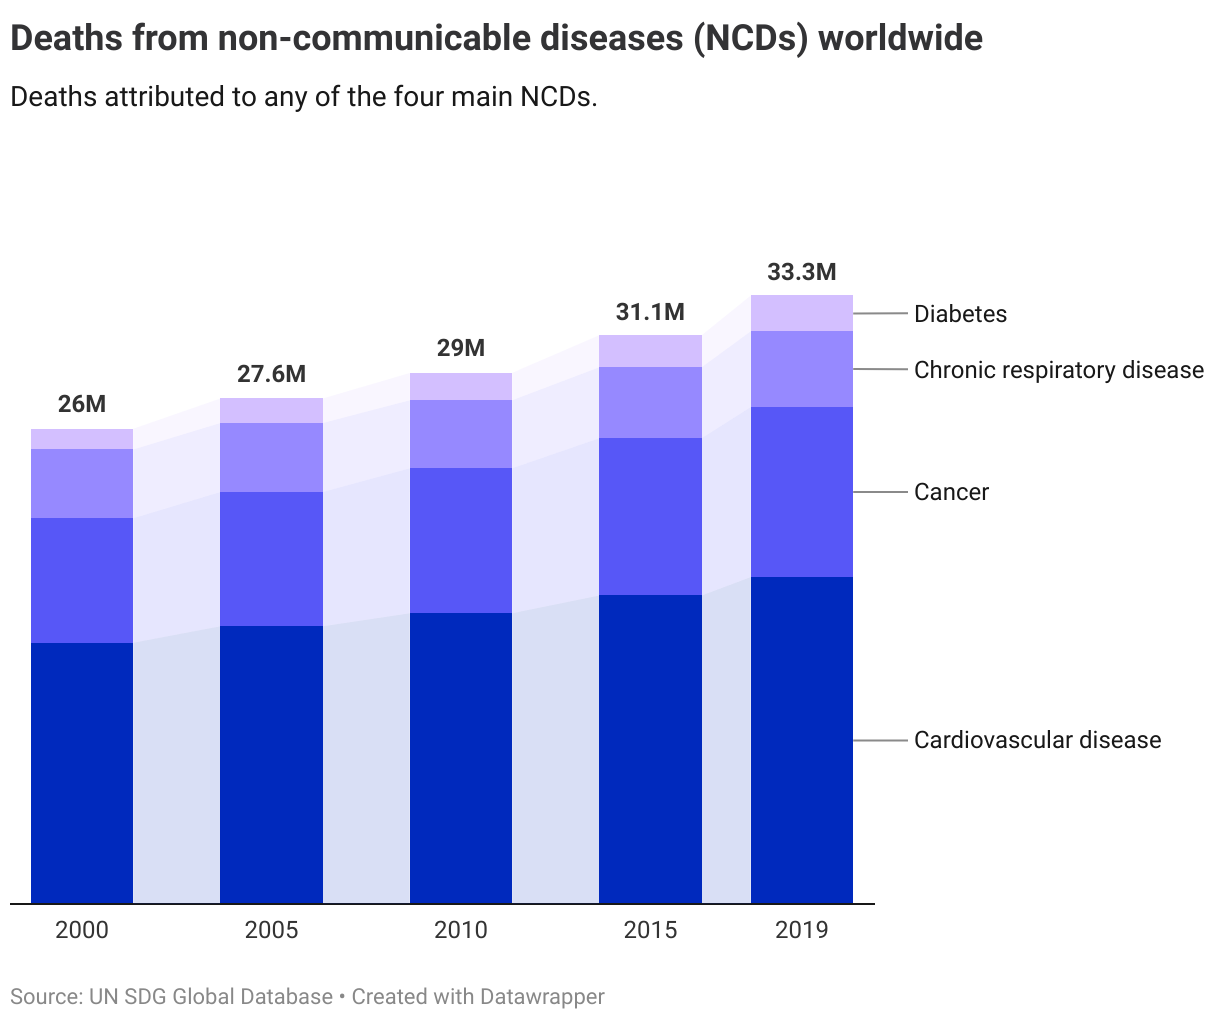
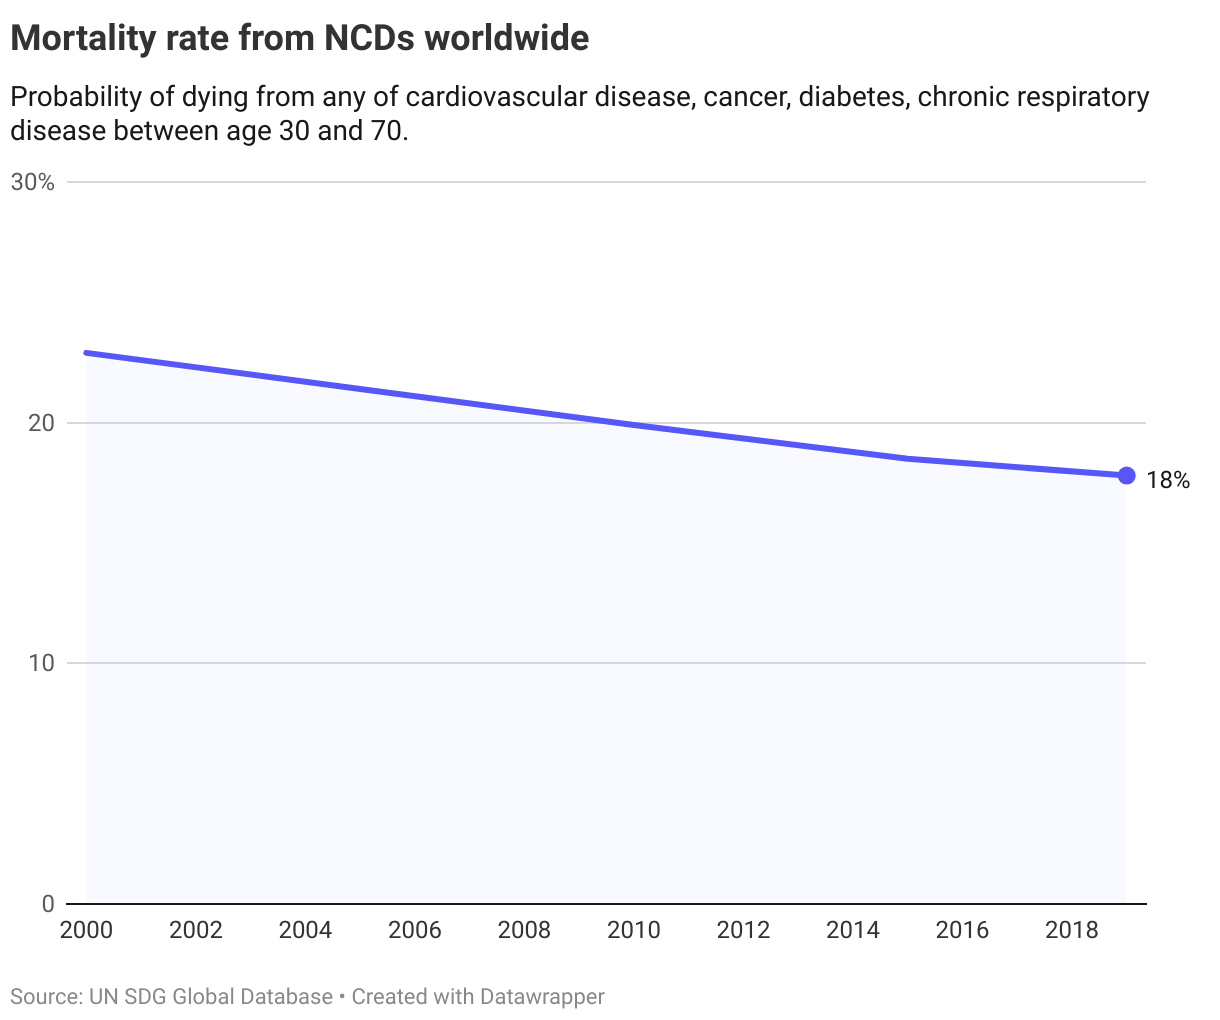
The mortality rate is defined as the probability of dying from any of the four main NCDs between the age of 30 and 70, and has declined slowly in recent years. From 23% in 2000, to 19% in 2015 and 18% in 2019.
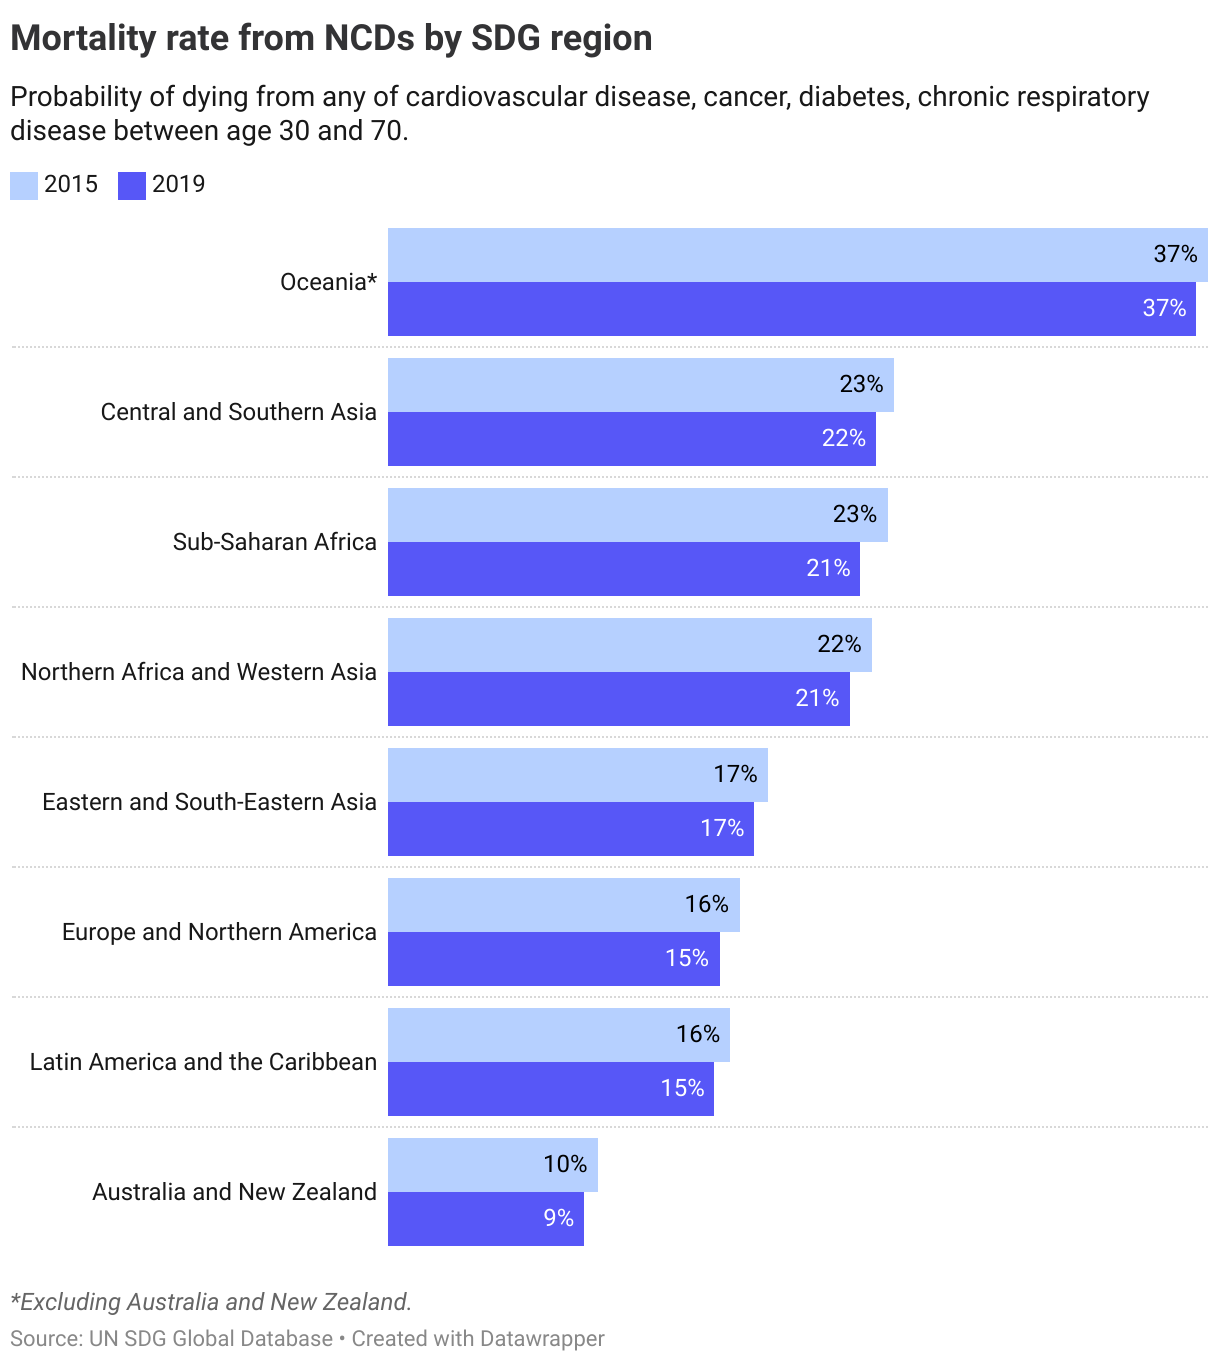
Yet, the current rate of decline will not be sufficient to reach the target of reducing the mortality rate by one-third by 2030, compared to 2015 levels. This is despite all regions making some progress since 2015.
Most regions have seen some reductions in mortality rates between 2015 and 2019. The lowest probability of dying from NCDs is in Australia and New Zealand and the highest in Oceania (excluding Australia and New Zealand).
3.4.2. Suicide rates
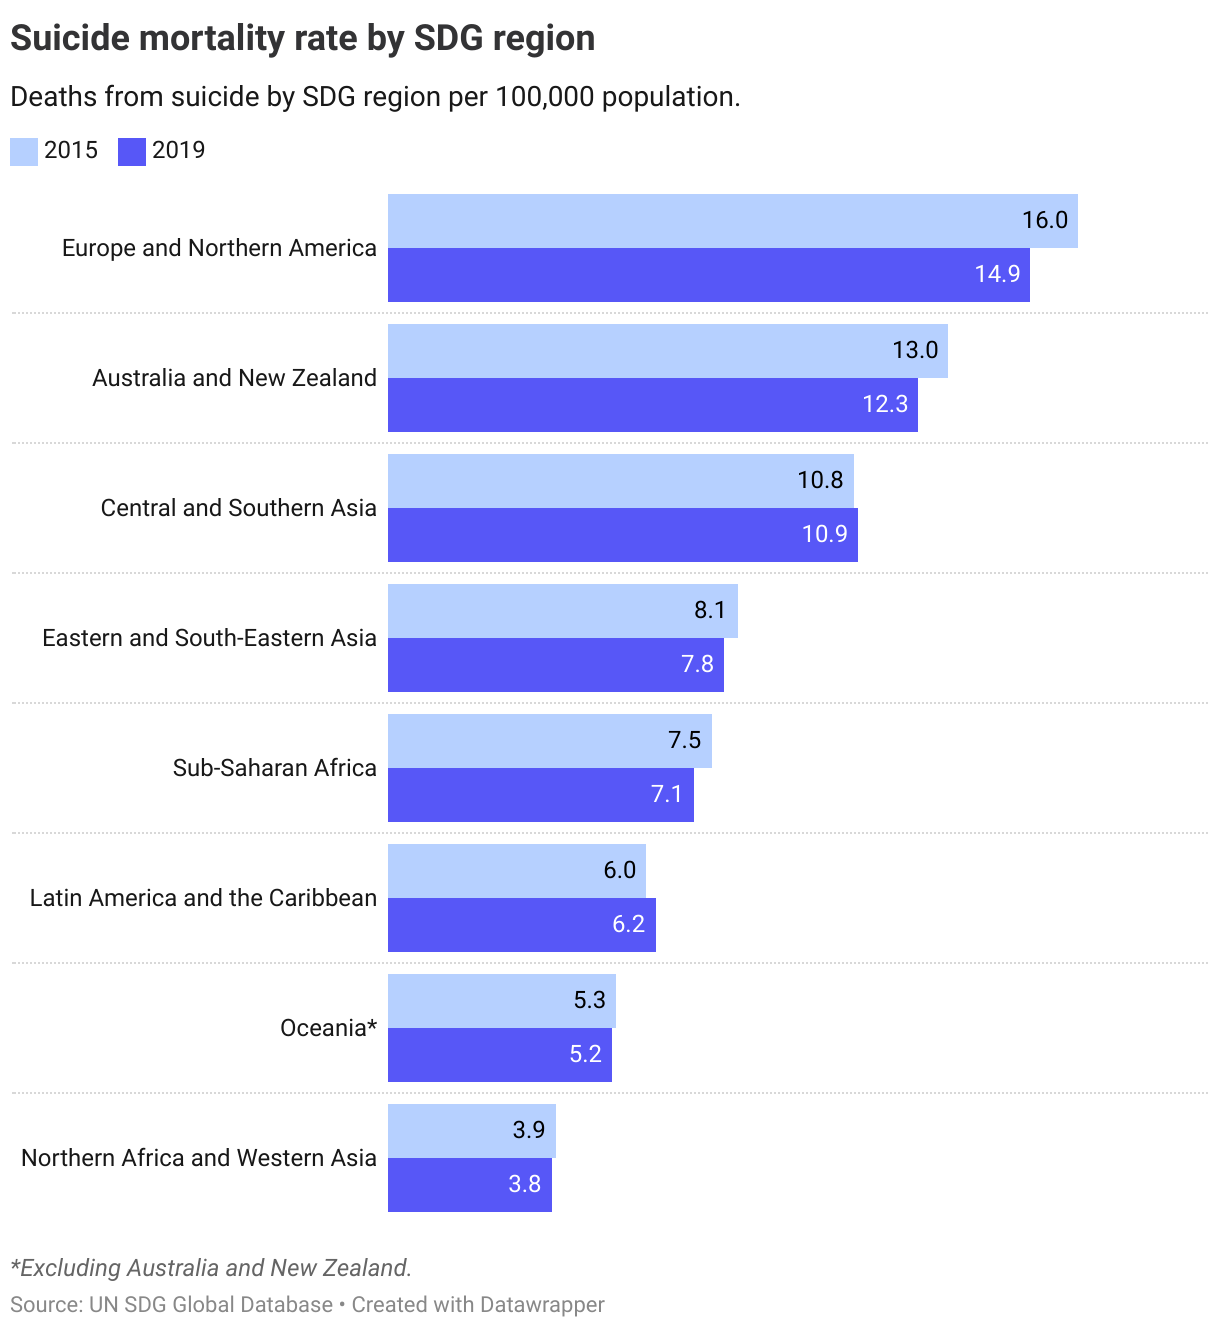
The second indicator for this target, the suicide mortality rate, stood 9.2 deaths from suicide per 100,000 population in 2019. A slight decline from 9.5 in 2015. This rate of progress will not be sufficient to reach the target of reducing suicide mortality rates one-third by 2030 compared to 2015 levels.
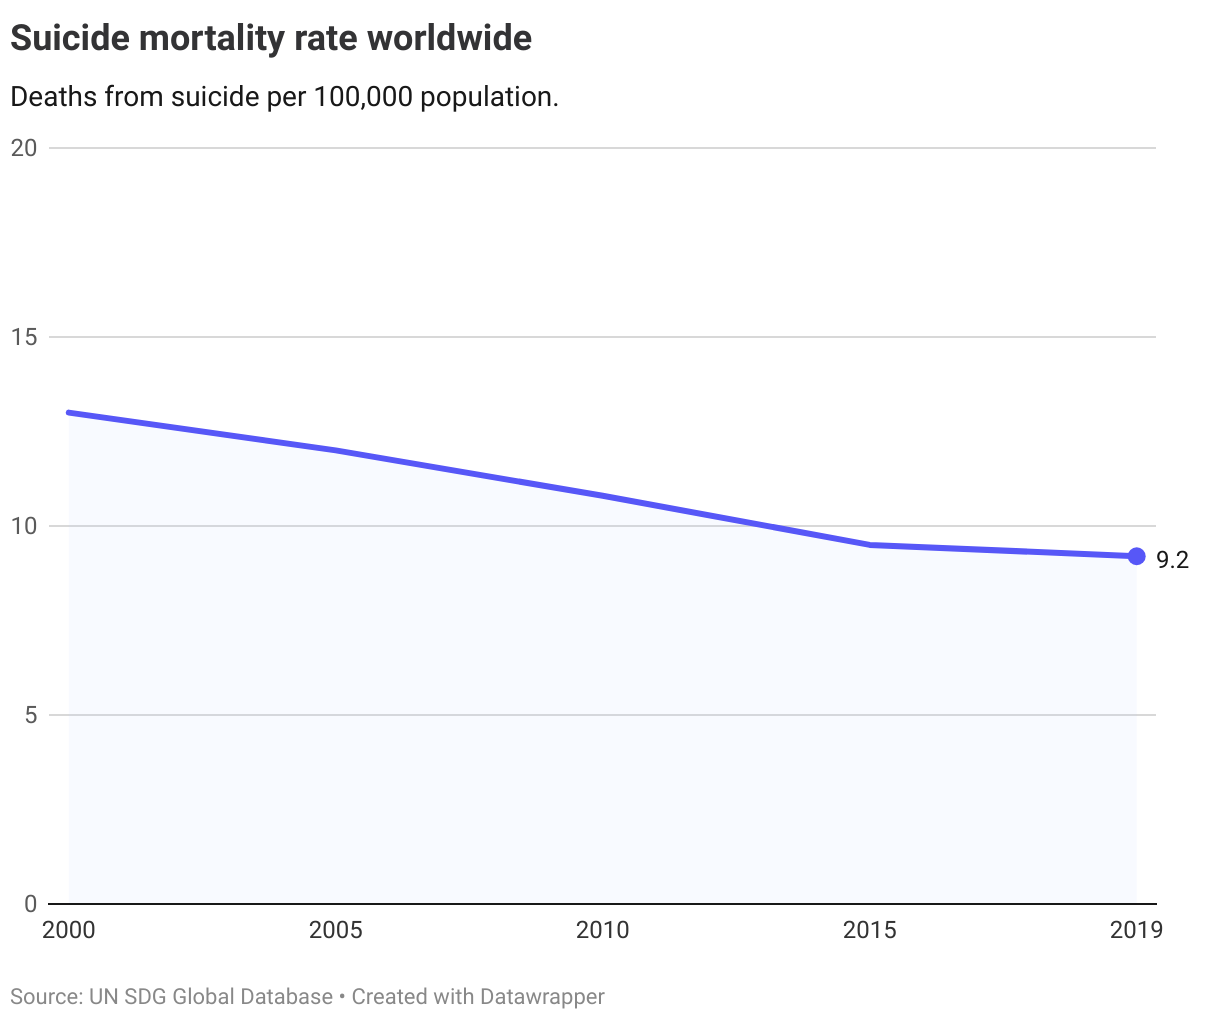
Regionally, Europe and Northern America has highest suicide mortality rates, followed by Australia and New Zealand. The lowest level can be found in Northern Africa and Western Asia where it currently stands at almost four times as low as in Europe and Northern America.
The Nordics
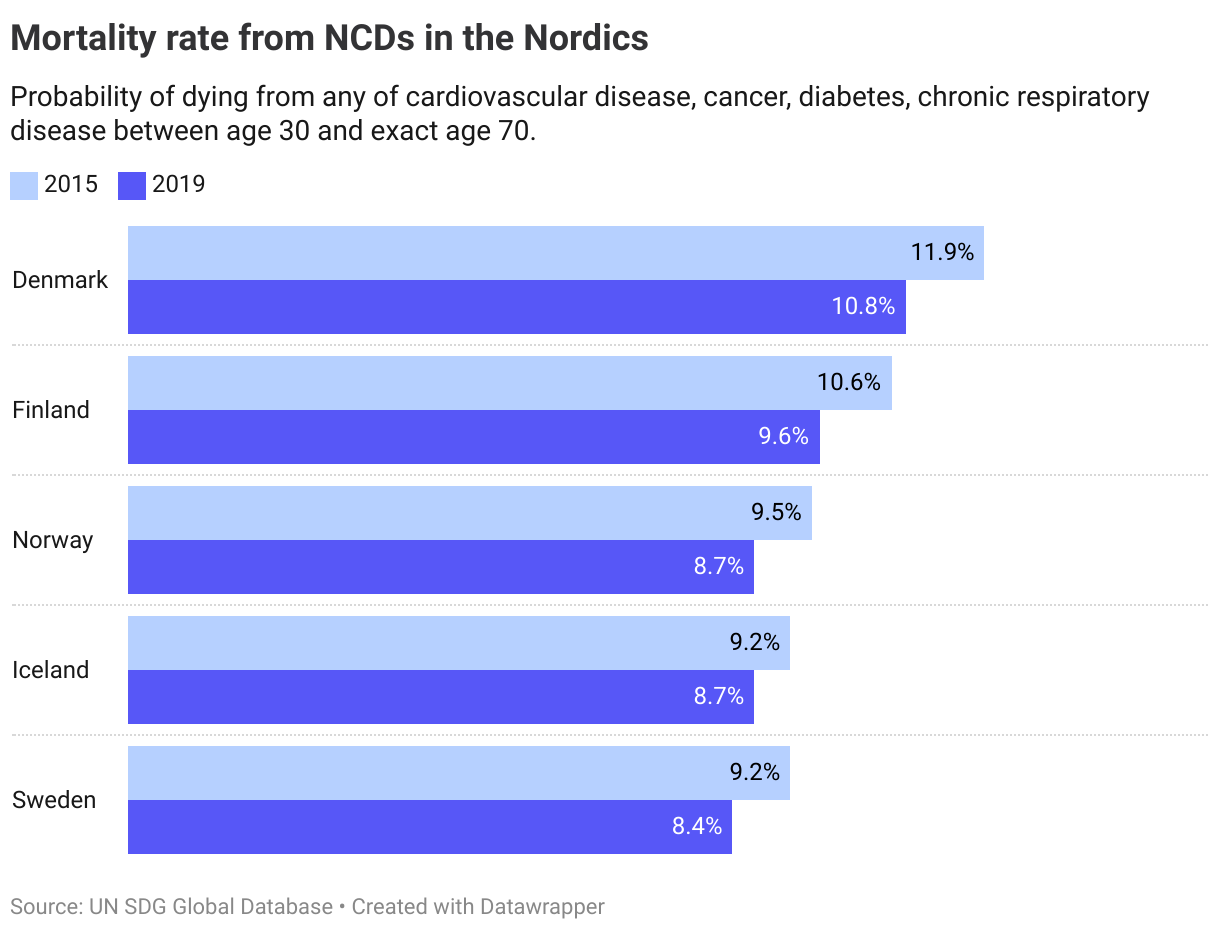
For OECD-countries, the OECD has operationalised a target level of less than 7.5% probability of dying from NCDs in 2030. Currently, none of the Nordics have met this target, and there is not enough data to perform a trend assessment or future projections (less than three datapoints within a five year period is available).
As regards suicide rates, the OECD has operationalised the target level at less than 3 per 100 000 persons. The latest data from 2019 shows that the Nordics are 4-5 times higher than this target, with no major progress seen since 2015. As with NCDs the available data is not sufficient for an assessment of trends (a minimum of three observations within a five year period).
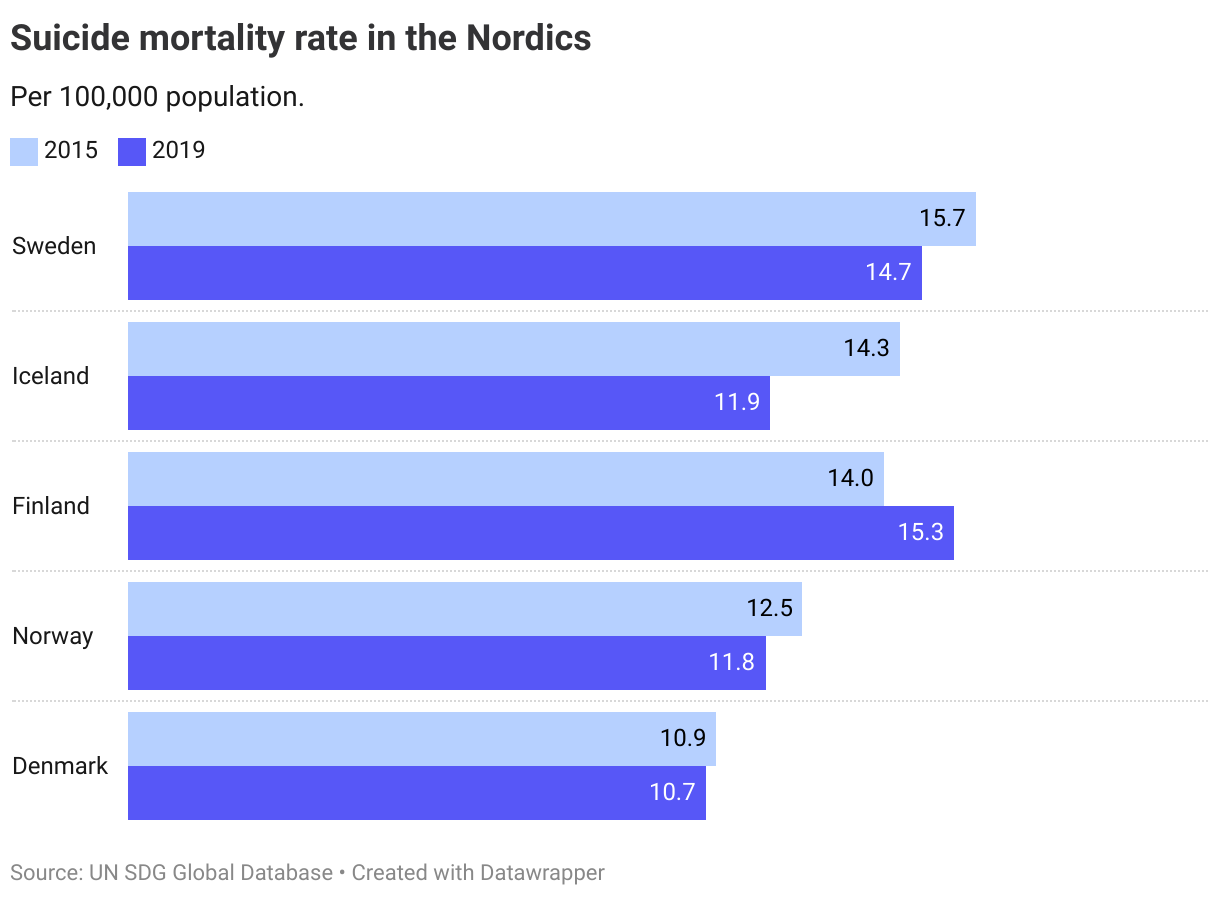
The combined assessment for both indicators is that all the Nordics are at long distance and not progressing towards the target.
Denmark
Long distance to target, not progressing
Finland
Long distance to target, not progressing
Iceland
Long distance to target, not progressing
Norway
Long distance to target, not progressing
Sweden
Long distance to target, not progressing
Target 3.5
Strengthen the prevention and treatment of substance abuse, including narcotic drug abuse and harmful use of alcohol
| 3.5.1 | Coverage of treatment interventions (pharmacological, psychosocial and rehabilitation and aftercare services) for substance use disorders |
| 3.5.2 | Alcohol per capita consumption (aged 15 years and older) within a calendar year in litres of pure alcohol |
Global trends
No recent data is available at a global and regional level for the first indicator (3.5.1) on coverage of treatment interventions.
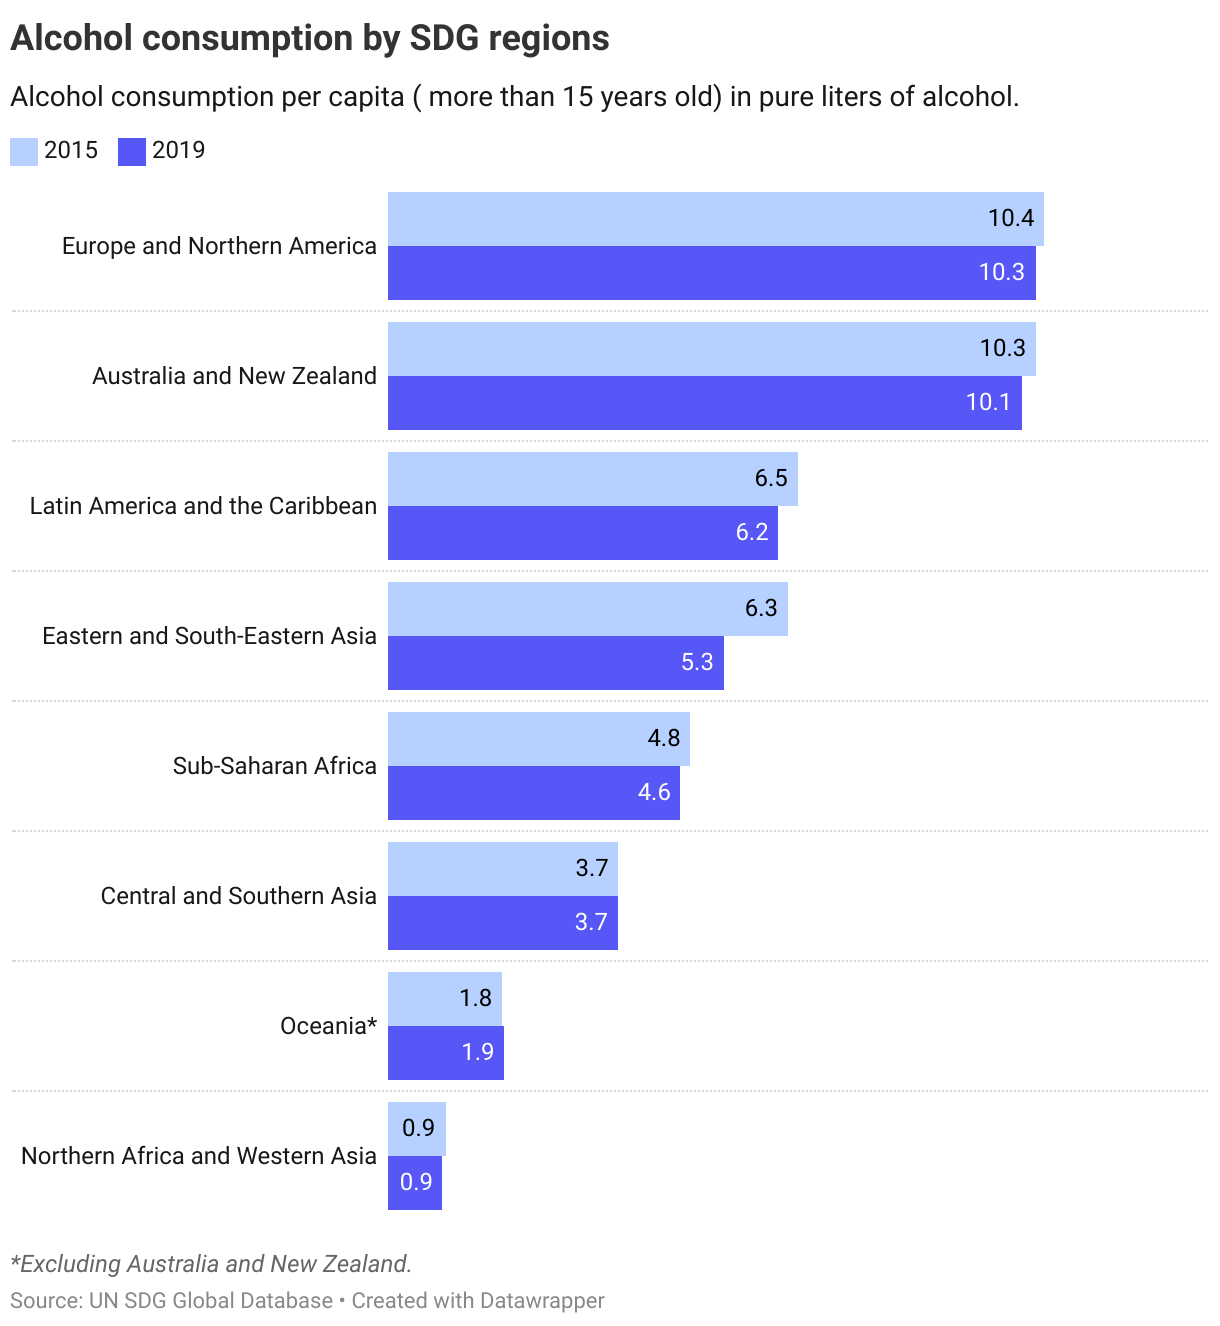
For the second indicator, alcohol consumption, data from 2019 shows that consumption globally was higher in 2019 than in 2000. Since 2015 it has declined slightly from 5.9 liters of pure alcohol per capita per year, to 5.5 liters. However, this is still higher than the levels recorded in 2000.
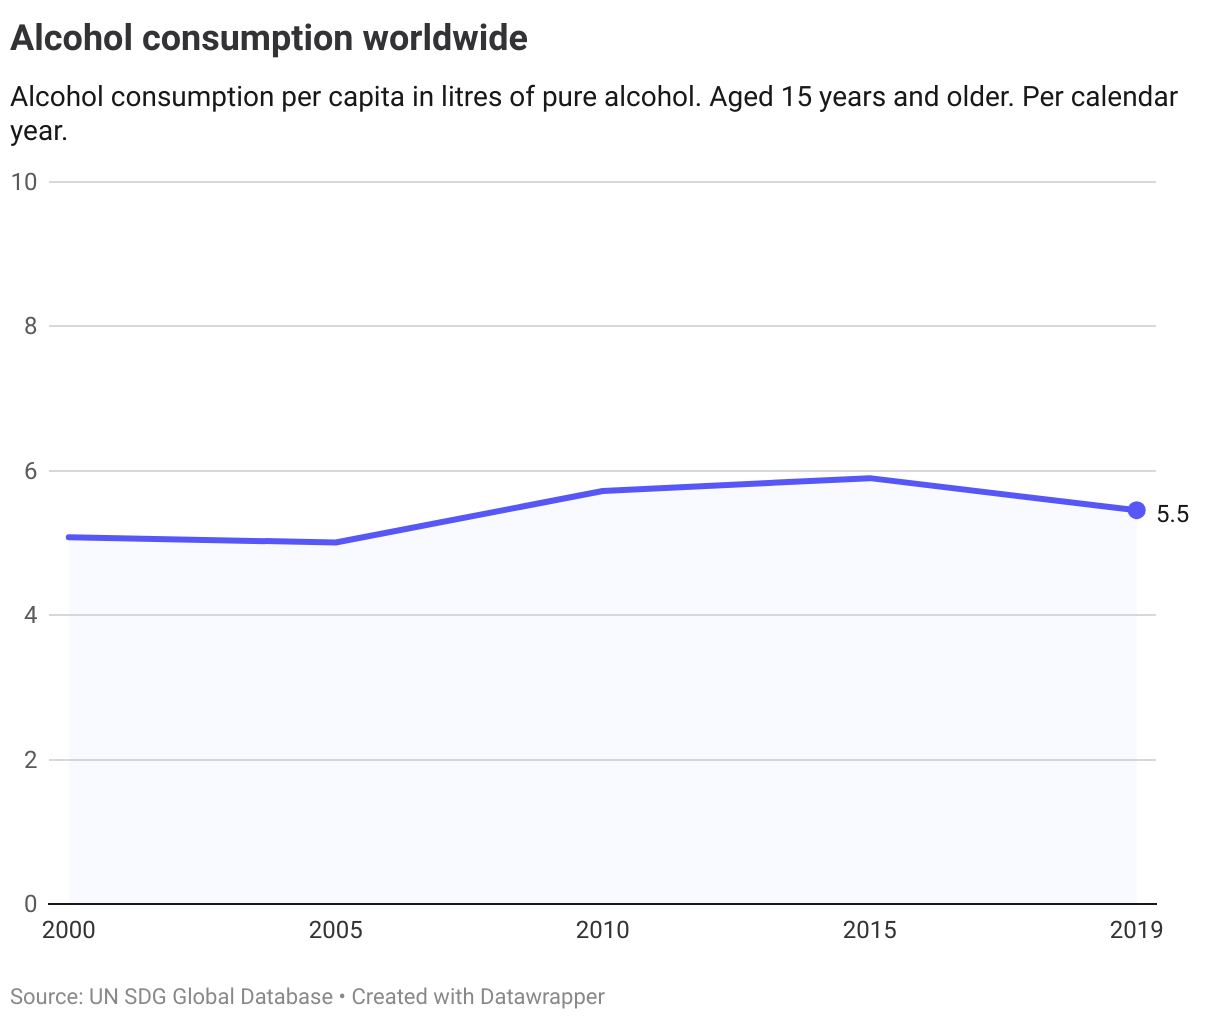
Europe and Northern America have the highest consumption levels, followed by Australia and New Zealand. Consumption levels in these two regions are almost twice as high as the global average.
The Nordics
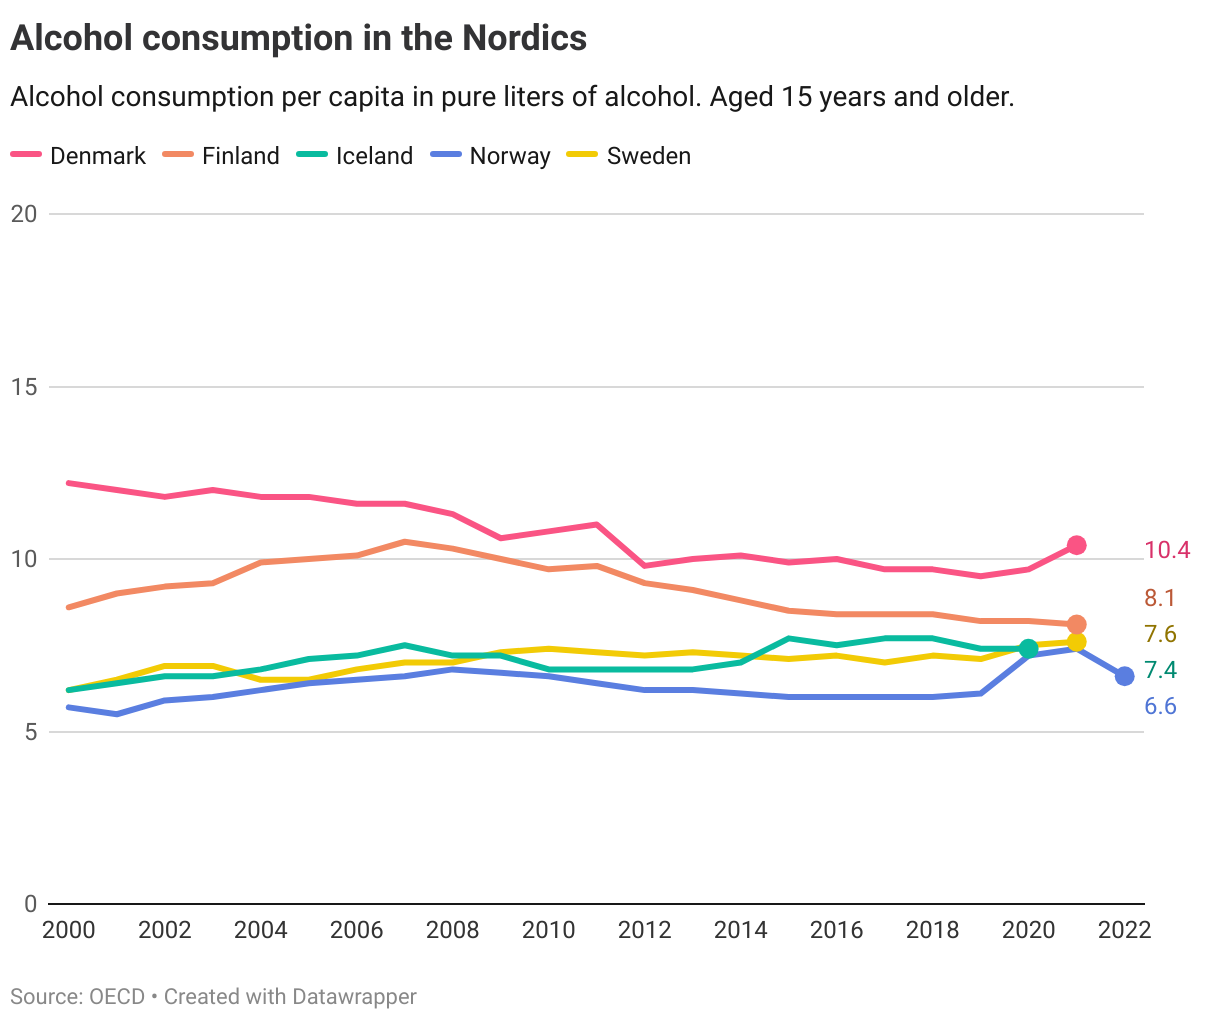
OECD data on alcohol consumption in the Nordics shows a mixed picture. The OECD has set the target at lower than 8.5 liters in 2030. Currently, all the Nordics except Denmark are below this this level.
A combined assessment of both current levels and future projections based on past trends, shows that only Finland and Norway have a high likelihood of still being below the target level in 2030.
Denmark
Long distance to target but progressing
Finland
Target is met
Iceland
Short distance to target
Norway
Target is met
Sweden
Short distance to target
Target 3.6
By 2020, halve the number of global deaths and injuries from road traffic accidents
| 3.6.1 | Death rate due to road traffic injuries |
Global trends
1.3 million people were killed from road injuries globally in 2019, compared to 1.15 million in 2000. Despite the absolute increase, the rate of death relative to the size of the global population has decreased over the past two decades. In 2019 it stood at 16.7 deaths per 100,000 population, compared to 17.0 in 2015 and 19.0 in 2000.
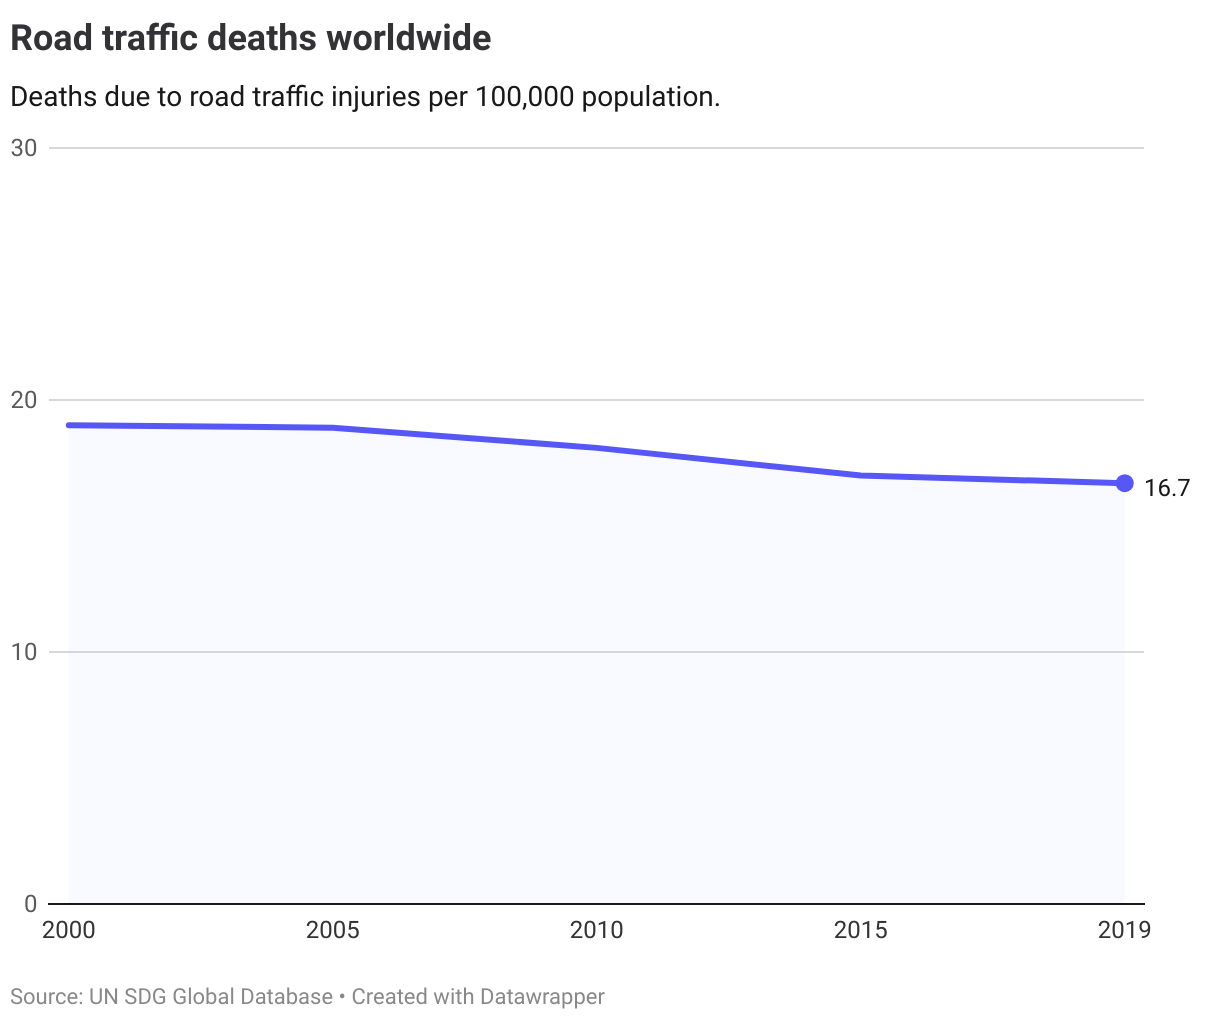
This indicates that road safety has improved in light of increasing population growth and increased motorization worldwide. Yet, the target of halving the number of global deaths and injuries from road traffic was not reached by 2020 and the target has been extended to 2030. According to the WHO, road traffic injuries are the leading cause of death for children and young adults aged 5-29 years.
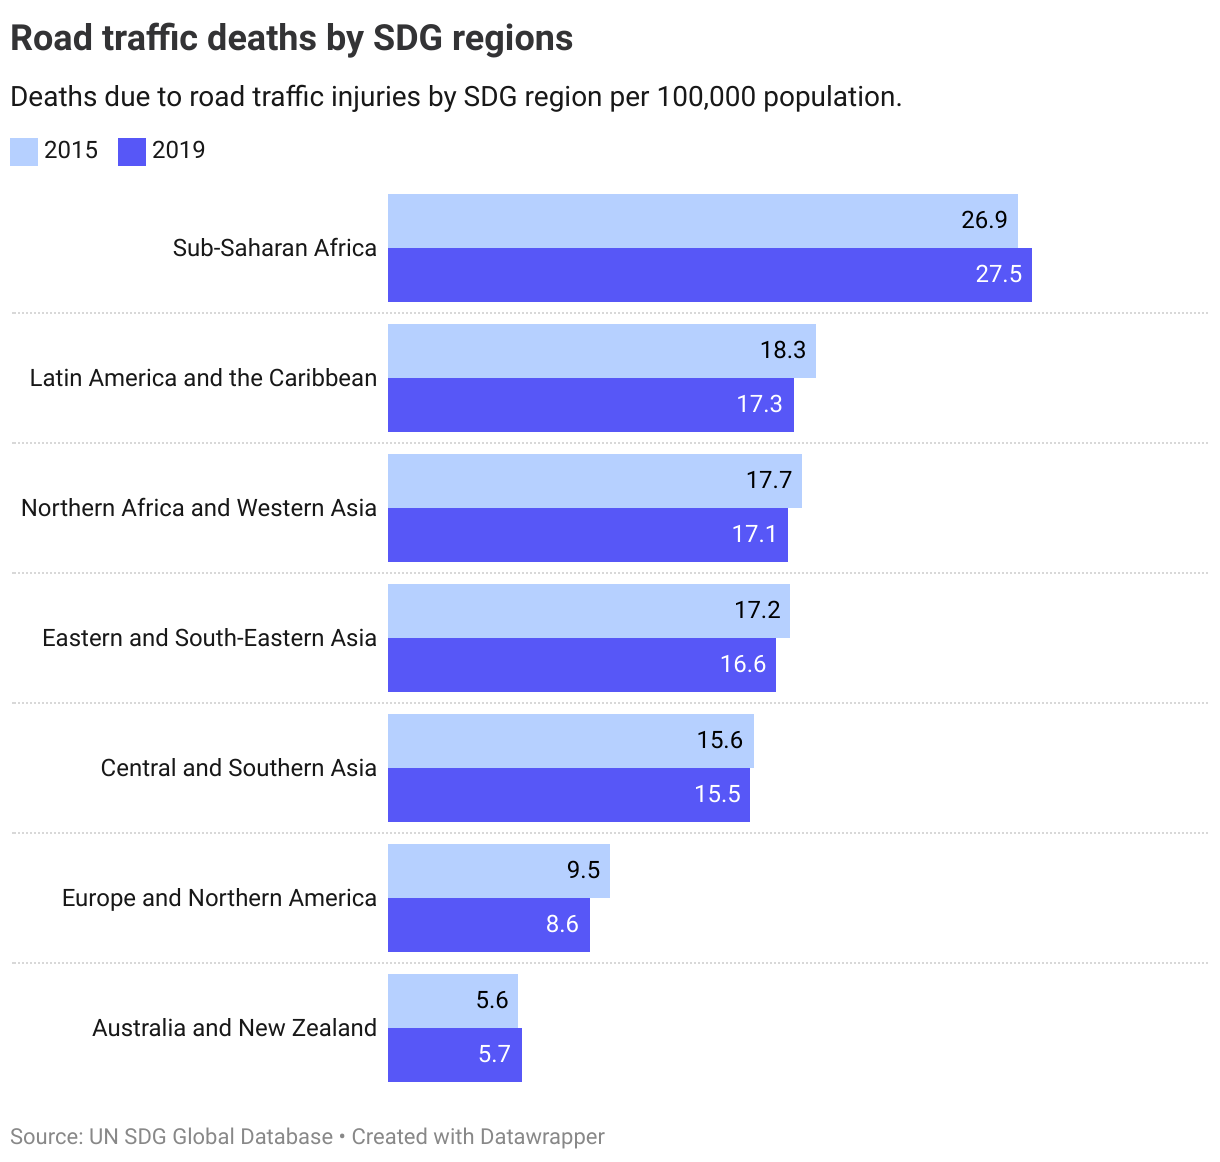
At a regional level, the highest death rates caused by road traffic injuries are in Sub-Saharan Africa and the lowest in Australia and New Zealand.
The Nordics
The OECD has set a benchmark of reducing death rates to 2.7 (half the median rate for OECD countries in 2015). Finland is currently the only country above this currently, though it has seen a declining death rate in recent years.
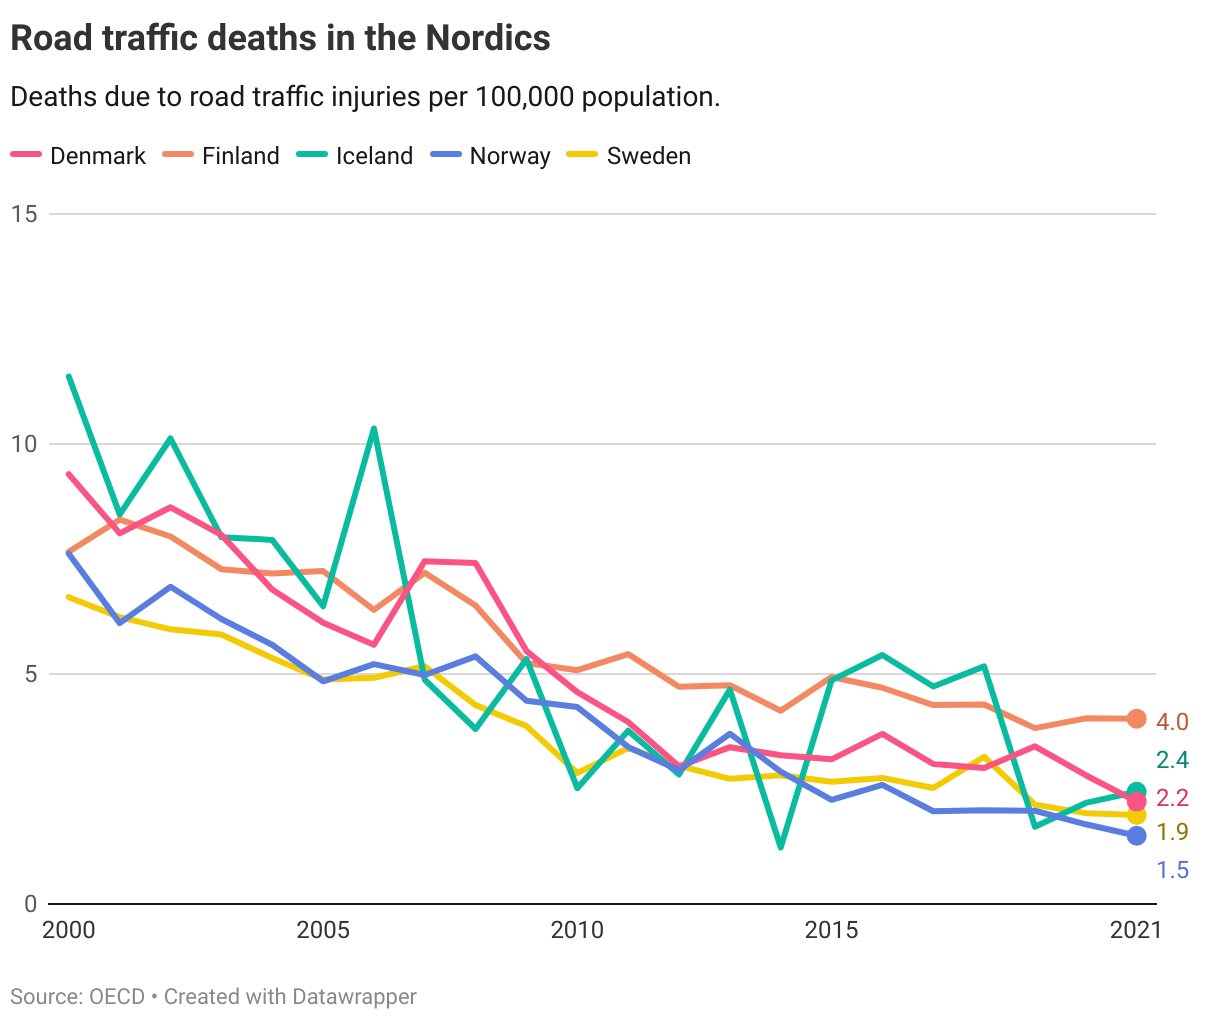
When incorporating past trends to simulate future likelihood of staying below the 2.7 target, Finland and Iceland have a low likelihood of achieving it in 2030, even if Iceland currently is below the target. Denmark, Norway and Sweden have met the target and are on track to staying below it in 2030.
Denmark
Target is met
Finland
Short distance to target
Iceland
Short distance to target
Norway
Target is met
Sweden
Target is met
Target 3.7
By 2030, ensure universal access to sexual and reproductive health-care services, including for family planning, information and education, and the integration of reproductive health into national strategies and programmes
| 3.7.1 | Proportion of women of reproductive age (aged 15–49 years) who have their need for family planning satisfied with modern methods |
| 3.7.2 | Adolescent birth rate (aged 10–14 years; aged 15–19 years) per 1,000 women in that age group |
Global trends
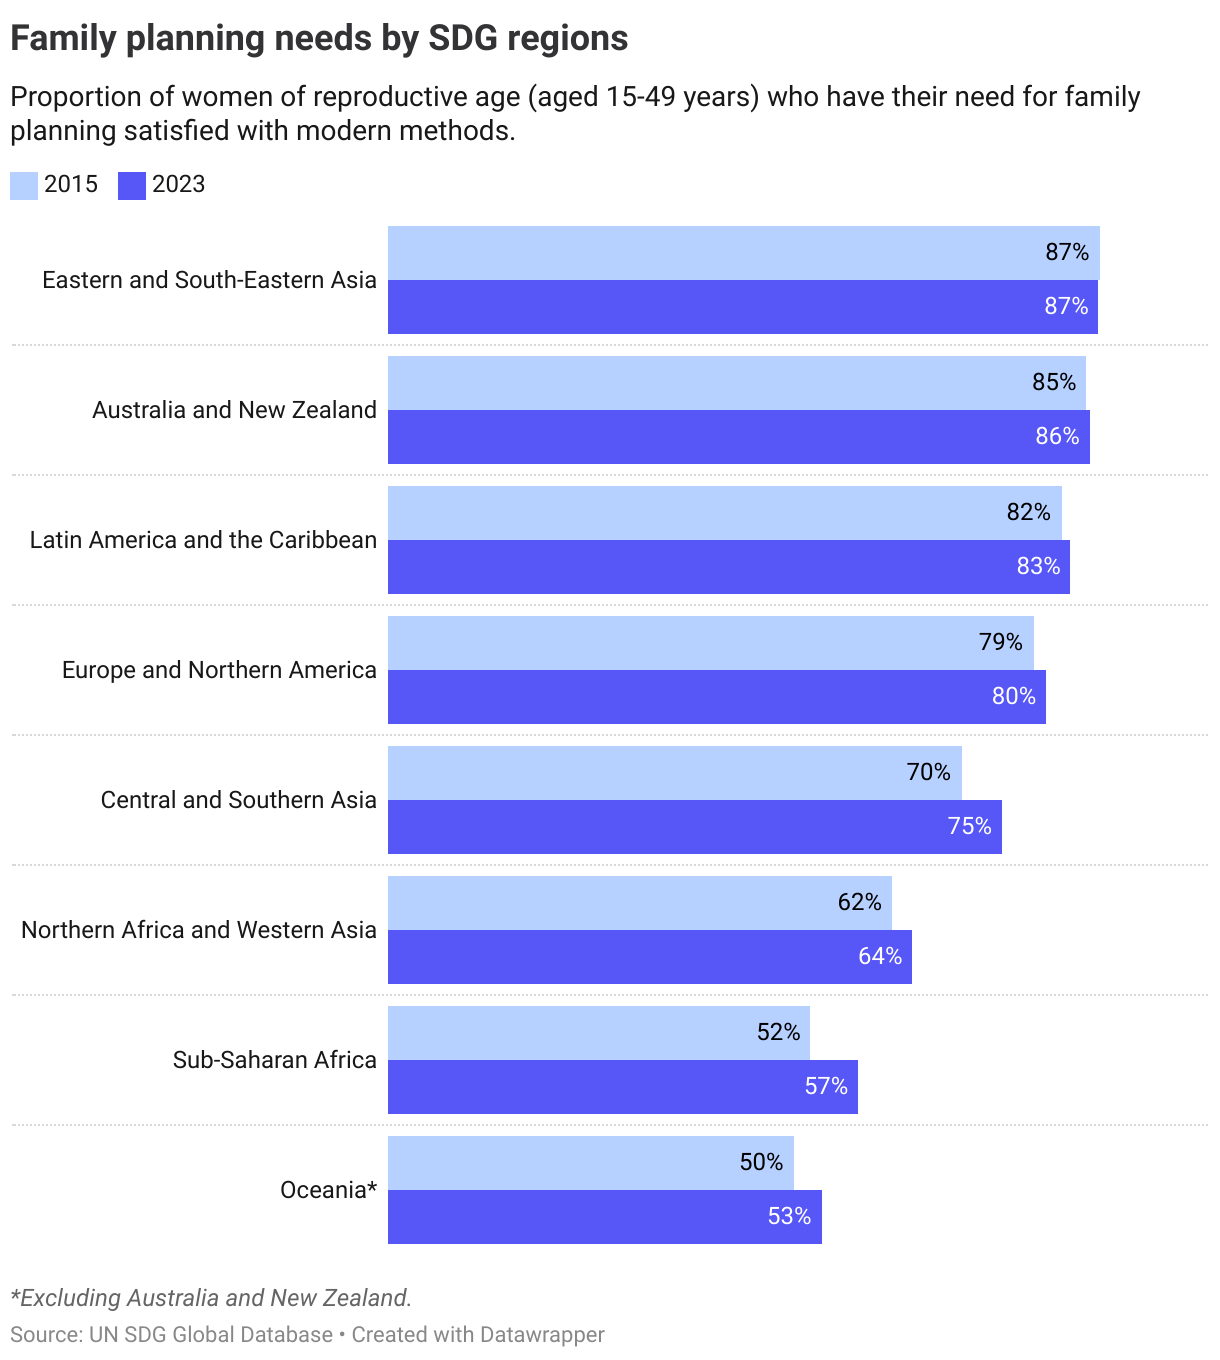
3.7.1. Family planning needs
Globally, 78% of women of reproductive age had their family planning needs met by modern contraceptive methods in 2023, a slight increase from 2015. No explicit target level has been set for 2030 at a global level for this indicator.
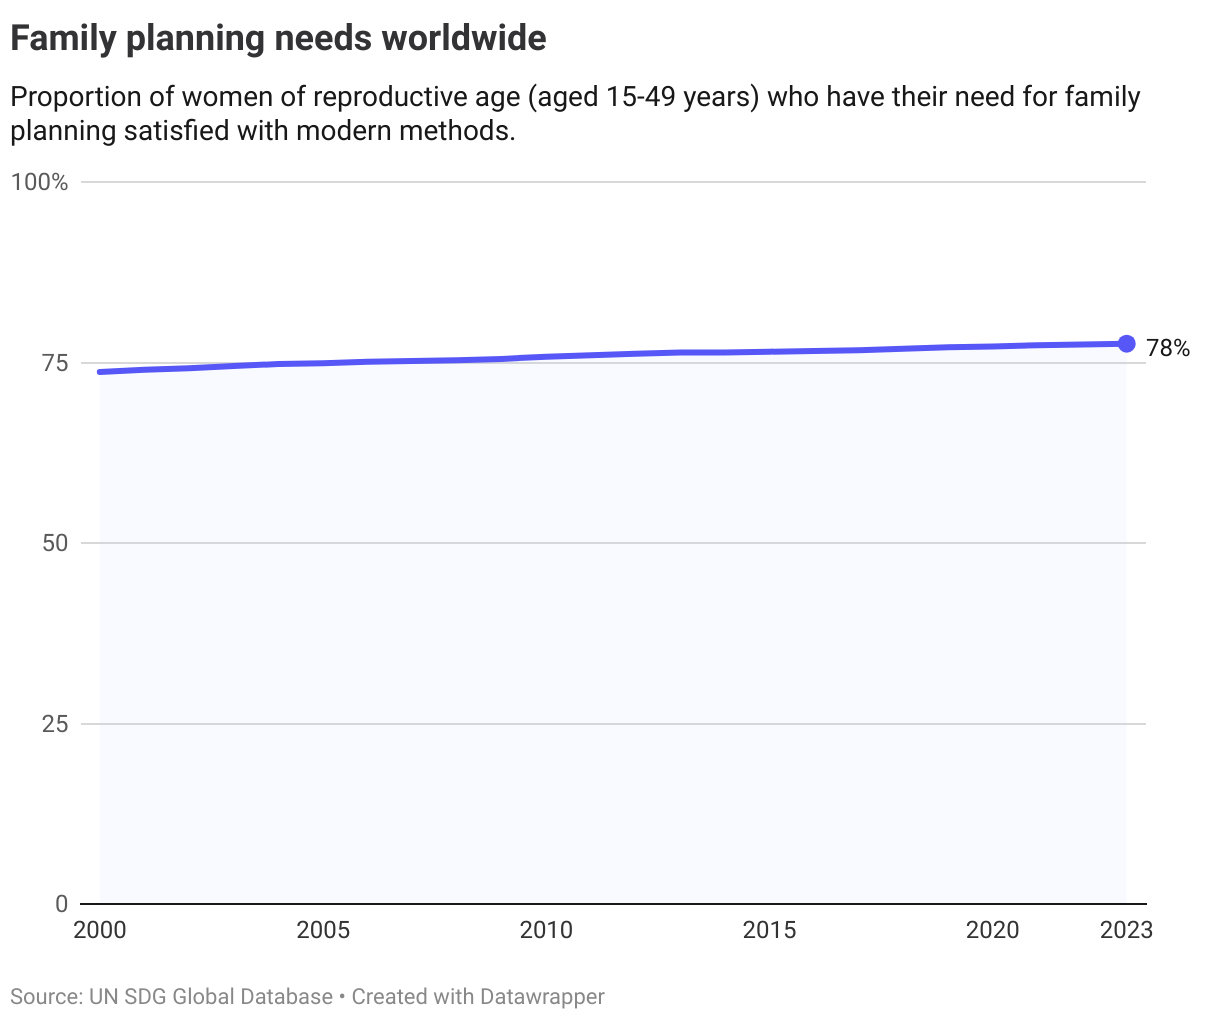
While the share has remained relatively unchanged for the last few years at a global level, it has increased significantly in many regions where coverage is low.
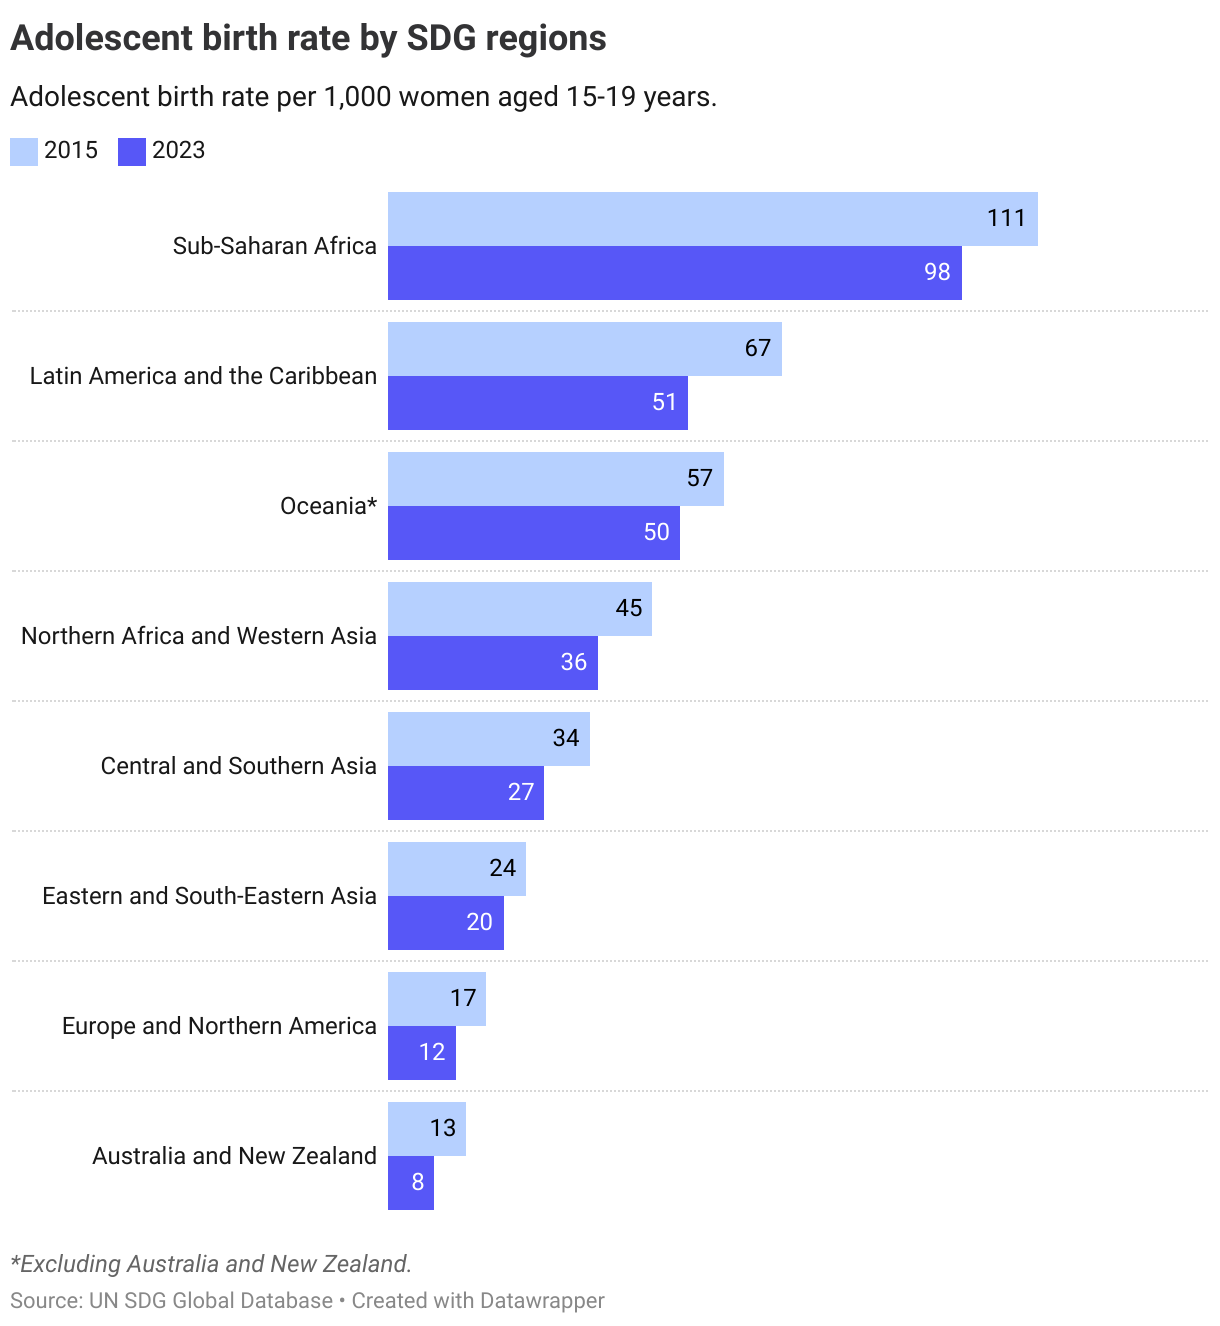
3.7.2. Adolescent birth rate
The adolescent birth rate, measured as births per 1,000 adolescent women from 15-19 years, has decreased over the past years. Note that also for this indicator, no explicit target level has been set for 2030 at a global level.
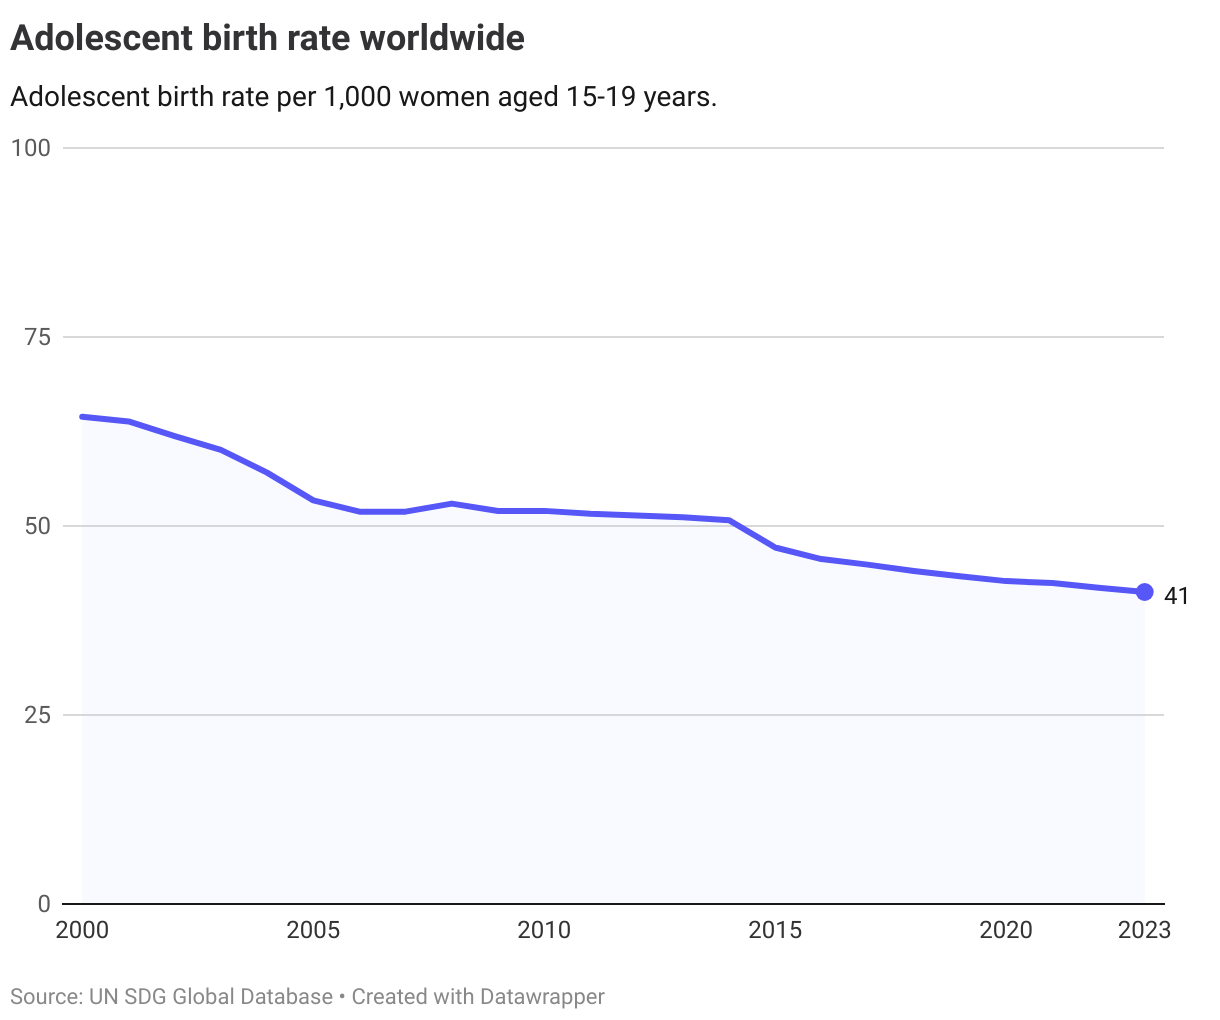
All regions have seen a decline since 2015 in the adolescent birth rate.
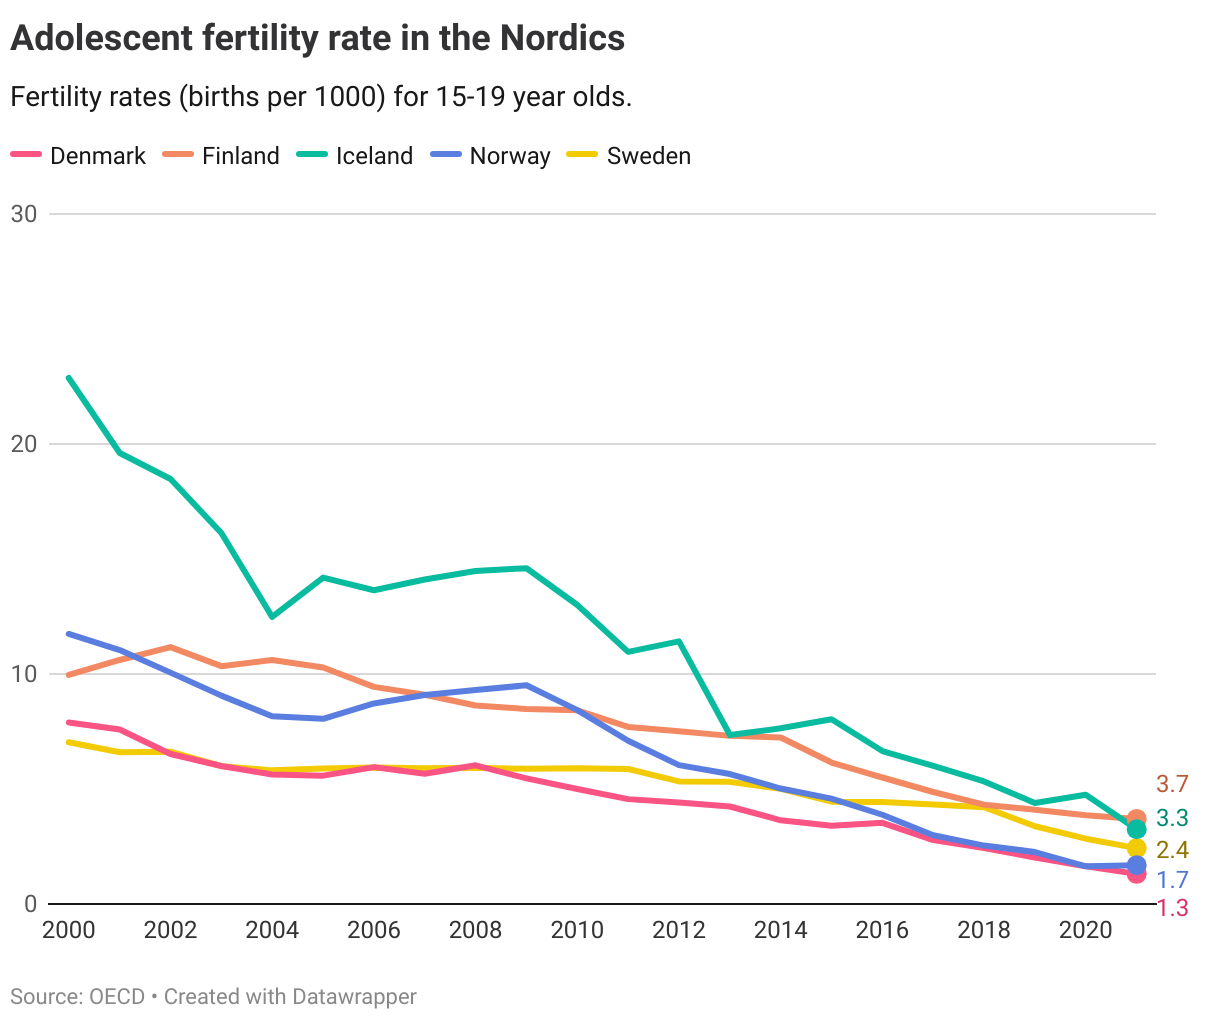
The Nordics
Data for the Nordic countries is only available for the second indicator on adolescent birth rate, showing low rates compare to other countries. The OECD has operationalised the target for member countries at 3 per 1000 women in 2030, a level of which Denmark, Norway and Sweden have already met, and Finland and Iceland are on track meet by 2030.
Denmark
Target is met
Finland
Target is on track
Iceland
Target is on track
Norway
Target is met
Sweden
Target is met
Target 3.8
Achieve universal health coverage, including financial risk protection, access to quality essential health-care services and access to safe, effective, quality and affordable essential medicines and vaccines for all
| 3.8.1 | Coverage of essential health services |
| 3.8.2 | Proportion of population with large household expenditures on health as a share of total household expenditure or income |
Global trends
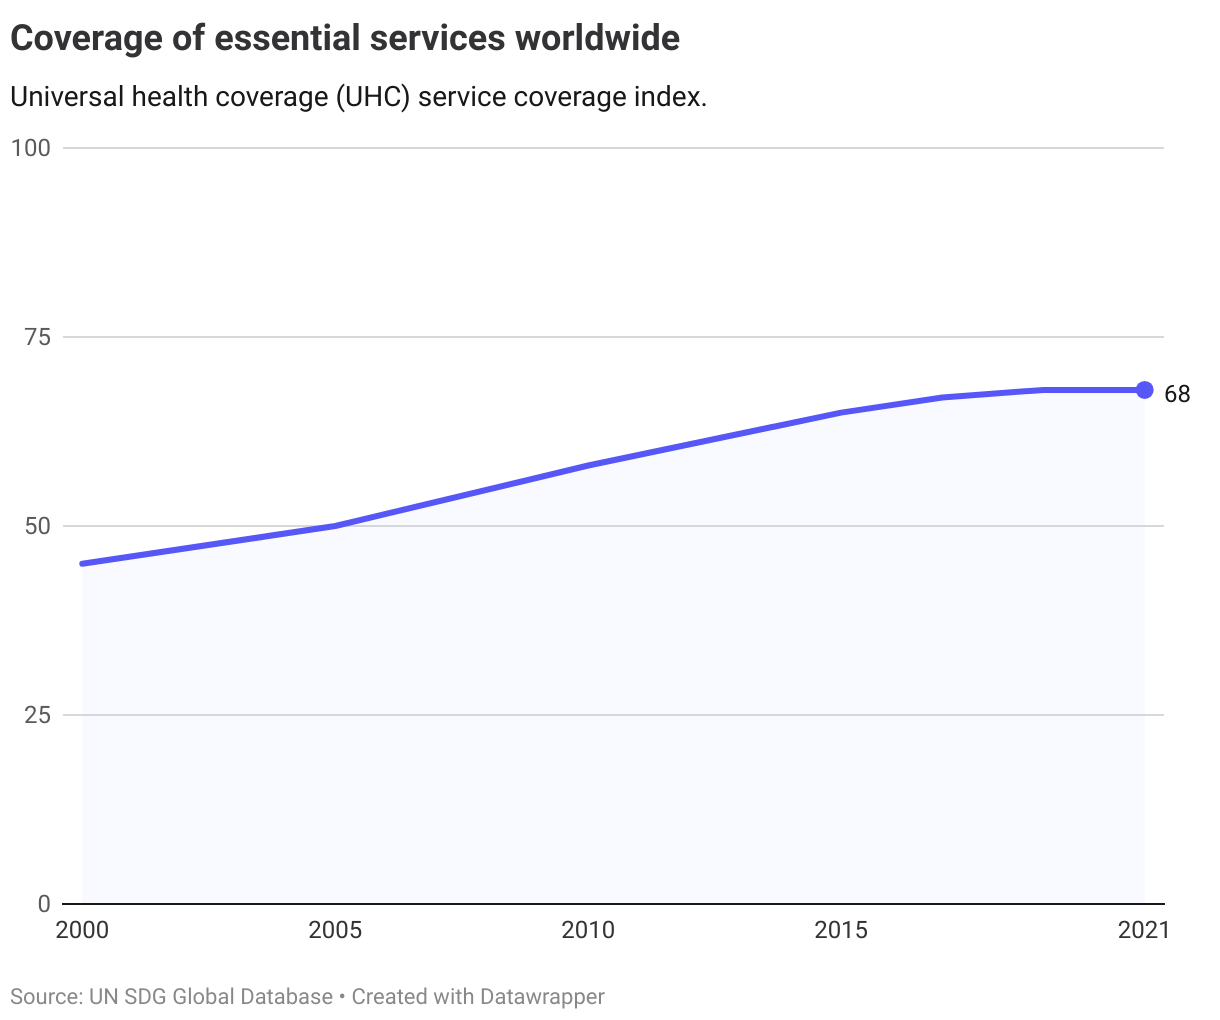
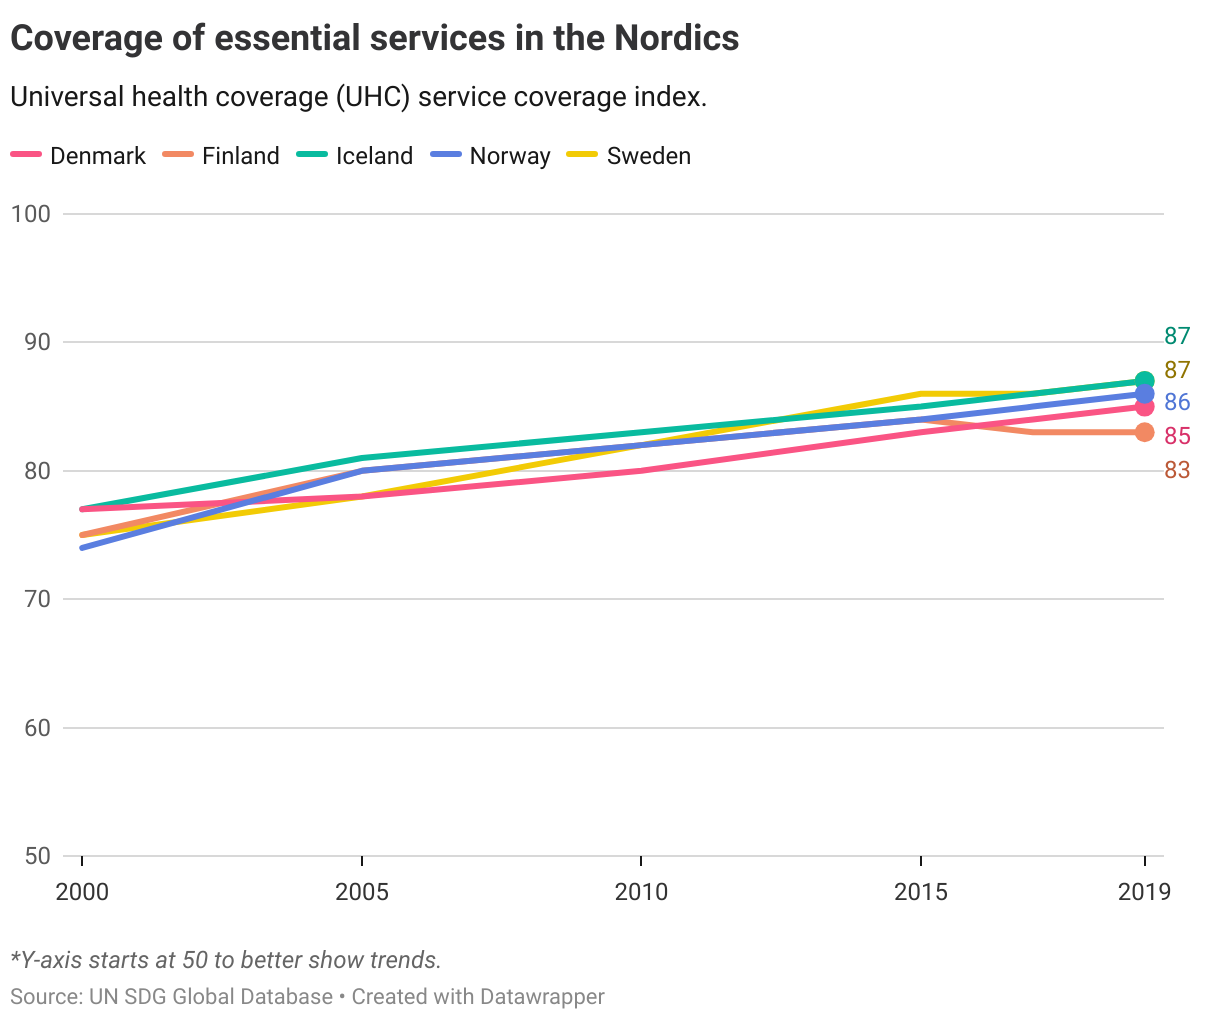
3.8.1. Essential health services
Coverage of essential health services is measured by the WHO Universal Health Care Service Index Coverage. The index is reported on a scale from 0 to 100, where a higher score means a higher coverage. The 14 indicators that form part of the index include 1. Reproductive, maternal, newborn and child health 2. Infectious diseases 3. Noncommunicable diseases 4. Service capacity and access to essential health services.
The score has improved from 45 in 2000 to 65 in 2015 and 68 in 2021, indicating that more people have gained access to essential services.
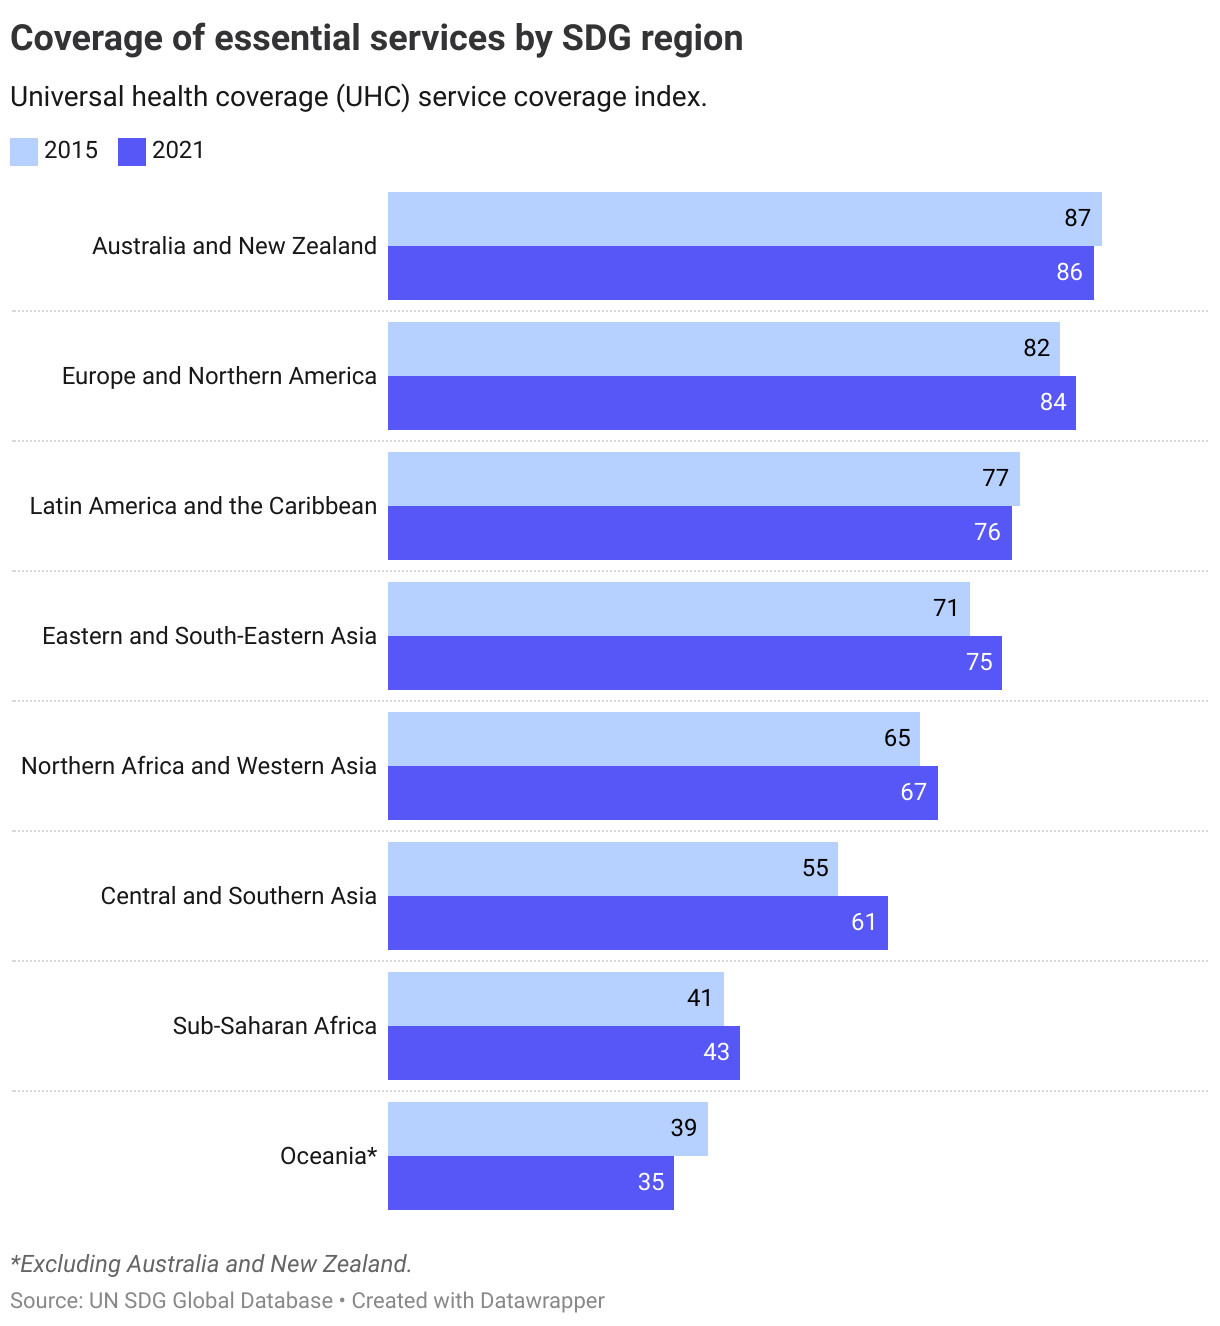
Since 2015, all regions except Australia and New Zealand and the rest of Oceania have improved their converage scores.
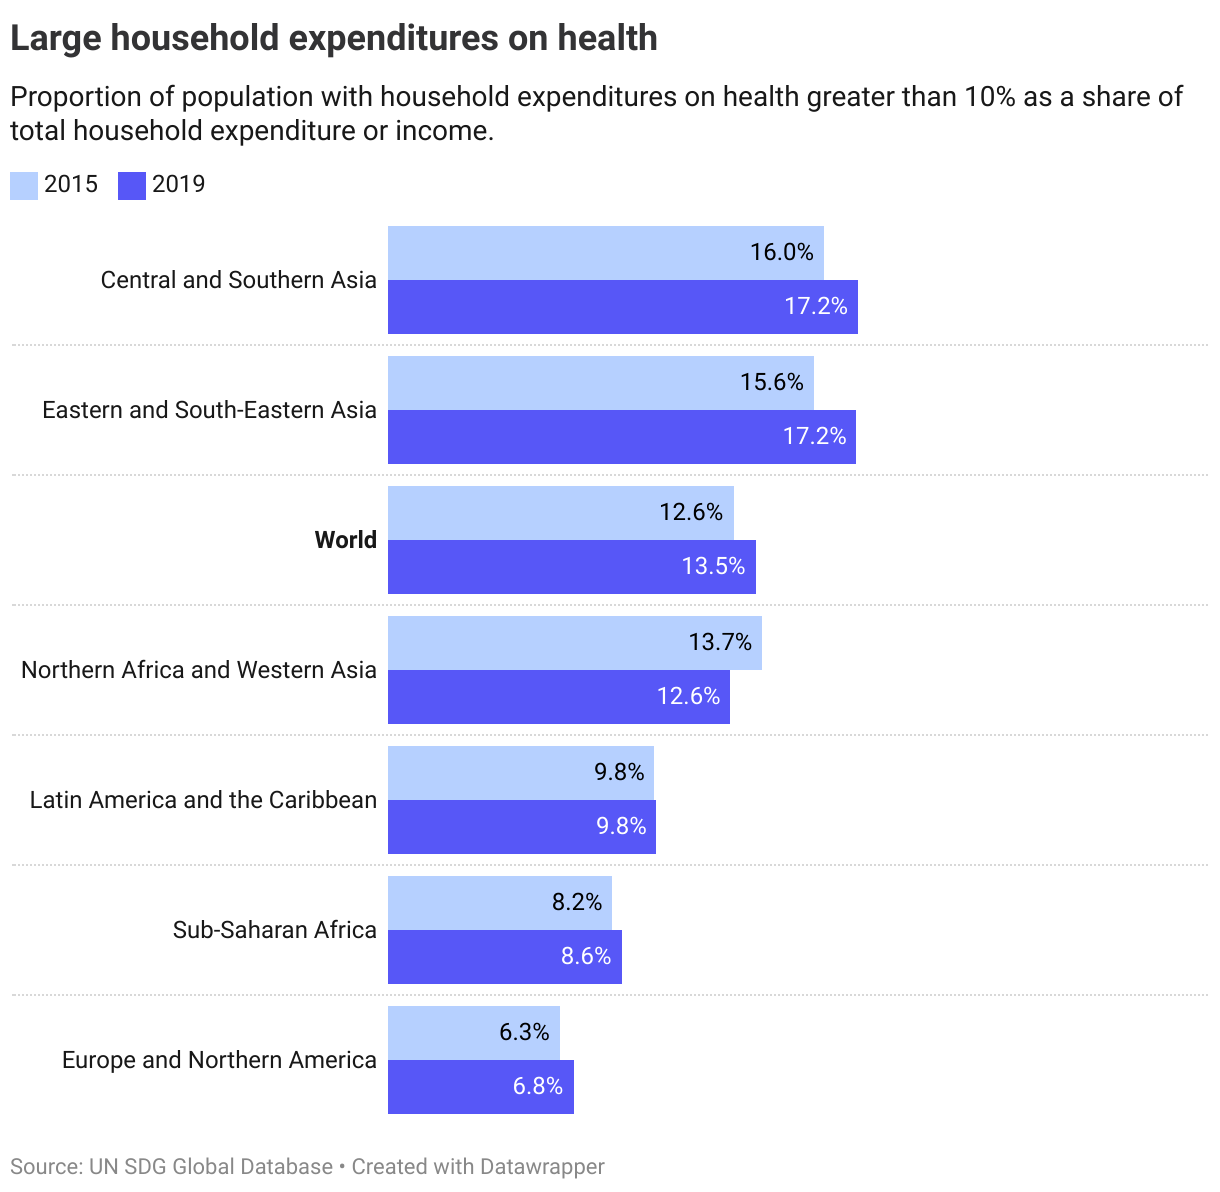
3.8.2. Household expenditures on health
The latest data on household expenditures on health is from 2019, showing that already going into the pandemic, a rising share of the global population was having large out-of-pocket household expenditures on health (defined as spending more than 10% on household budget on health). The share has risen in most regions, with the largest increase in Eastern and South-Eastern Asia.
The Nordics
All the Nordic countries have near-universal coverage of core health services (indicator 3.8.1), and thus have a high score in the UHC service coverage index. Yet, as with other OECD countries, despite increasing coverage (as measured by the index) over recent years, none are on track towards a full score (defined as above 97) by 2030.
Data on household expenditure on health (3.8.2) is insufficient for a comparative analysis most recent data from 2010.
Denmark
Long distance to target but progressing
Finland
Long distance to target but progressing
Iceland
Long distance to target but progressing
Norway
Long distance to target but progressing
Sweden
Long distance to target but progressing
Target 3.9
By 2030, substantially reduce the number of deaths and illnesses from hazardous chemicals and air, water and soil pollution and contamination
| 3.9.1 | Mortality rate attributed to household and ambient air pollution |
| 3.9.2 | Mortality rate attributed to unsafe water, unsafe sanitation and lack of hygiene (exposure to unsafe Water, Sanitation and Hygiene for All (WASH) services) |
| 3.9.3 | Mortality rate attributed to unintentional poisoning |
Global trends
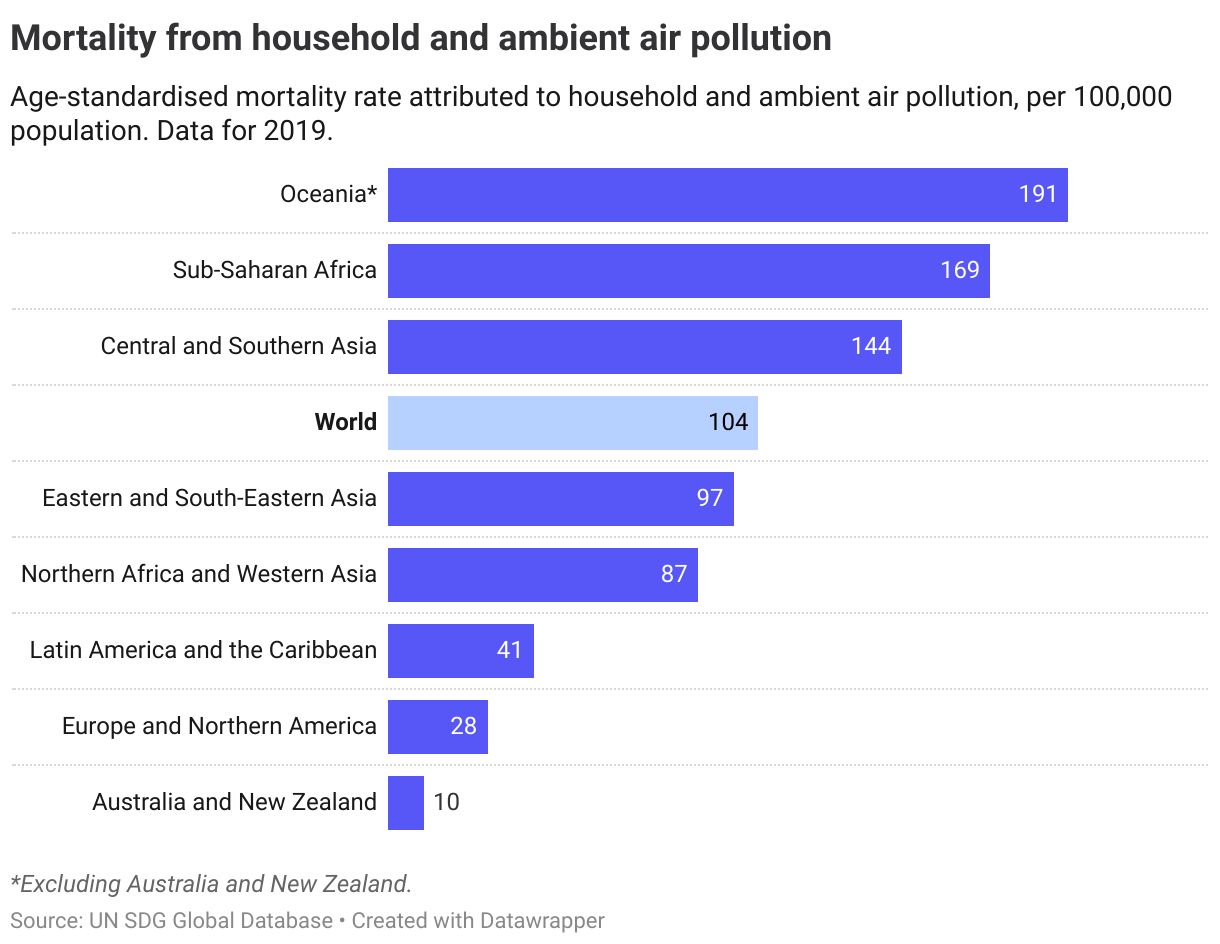
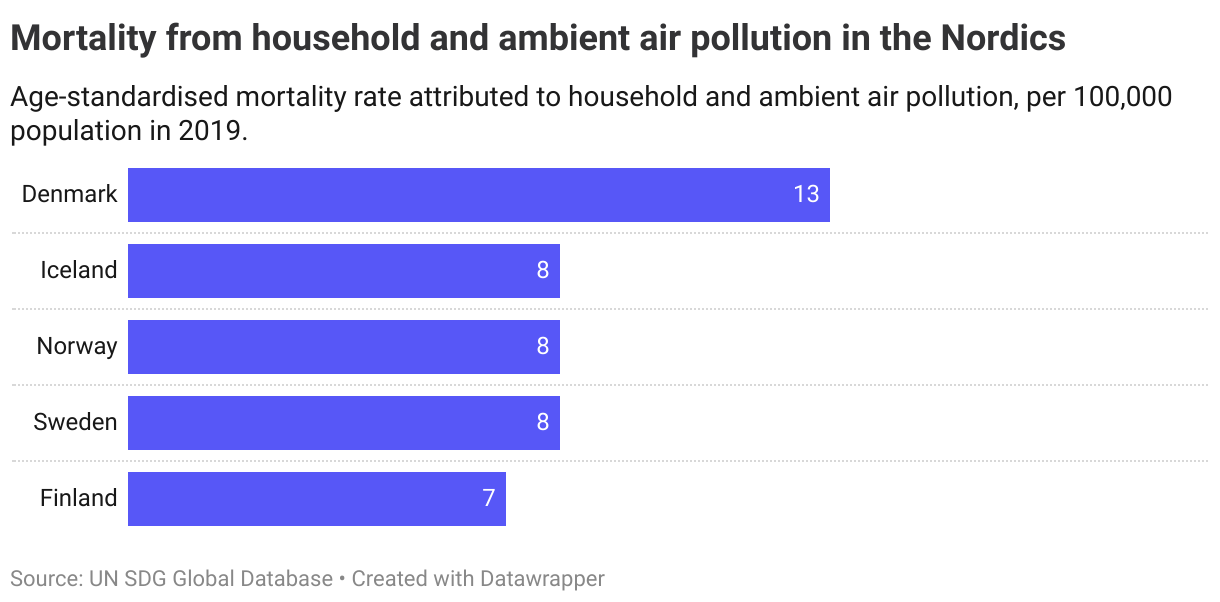
3.9.1. Household and ambient air pollution
At a global level, the mortality rate attributed to household and ambient air pollution was 104 persons per 100,000 population in 2019. The mortality rate was highest in Oceania followed by Sub-Saharan Africa and Central and Southern Asia.
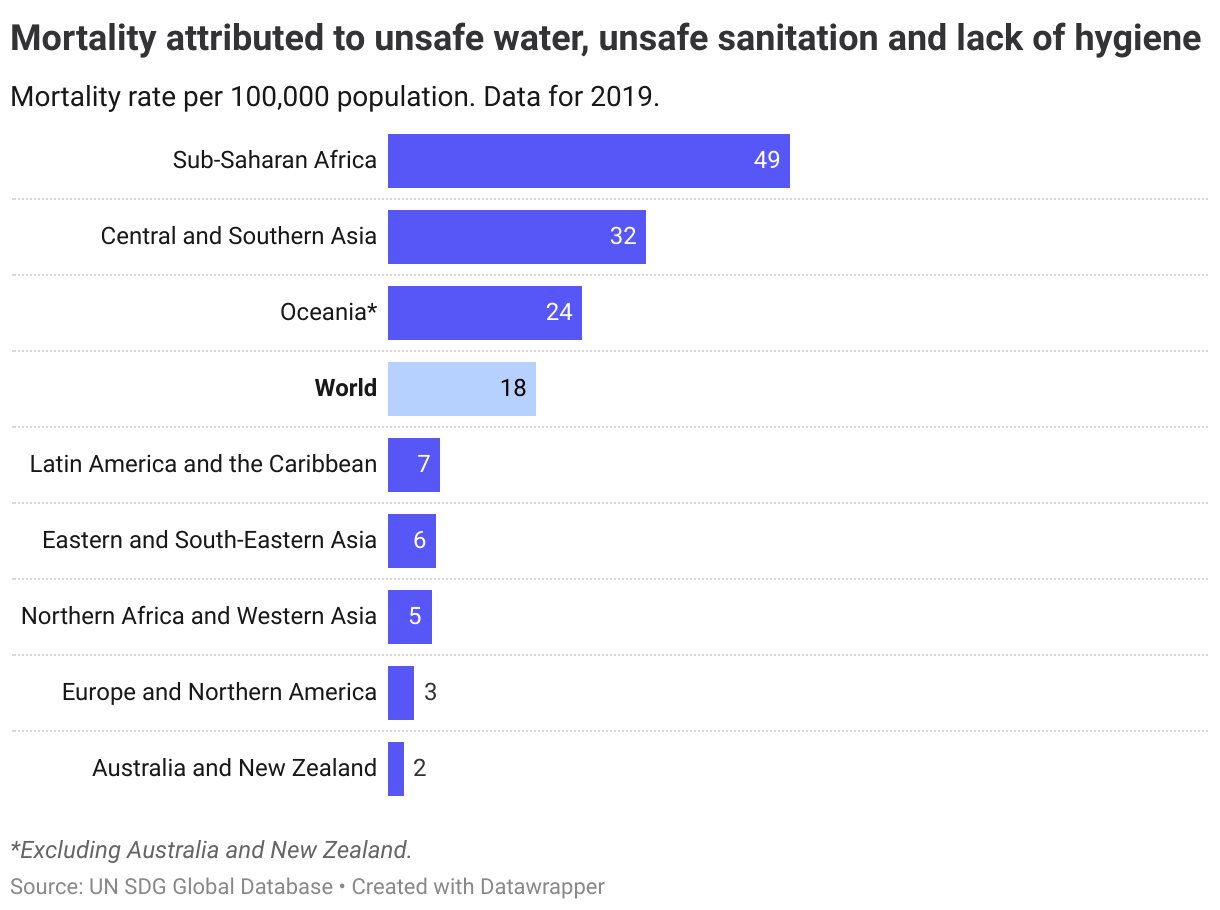
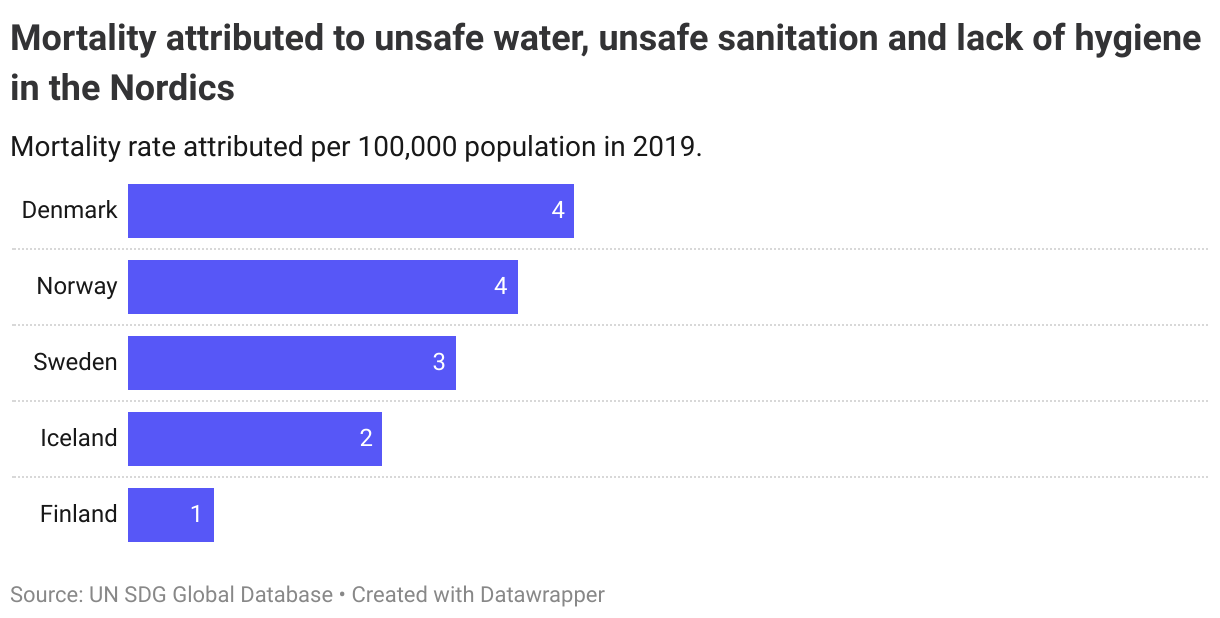
3.9.2. Unsafe water and sanitation
The mortality rate attributed to unsafe water, sanitation, and lack of hygiene at the global level was 18 persons per 100,000 population in 2019. In most regions, it was below 10 per 100,000, while it was highest in Sub-Saharan Africa (49) and Central and Southern Asia (32) in 2019.
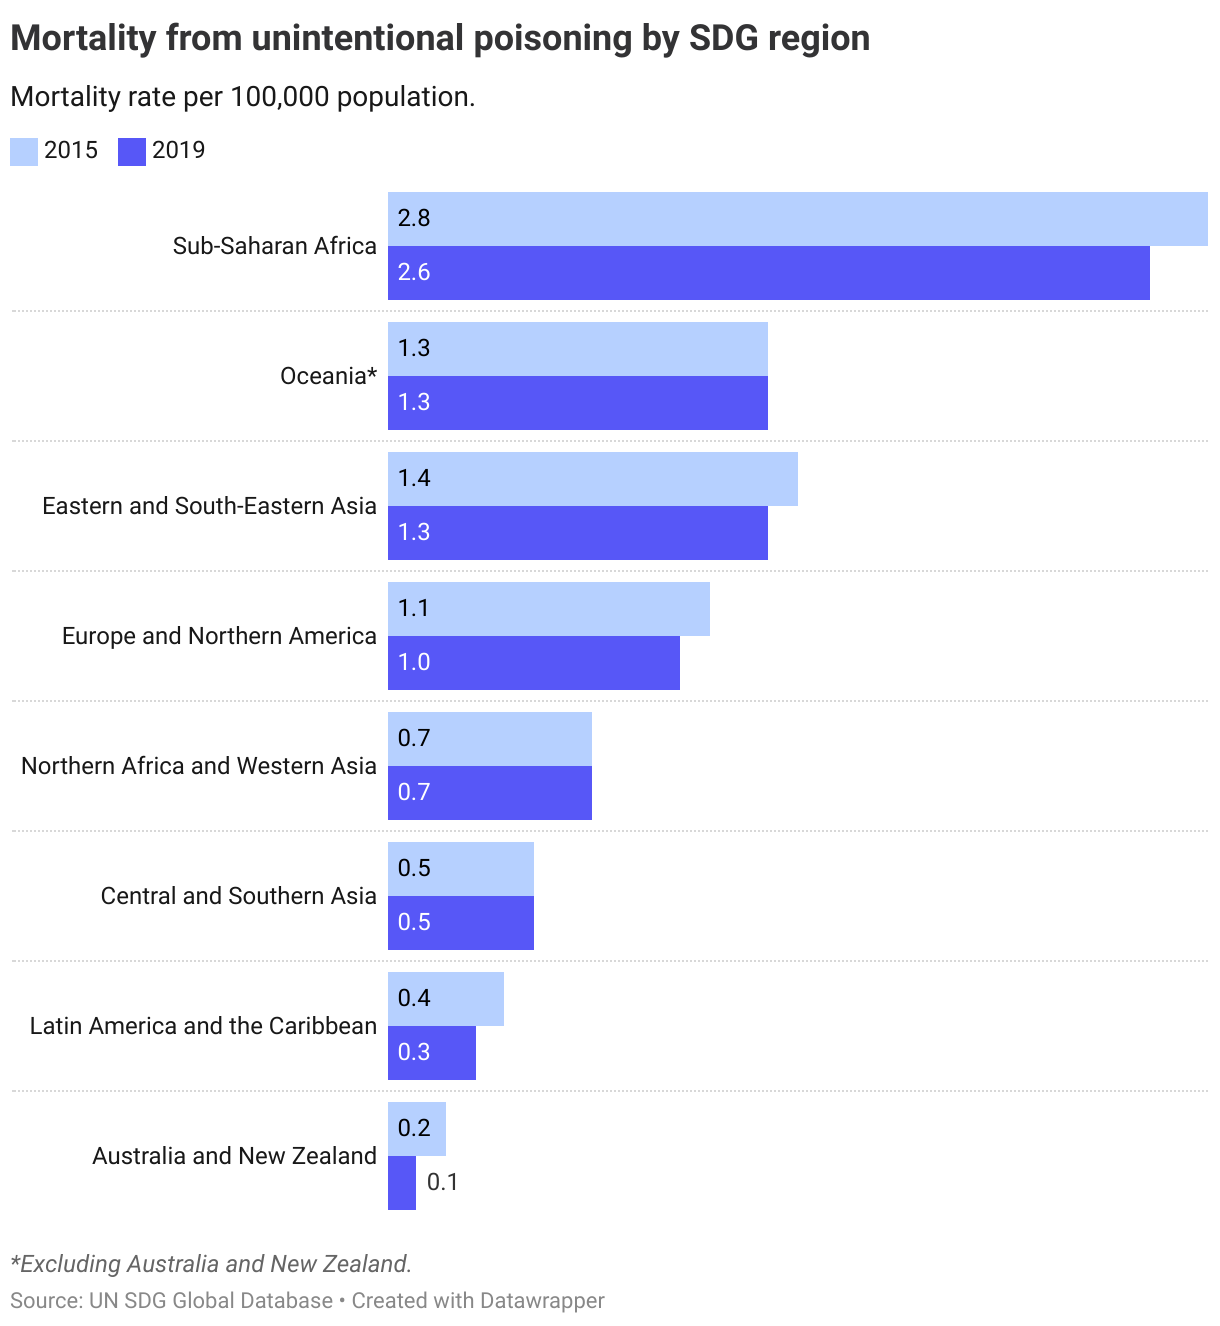
3.9.3. Unintentional poisoning
The third indicator, mortality attributed to unintentional poisoning, has declined slightly since 2015. Unintentional poisoning is defined as death caused by chemicals, pesticides, kerosene, carbon monoxide and medicines, or can be the result of environmental contamination or occupational chemical exposure.
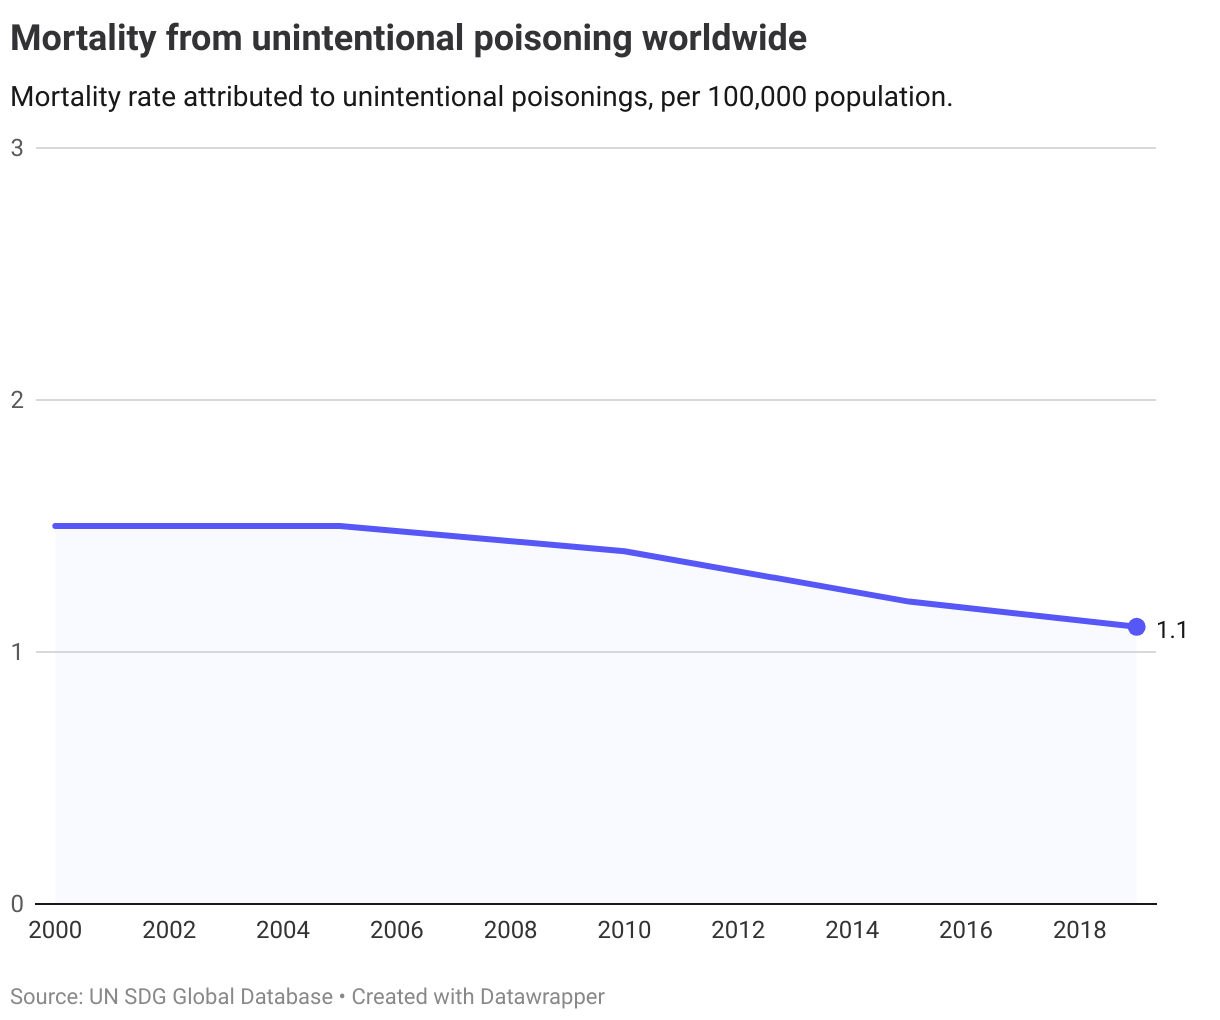
There are significant regional differences, with mortality rates in Sub-Saharan Africa at 2.6 (highest) compared to 0.1 in Australia and New Zealand (lowest). Compared to 2015, most regions have seen lower mortality rates in the latest year.
The Nordics
The OECD has operationalised the target as lower than 3 in 100 000 mortality rate on all three indicators.
Currently, all the Nordics are above this level for household and ambient pollution (3.9.1), according to the latest data from 2019.
For mortality attributed to unsafe water, sanitation and lack of hygiene (3.9.2) the Nordics are closer to the target threshold of 3 per 100 000, yet only Finland and Iceland are below.
OECD age-standardised rates for accidental poisoning (3.9.3) show that none of the Nordics are below the target threshold on this indicator. Additionally, none have managed to significally reduce accidental mortality rates over the past two decades.
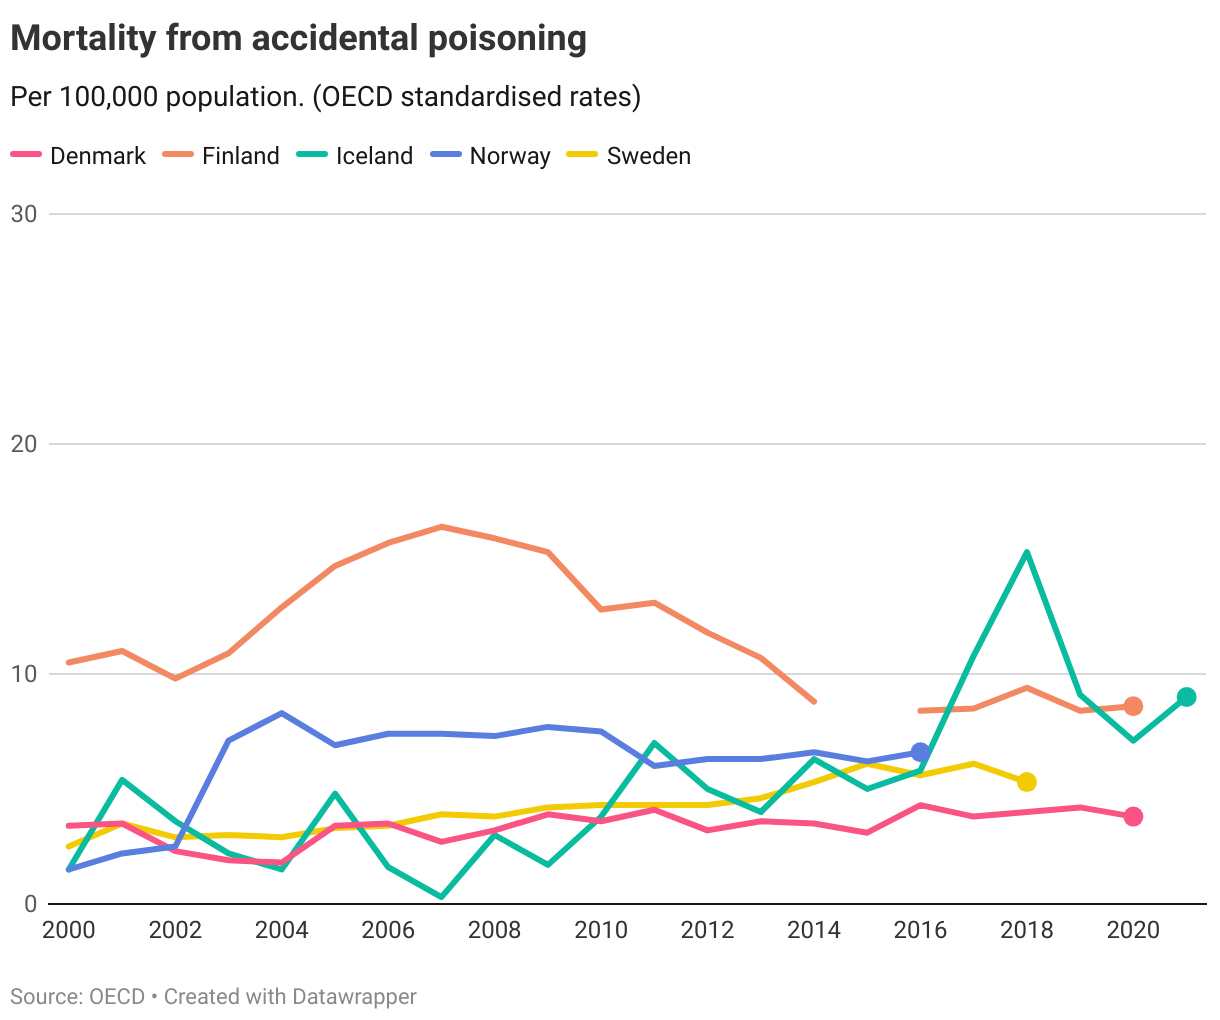
The combined assessment of the three indicators discussed above is that none of the Nordics are on track to reach the targets by 2030.
Denmark
Long distance to target, not progressing
Finland
Short distance to target
Iceland
Short distance to target
Norway
Short distance to target
Sweden
Short distance to target
Target 3.a
Strengthen the implementation of the World Health Organization Framework Convention on Tobacco Control in all countries, as appropriate
| 3.a.1 | Age-standardized prevalence of current tobacco use among persons aged 15 years and older |
Global trends
The global average tobacco use rate has declined steadily over the past two decades. In 2020 22% of the global population was using tobacco.
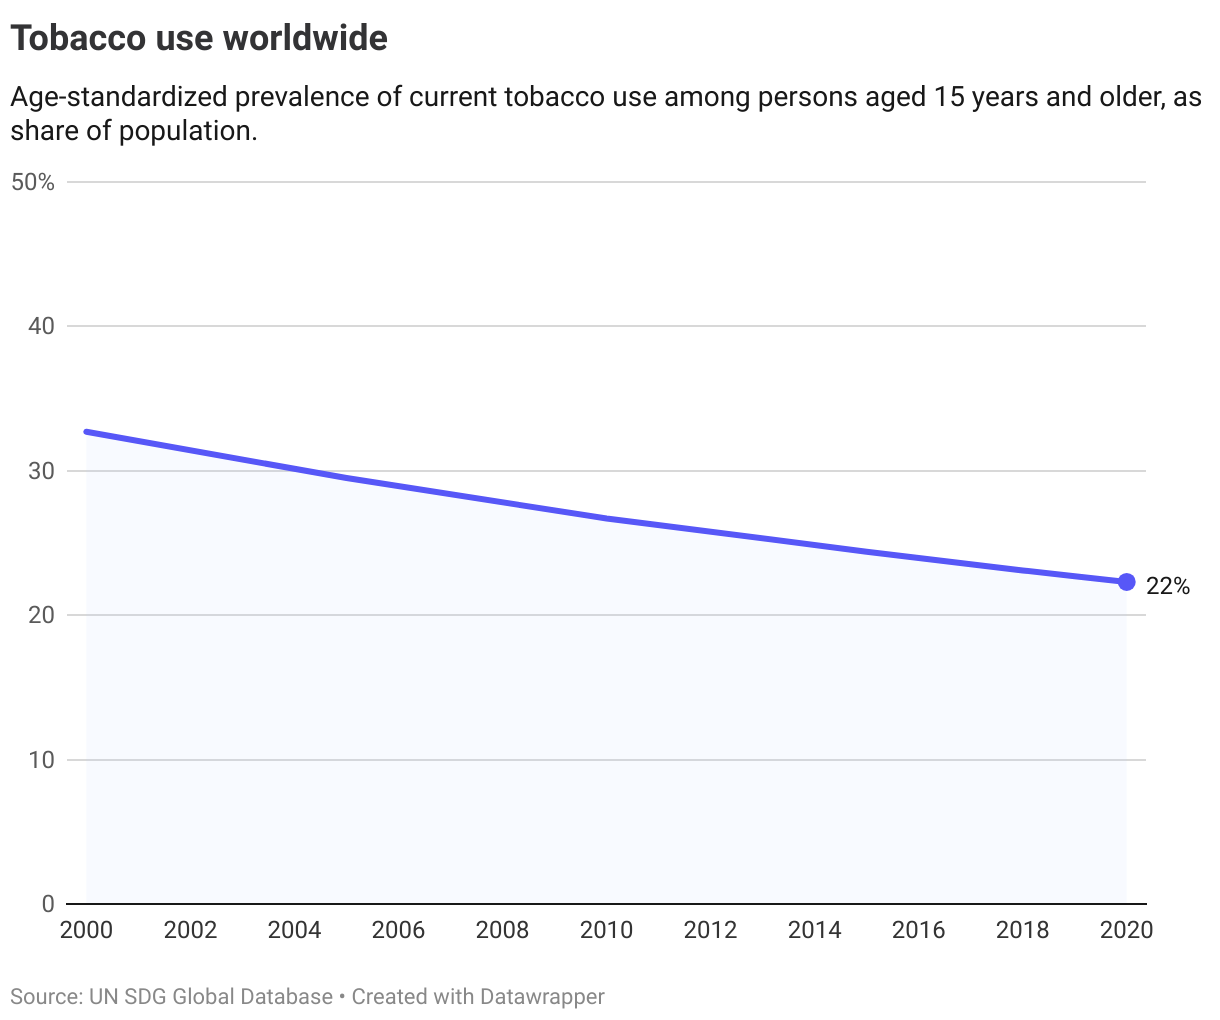
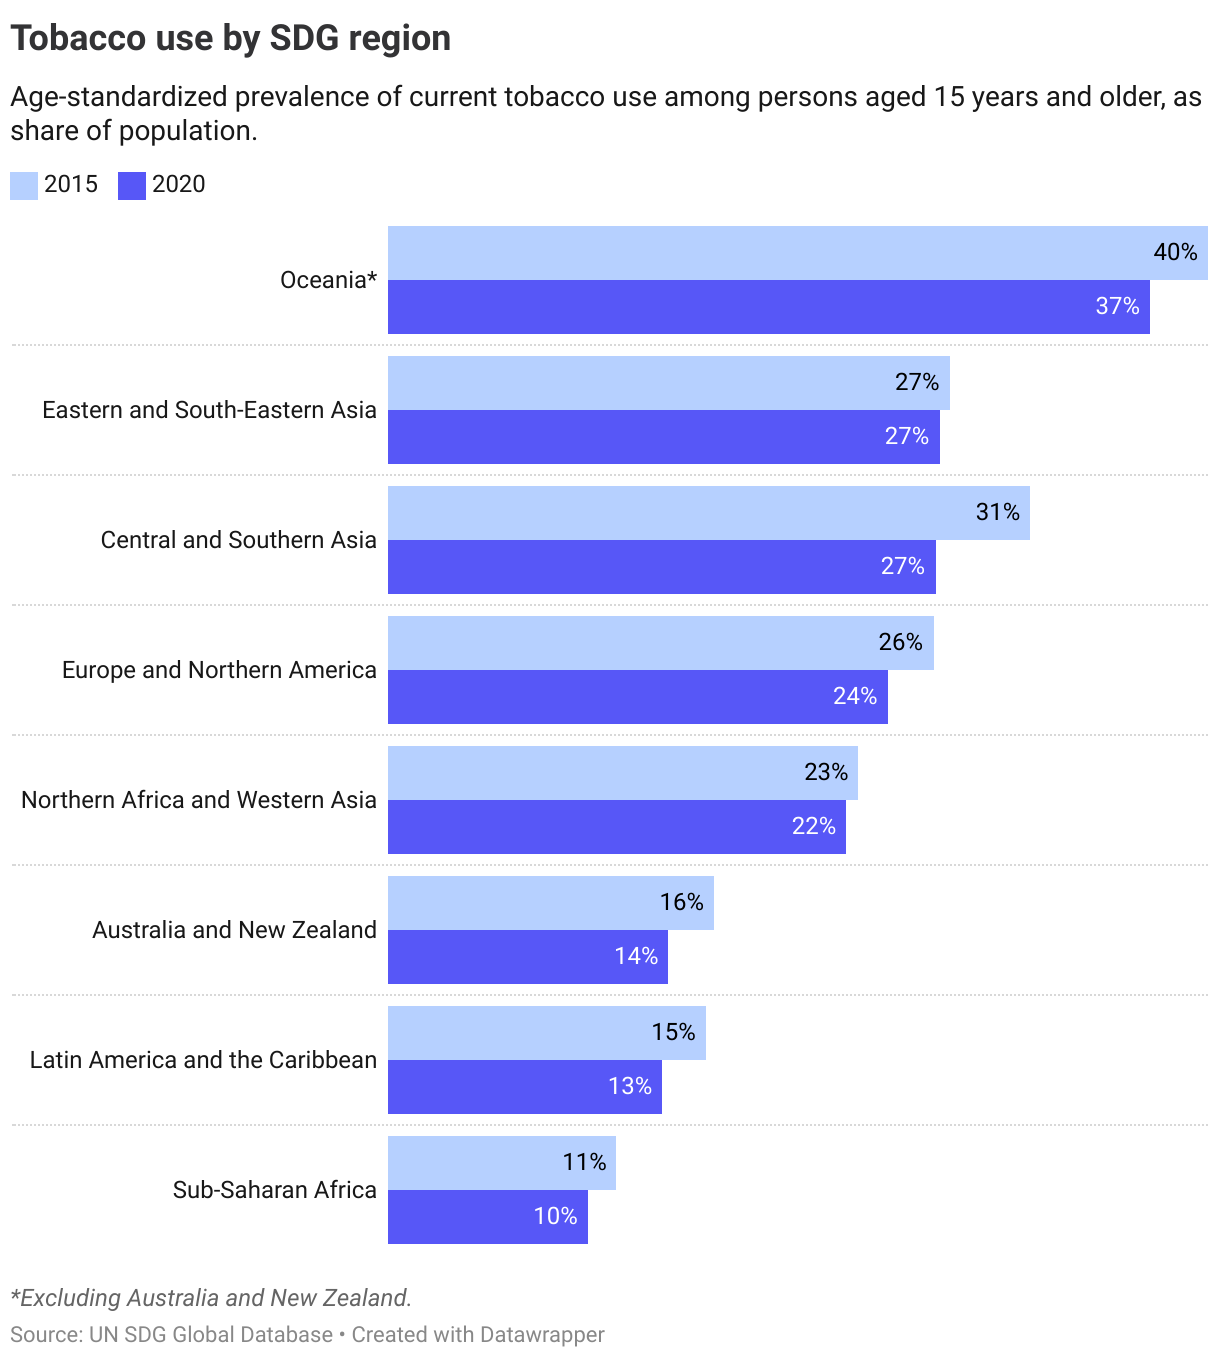
Rates have declined in all regions since 2015. The highest tobacco use rates can be found in Oceania (37%) and the lowest in Sub-Saharan Africa (10%).
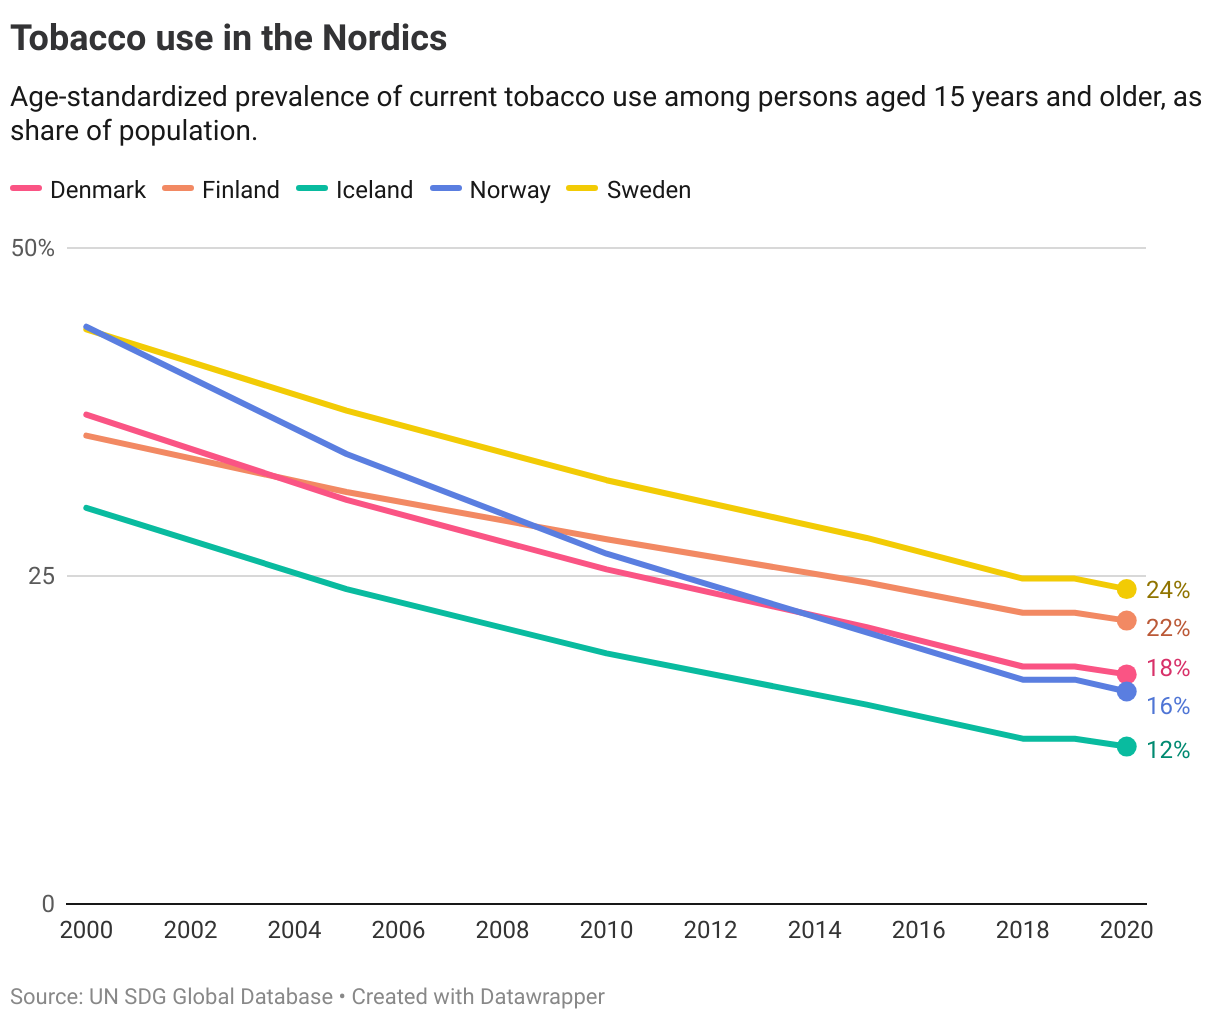
The Nordics
The trend of declining tobacco use can also be seen in all the Nordic countries. Age-standardised rates show that the share of the population using tobacco has more than halved since 2000 in Denmark, Iceland, Norway and Sweden. Yet the progress made is not sufficient to achieve the target of eradicating tobacco use by 2030 (operationalised at below 3%).
Denmark
Long distance to target but progressing
Finland
Long distance to target but progressing
Iceland
Long distance to target but progressing
Norway
Long distance to target but progressing
Sweden
Long distance to target but progressing
Target 3.b
Support the research and development of vaccines and medicines for the communicable and non-communicable diseases that primarily affect developing countries, provide access to affordable essential medicines and vaccines, in accordance with the Doha Declaration on the TRIPS Agreement and Public Health, which affirms the right of developing countries to use to the full the provisions in the Agreement on Trade-Related Aspects of Intellectual Property Rights regarding flexibilities to protect public health, and, in particular, provide access to medicines for all
| 3.b.1 | Proportion of the target population covered by all vaccines included in their national programme |
| 3.b.2 | Total net official development assistance to medical research and basic health sectors |
| 3.b.3 | Proportion of health facilities that have a core set of relevant essential medicines available and affordable on a sustainable basis |
Global trends
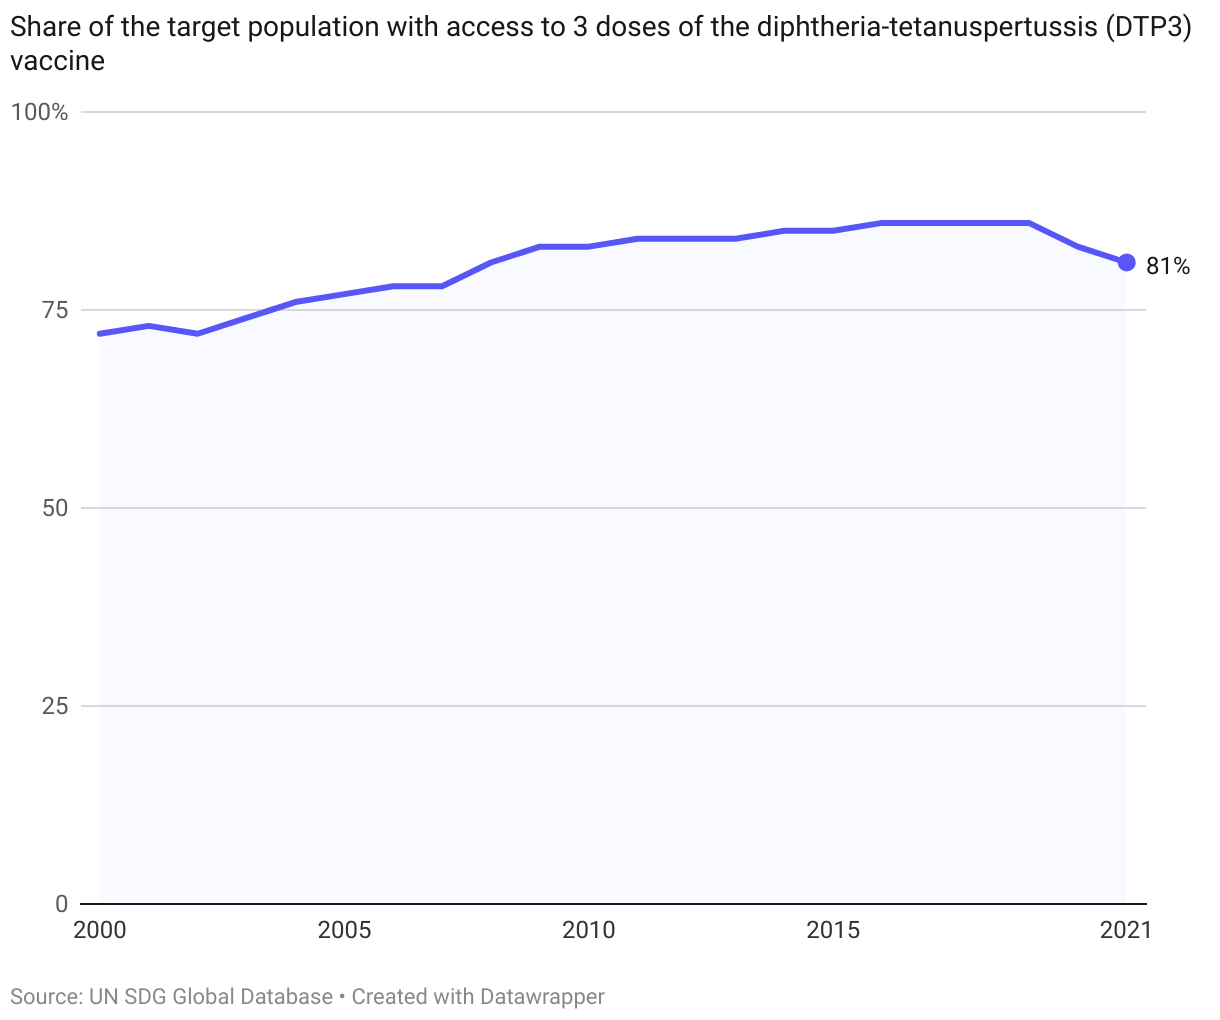
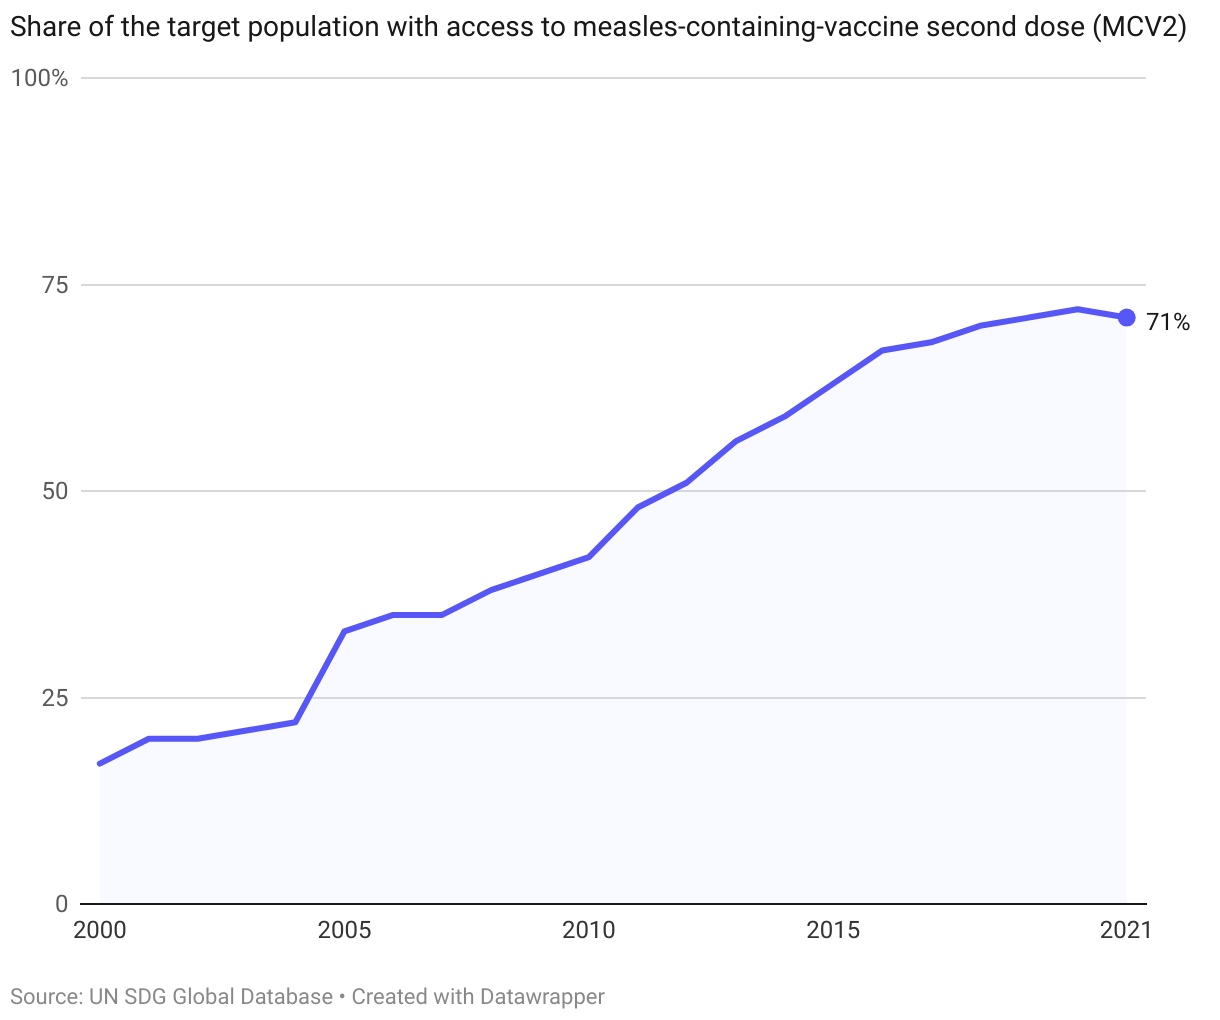
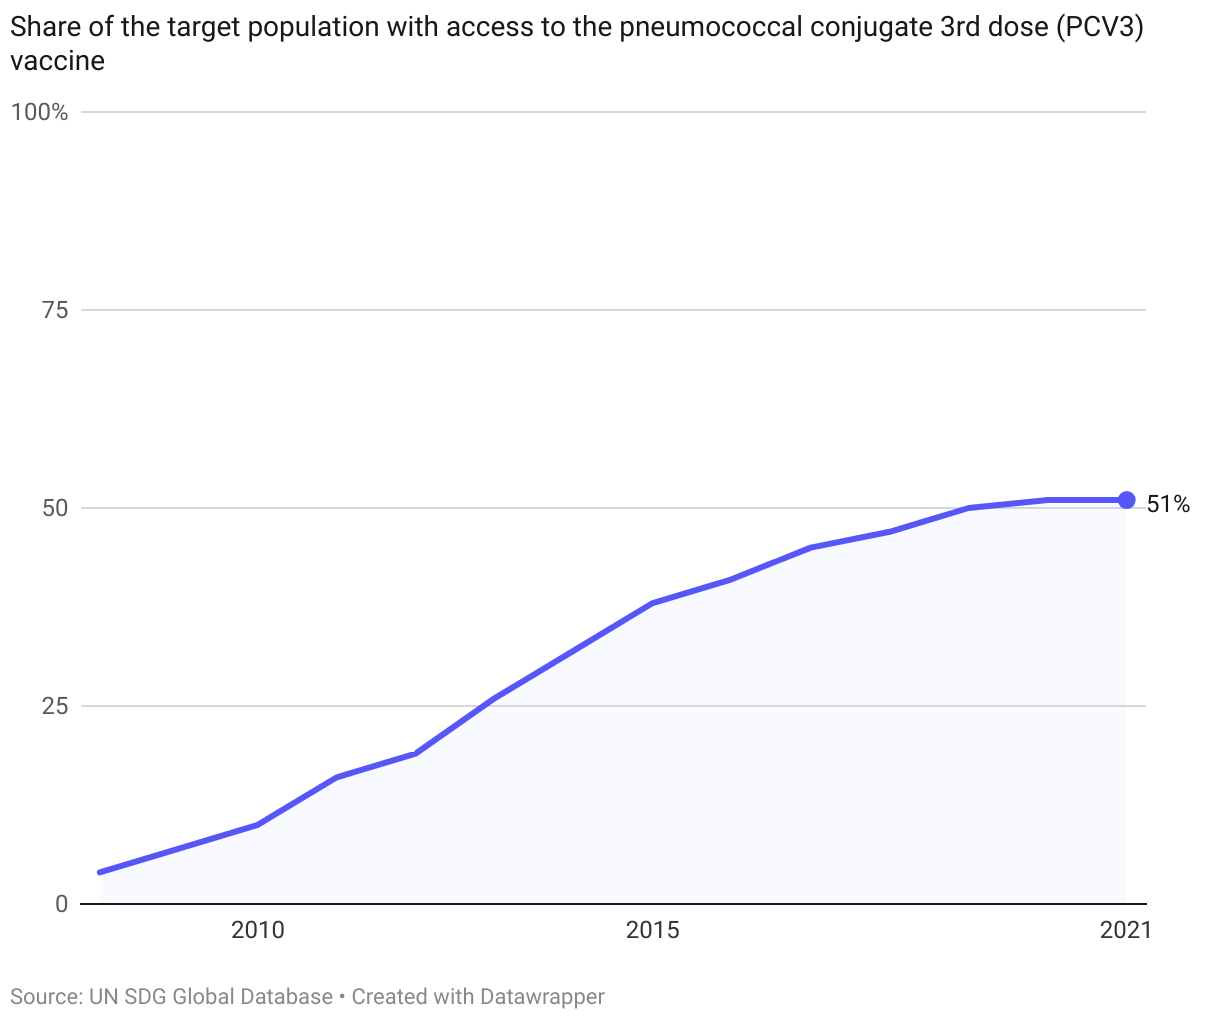
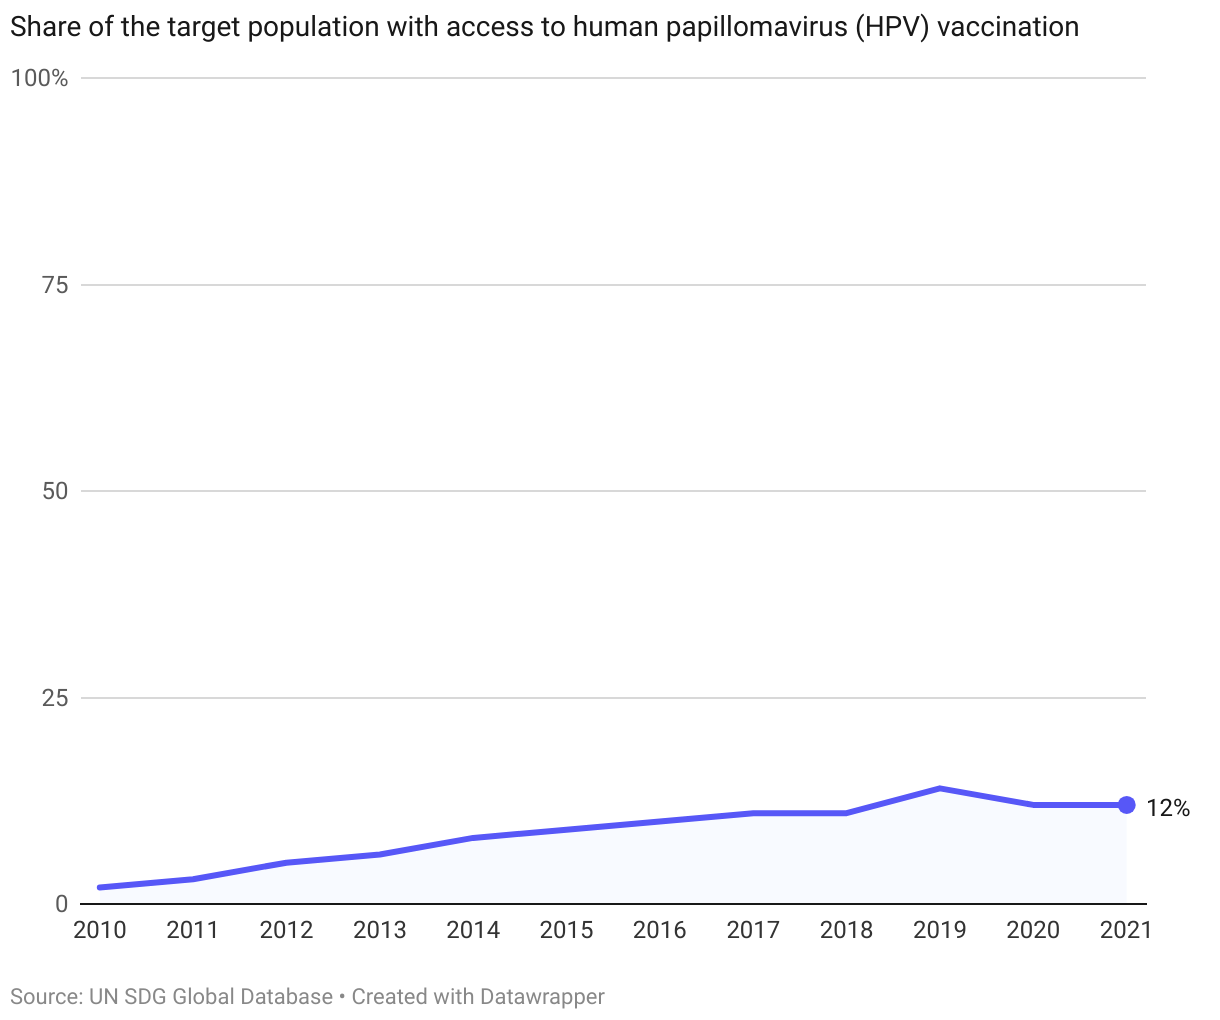
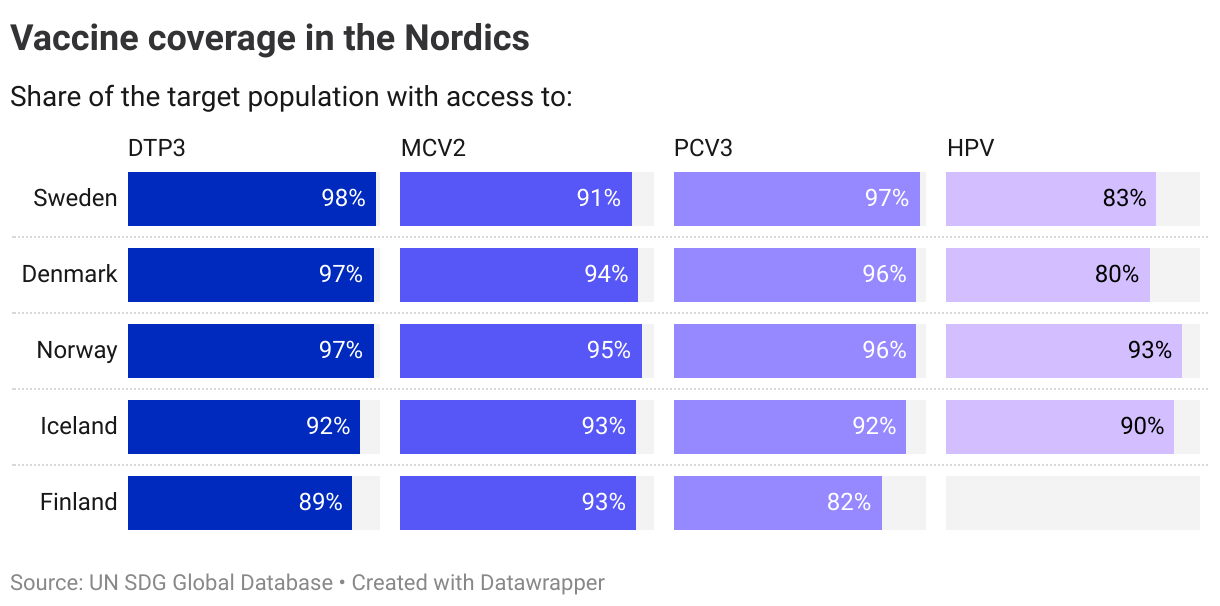
3.b.1. Vaccine coverage
There are four types of vaccines that are tracked in the global SDG indicator framework: coverage of DTP containing vaccine, coverage of Measles containing vaccine, coverage of Pneumococcal conjugate vaccine, and the HPV vaccine.
Global coverage levels of all these vaccines have been rising over the past decades. Still, on average, the world has not reached the WHO recommendation of WHO recommendation of vaccinating more than 90% of the target population against DTP, measles or pneumococcus. HPV vaccination levels stood at 12% in 2021.
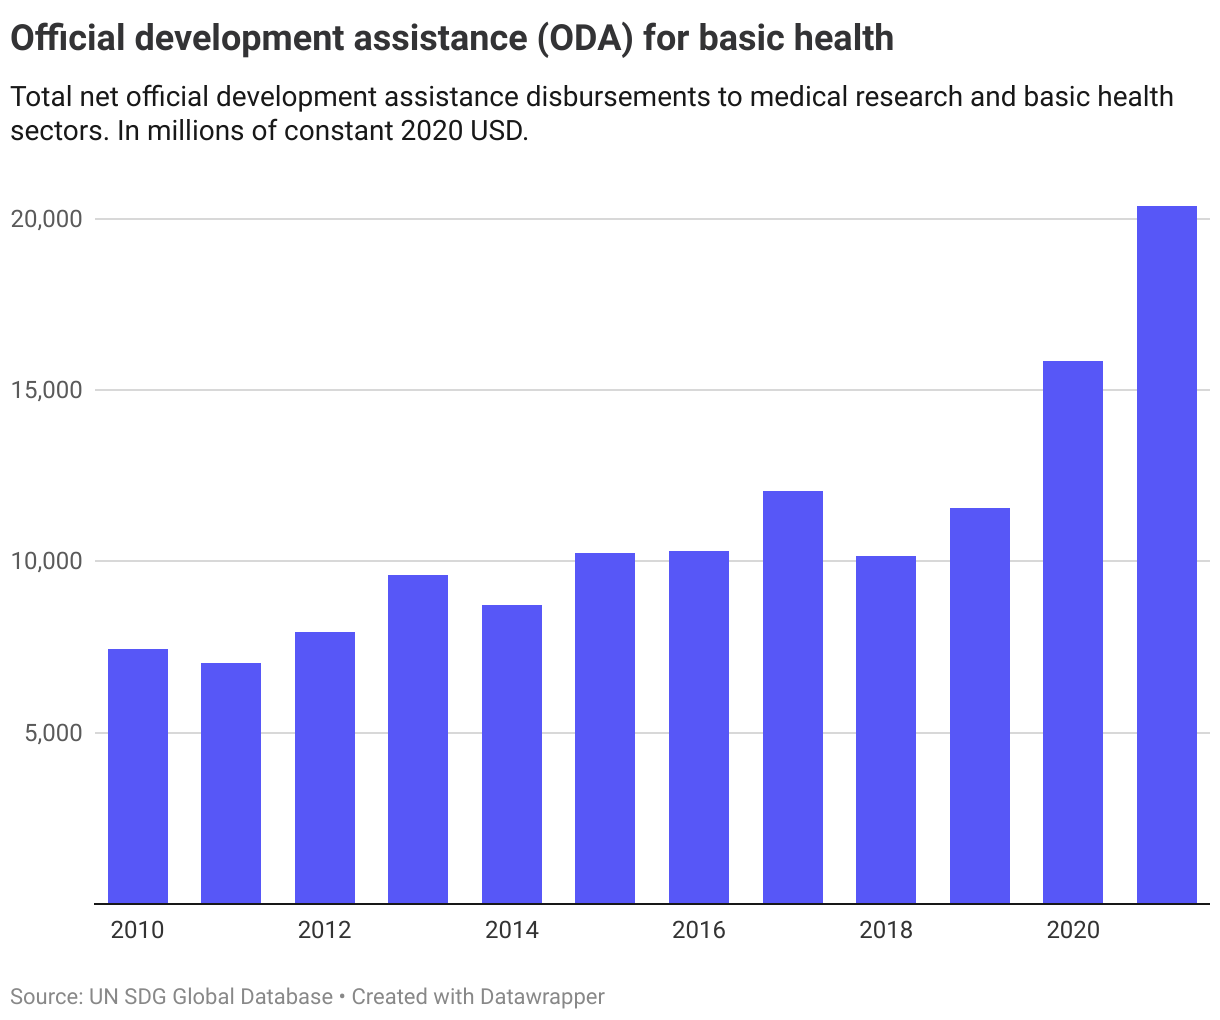
3.b.2. Official Development Assistance (ODA)
Data for net ODA to medical research and basic health sectors is available from 2010, showing that total net disbursements has more than doubled from 2010 to 2021.
3.b.3 Health facilities
Data for this indicator is currently not available at the global or regional level.
The Nordics
The Nordic countries have high coverage levels of the DTP3, MCV2, and PCV3 vaccines (indicator 3.b.1). HPV coverage is more uneven, but high compared to other countries. All in all, this SDG target is already achieved in the Nordic countries.
Data on net ODA to health per country (indicator 3.b.2) is only considered contextual and not considered in the trend assessment.
Denmark
Target is met
Finland
Long distance to target, not progressing
Iceland
Target is met
Norway
Target is met
Sweden
Target is met
Target 3.c
Substantially increase health financing and the recruitment, development, training and retention of the health workforce in developing countries, especially in least developed countries and small island developing States
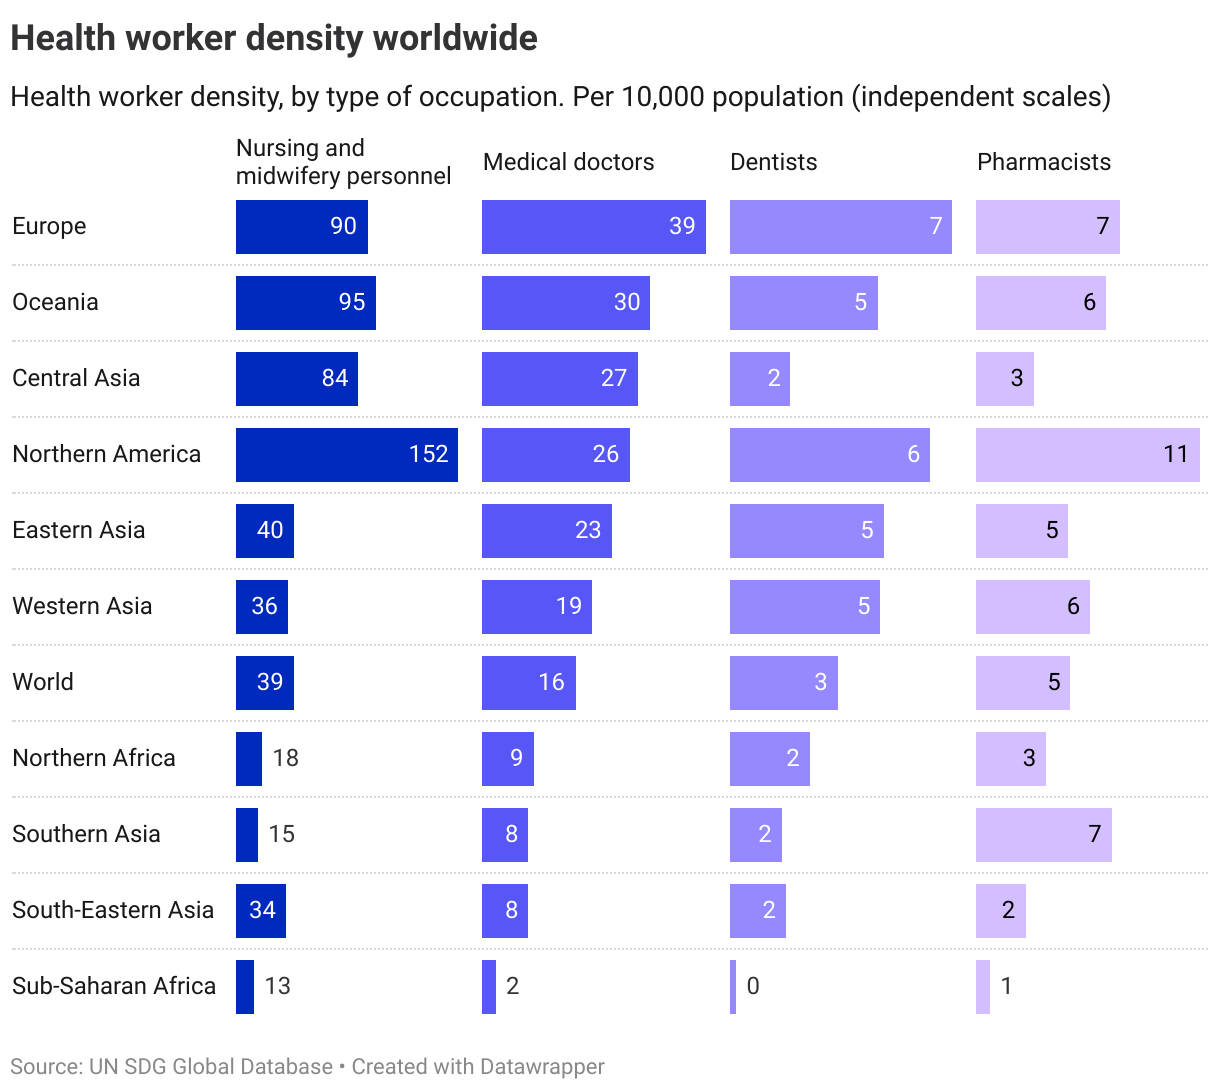
| 3.c.1 | Health worker density and distribution |
Global trends
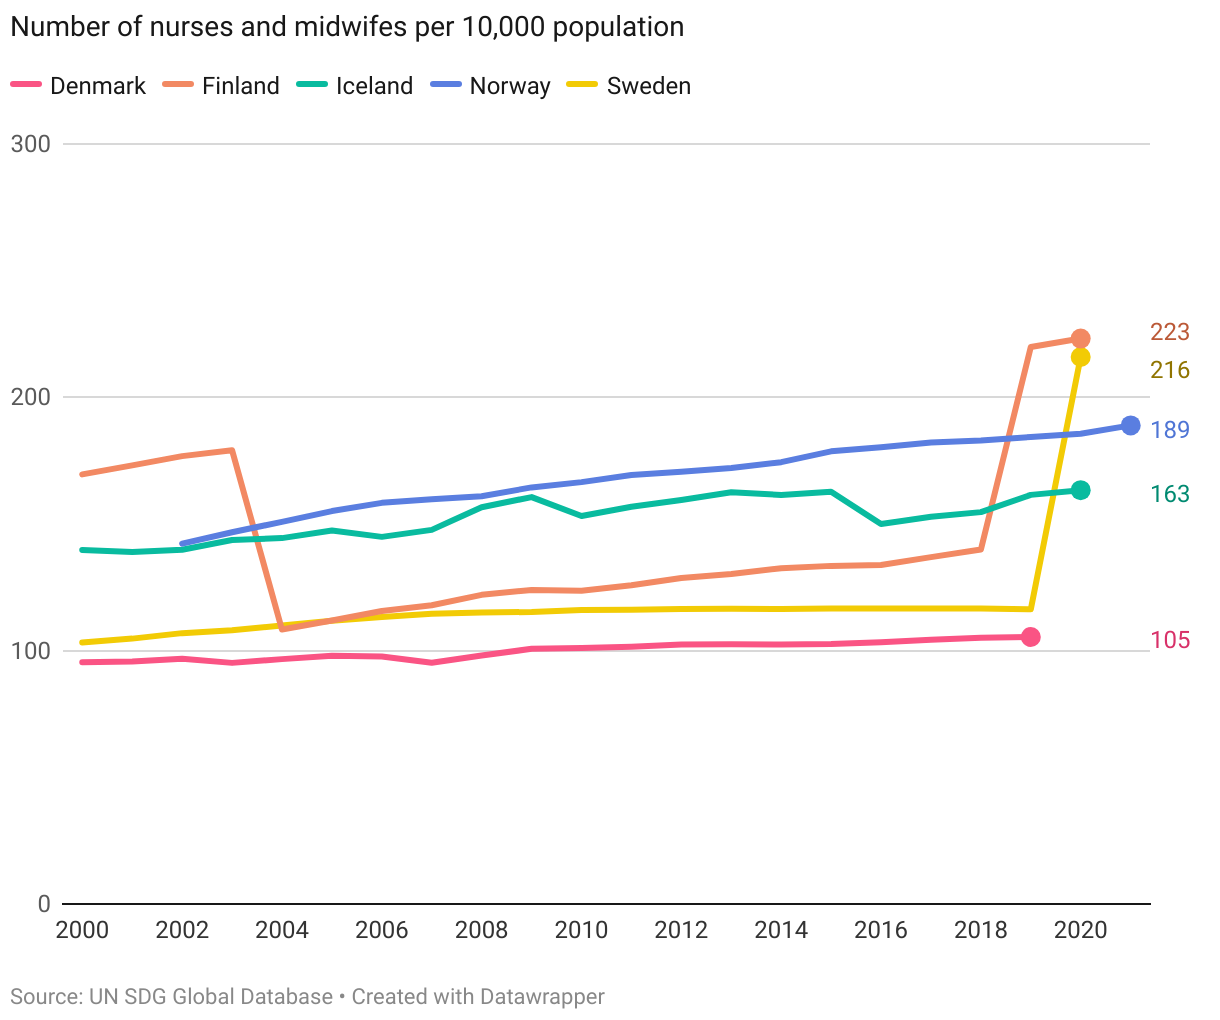
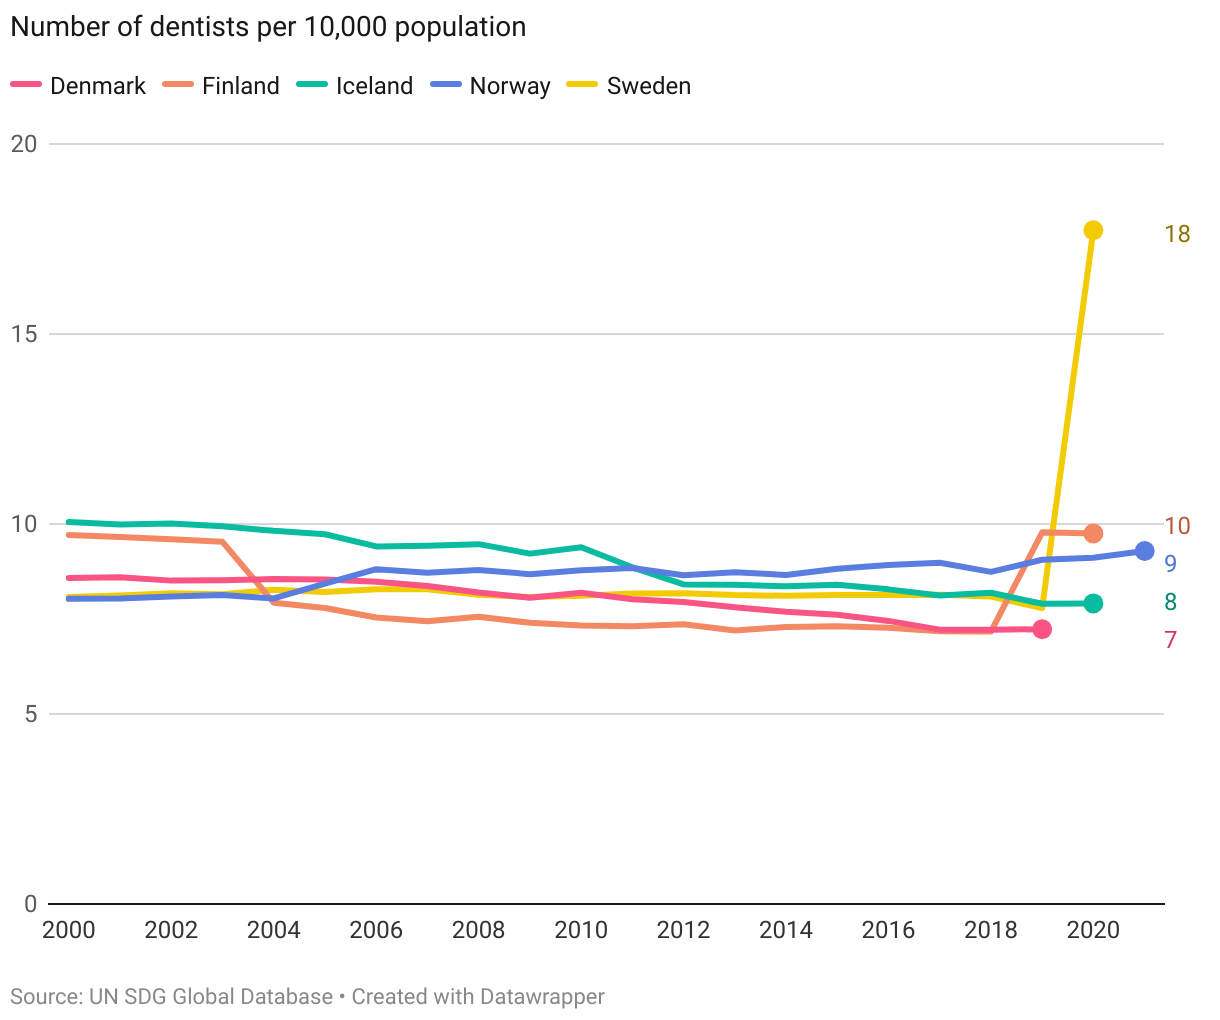
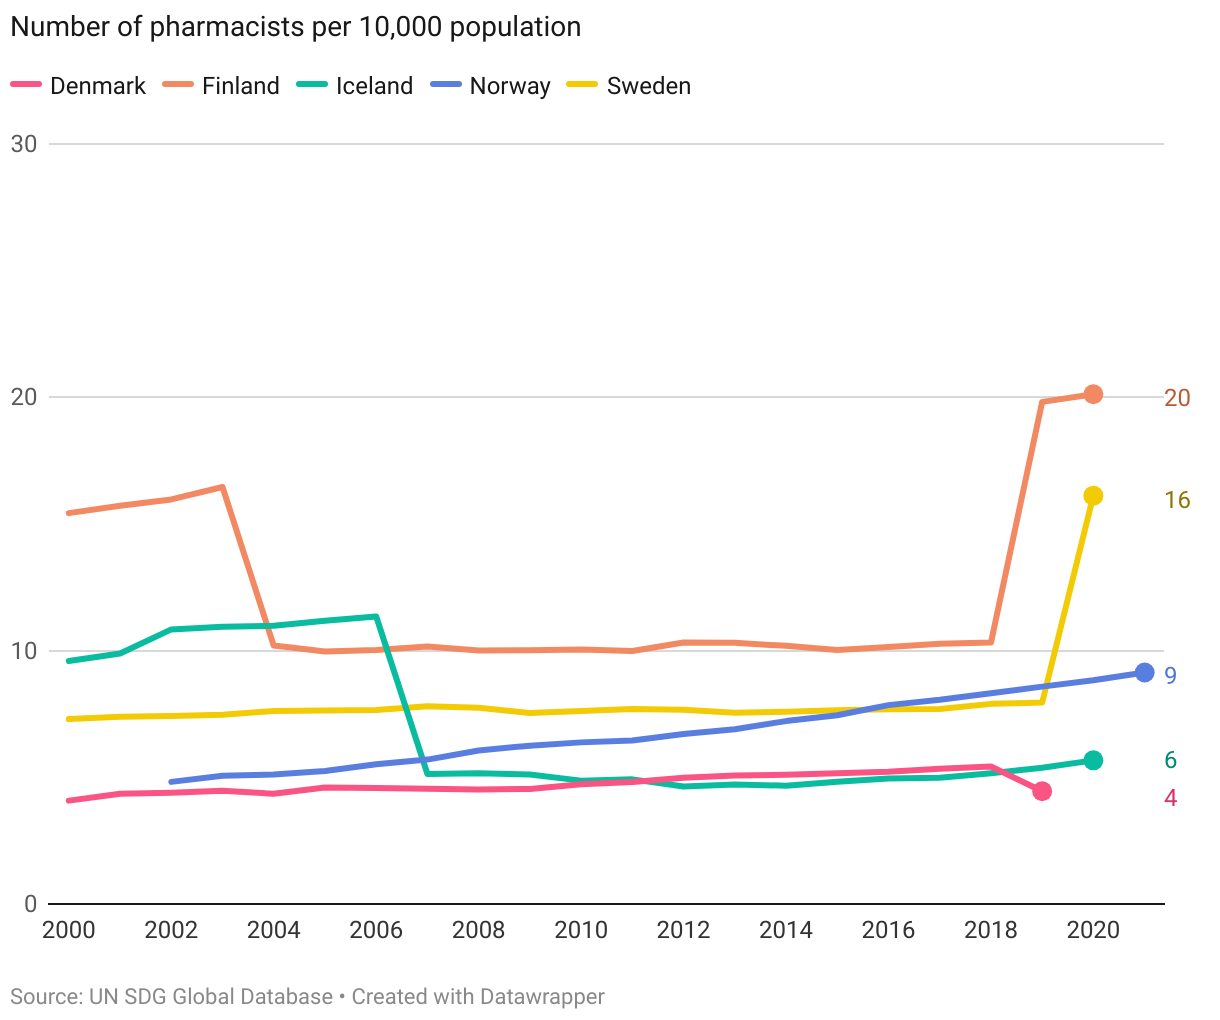
There is no set target for 2030 for the indicator of health worker density. Data for 2021 show large differences in healthcare worker density across regions. In Europe, there were almost 40 medical doctors per 10,000 population, compared to only 2 in Sub-Saharan Africa and 8 in South and South-Eastern Asia.
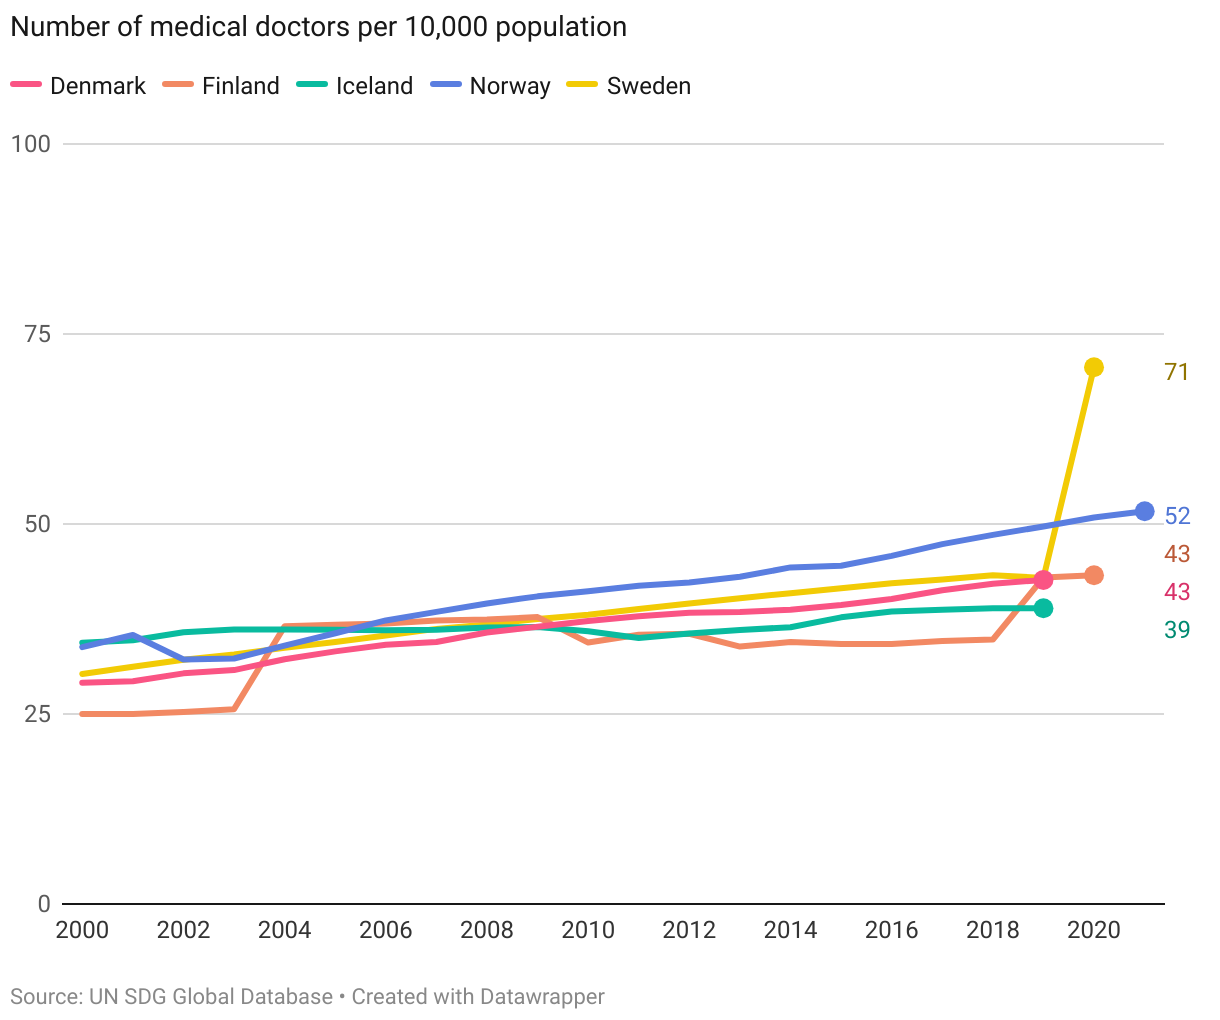
The Nordics
The below visualisation details the density levels in the Nordic countries. The Nordics have a higher density of healthcare workers than the European average in all occupational groups, except pharmacists (Denmark and Iceland below the European average). Furthermore, the density levels have increased across all groups over the past two decades.
Target 3.d
Strengthen the capacity of all countries, in particular developing countries, for early warning, risk reduction and management of national and global health risks
| 3.d.1 | International Health Regulations (IHR) capacity and health emergency preparedness |
| 3.d.2 | Percentage of bloodstream infections due to selected antimicrobial-resistant organisms |
Global trends
3.d.1. IHR Capacity
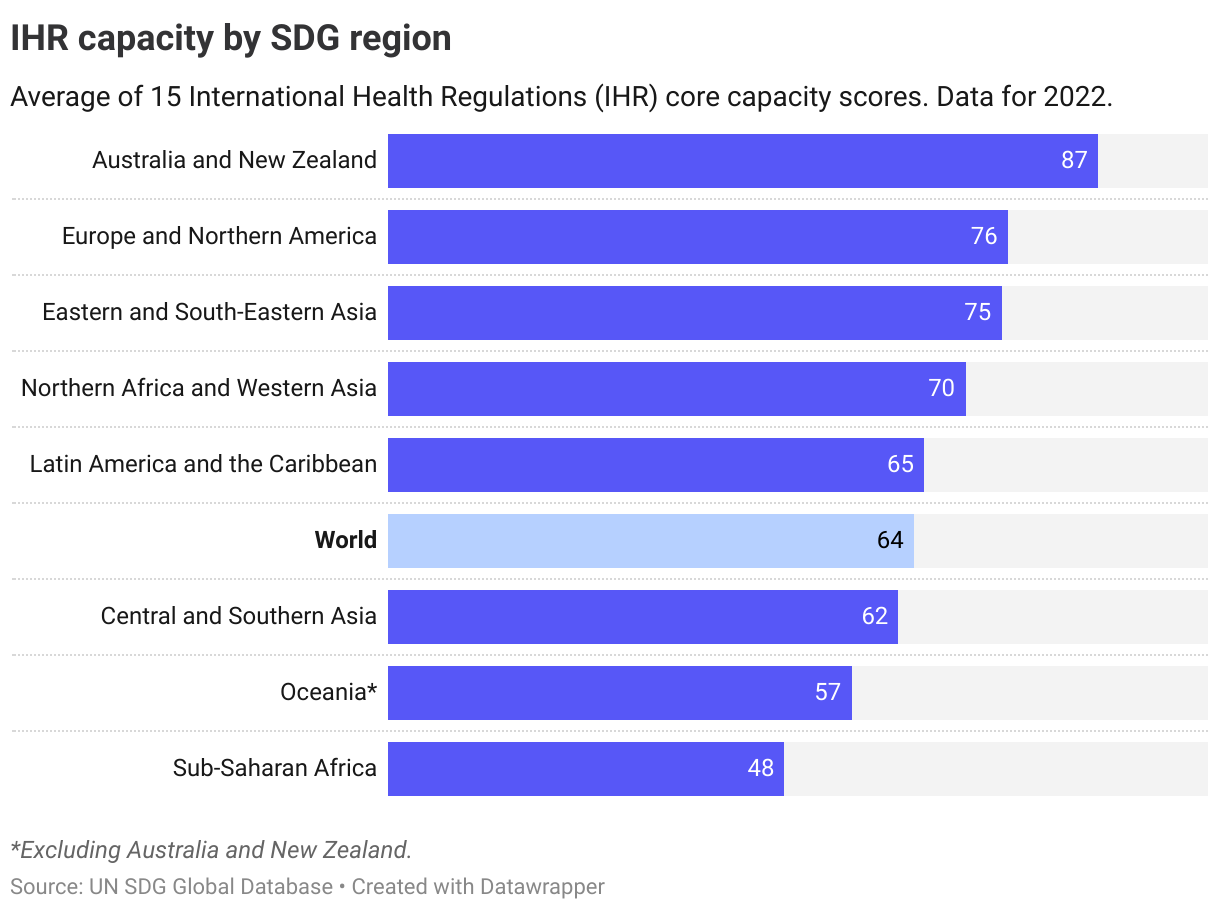
Since 2010, data has been collected on the implementation of the International Health Regulations (IHR). Under the IHR, states are obliged to develop and maintain a range of minimum core capacities for potential public health events of international concern. Capacity is measured through an IHR capacity scores which as of 2022 cover 15 areas:
(1) Policy, legal and normative instruments to implement IHR; (2) IHR Coordination and National Focal Point Functions; (3) Financing; (4) Laboratory; (5) Surveillance; (6) Human resources; (7) Health emergency management (8) Health Service Provision; (9) Infection Prevention and Control; (10) Risk communication and community engagement; (11) Points of entry and border health; (12) Zoonotic diseases; (13) Food safety; (14) Chemical events; (15) Radiation emergencies.
The indicator set has been revised over the years, most recently in 2021. The below figure with the latest data shows that the current global average score (for all 15 capacities) was 64 out of 100, with Sub-Saharan Africa lowest at 48 and Australia and New Zealand highest at 87 out of 100.
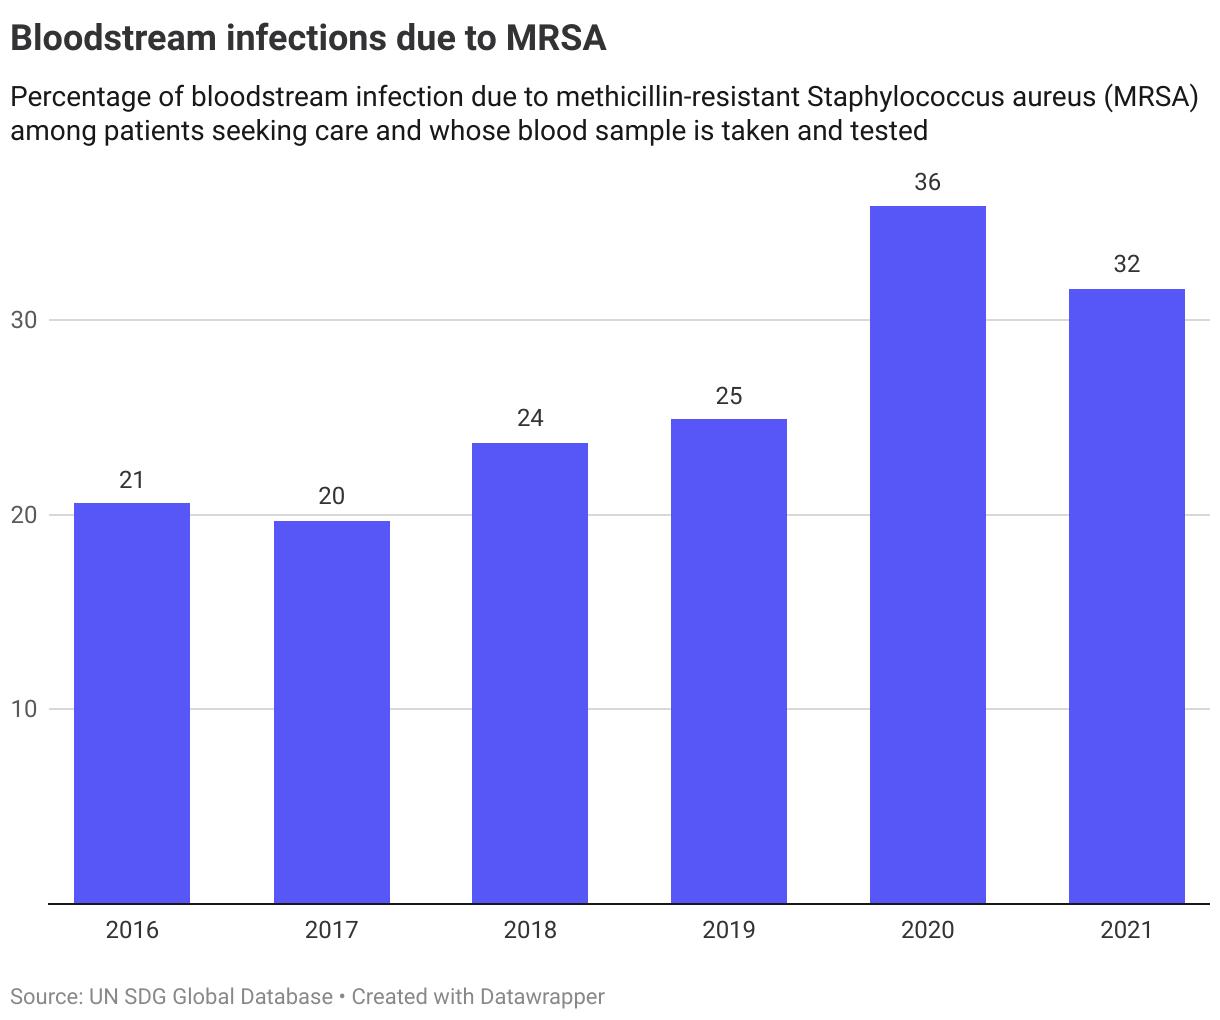
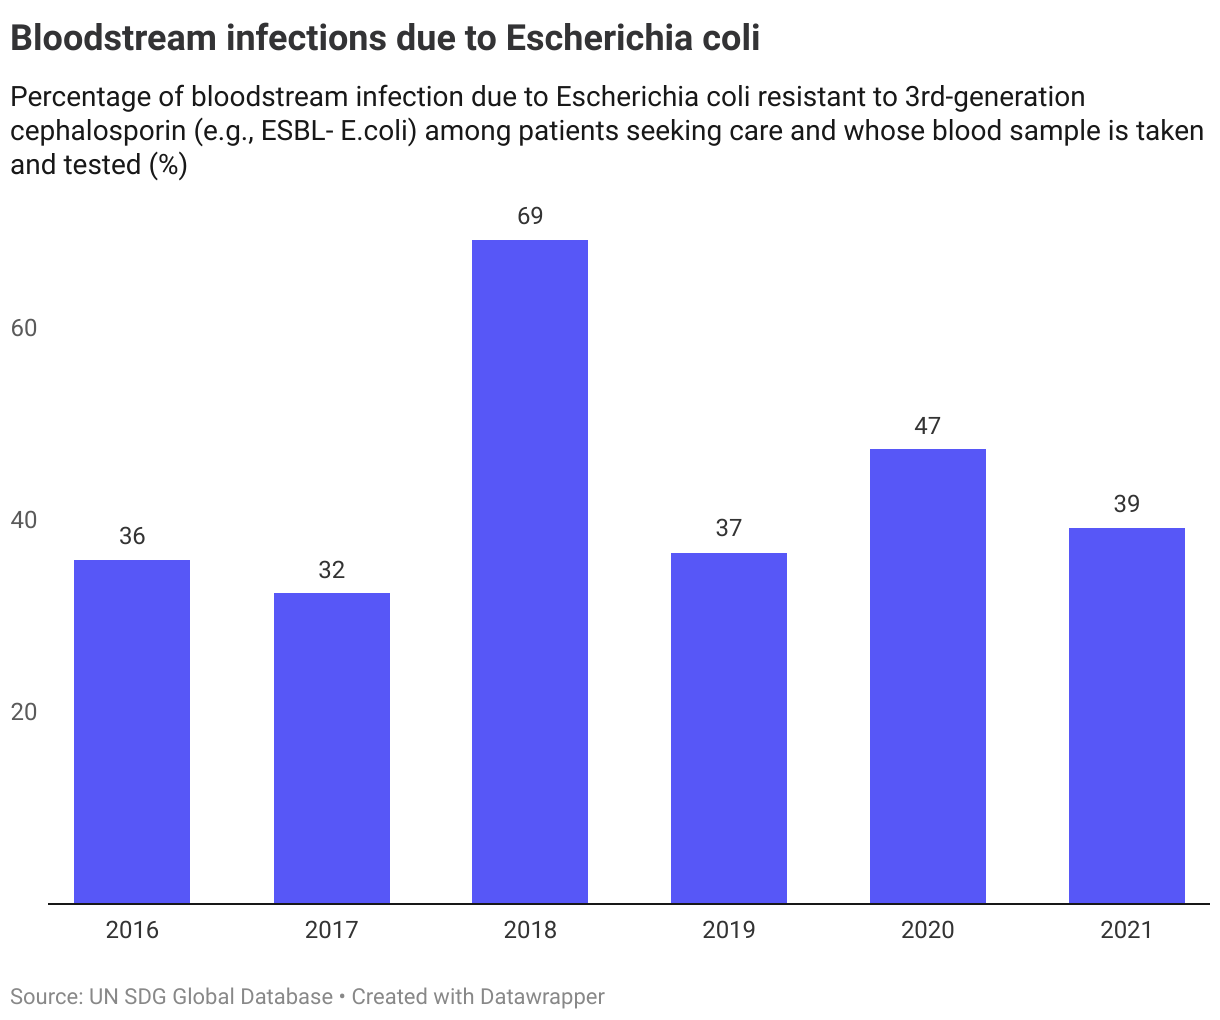
3.d.2. Bloodstream infections
Data on the second indicator, bloodstream infections due to selected antimicrobial-resistant organisms, is limited to a few years. A comparison between levels in 2016 and 2021 shows a rising trend in the share of bloodstream infections due to MRSA at the global level, while Escherichia coli is slighly above the level as in 2016.
The Nordics
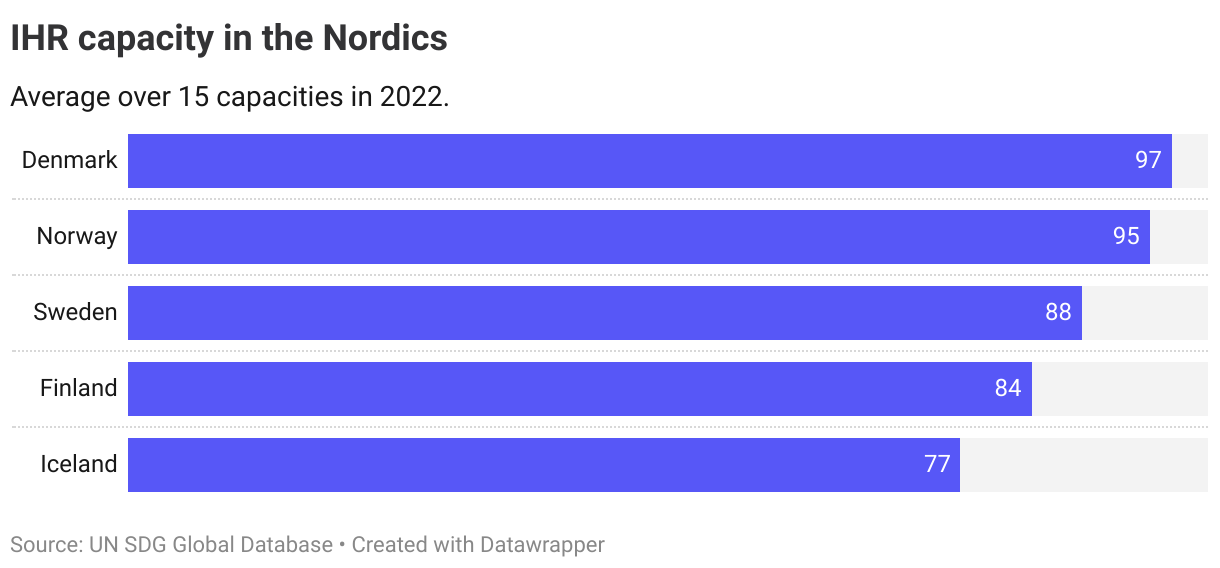
Data for the Nordics are only available for the IHR scores (indicator 3.d.1), showing that all countries were above the European average (76) in 2022. Denmark was the only country reaching the OECD set target a score at 97 or higher.
Due to revised frameworks for measurement of capacity, with the last revision occuring in 2021, no trend assessment is performed on this indicator.