

Introduction
This data tracker analyses the Nordic countries’ progress towards achieving Sustainable Development Goal 2: End hunger, achieve food security and improved nutrition and promote sustainable agriculture. The goal is comprised of 8 targets.
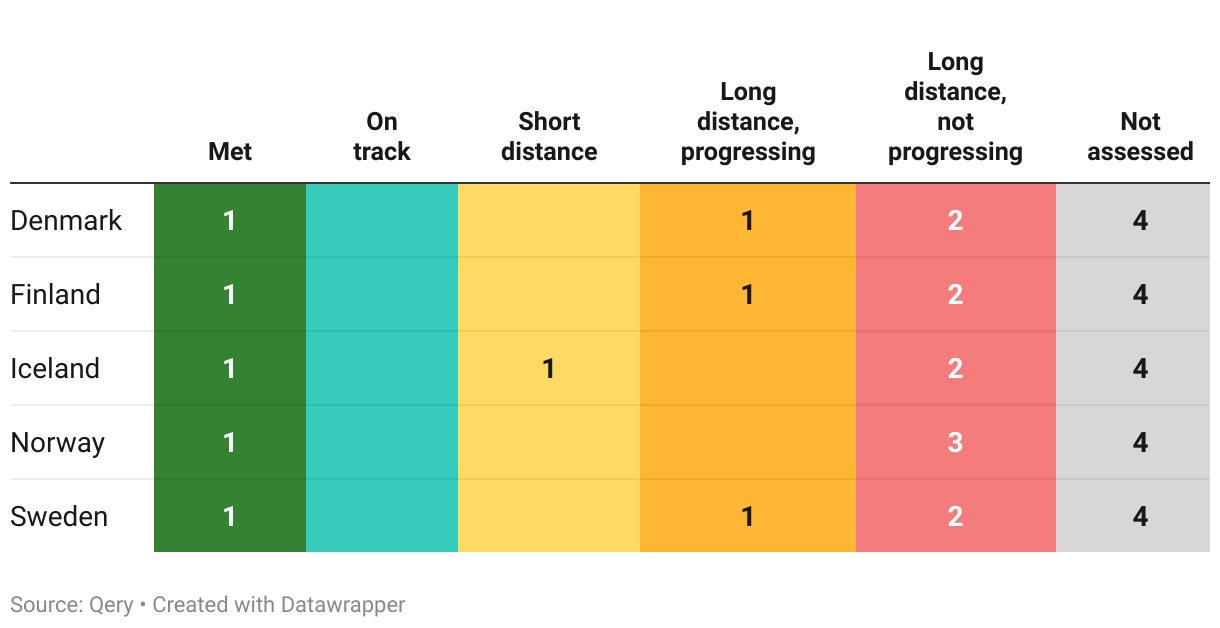
The Nordic countries – Denmark, Finland, Iceland, Norway and Sweden – are classified into one of five categories for each target:
Met: The country has already met the 2030 target.
On track: The country has not yet met the target but is on track to do so by 2030.
Short distance: The country has not met the target and is not projected to do so but is close to achieving it. This category also applies when the country currently meets the target but is projected to move away from it.
Long distance but progressing: The country is far from the target but is making progress towards it.
Long distance and not progressing: The country is far from the target and is not making progress towards reaching it.
Details on the methodology used, together with the overall assessment for all 17 goals, can be found on our overview page. Note that the analysis is currently work in progress.
Overall assessment of progress
As of mid-2023, this is our assessment of the Nordic countries progress on the 8 targets part of SDG 2:
The Nordic countries’ performance on the different targets part of this goal can be explored further below. Each section follows the same structure:
- First, the official target text and related indicators is described and the latest global and regional trends are highlighted briefly.
- Second, where data is available, we then zoom in on the Nordic countries to describe how they are progressing, and assess their likelihood of achieving the target by the 2030 deadline.
- Note that both sections above strictly uses data from the UN SDG Global Database and/or the OECD.
Target 2.1
By 2030, end hunger and ensure access by all people, in particular the poor and people in vulnerable situations, including infants, to safe, nutritious and sufficient food all year round
| 2.1.1 | Prevalence of undernourishment |
| 2.1.2 | Prevalence of moderate or severe food insecurity in the population, based on the Food Insecurity Experience Scale (FIES) |
Global trends
2.1.1 Undernourishment
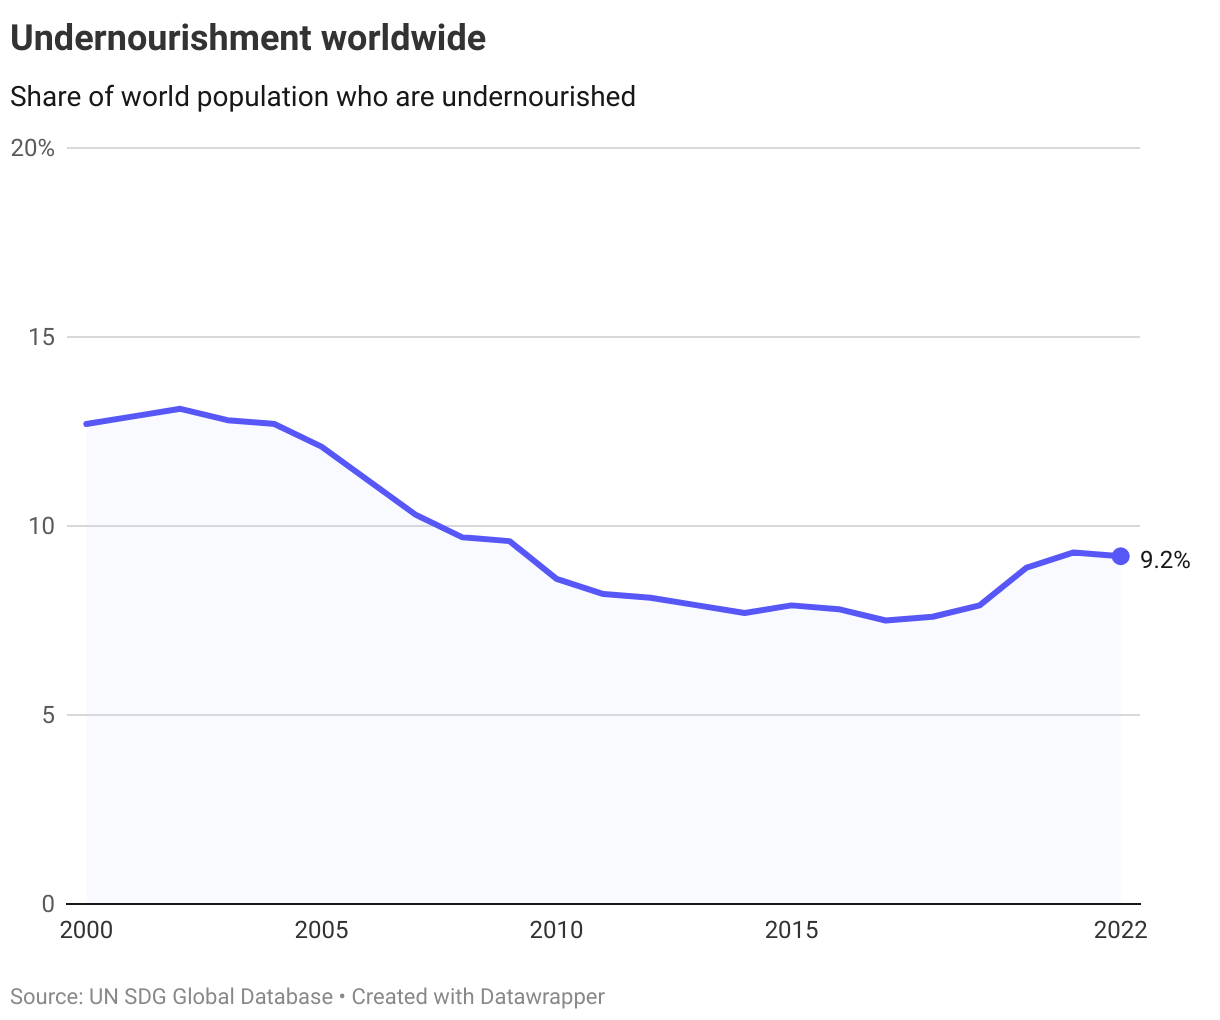
After declining in the early part of the century, undernourishment has been on the rise the last years. In 2022 it is estimated that 9.2% of the global population, 735 million people, experienced undernourishment. This is 122 million more than in 2019 when 7.9% in 2019. Note that these numbers are based on the latest mid-range projections by the Food and Agricultural Organization of the United Nations.
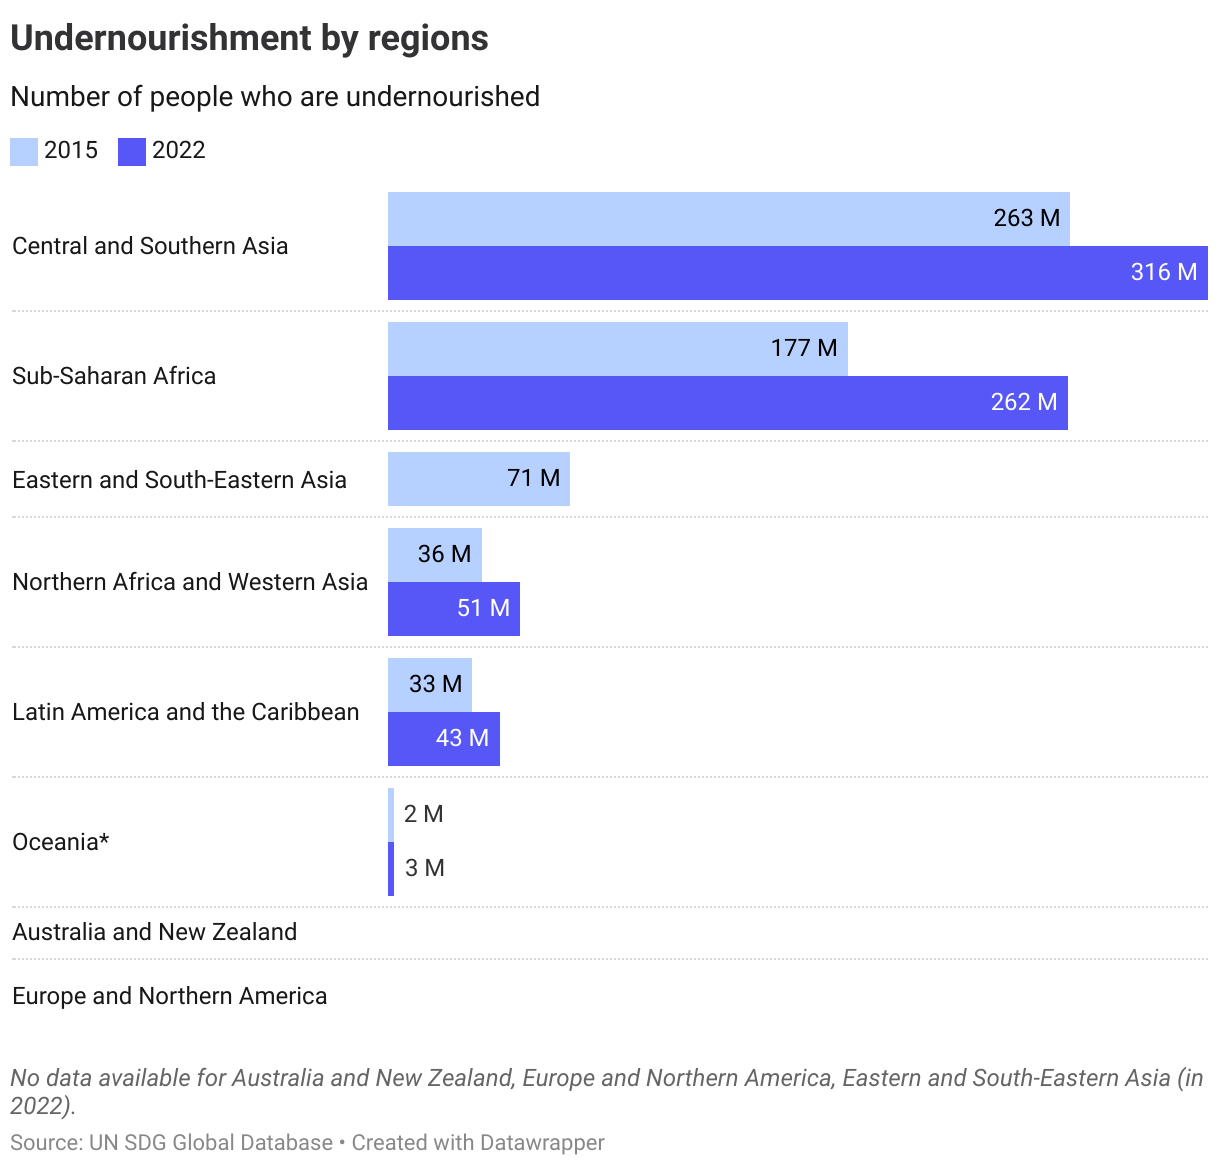
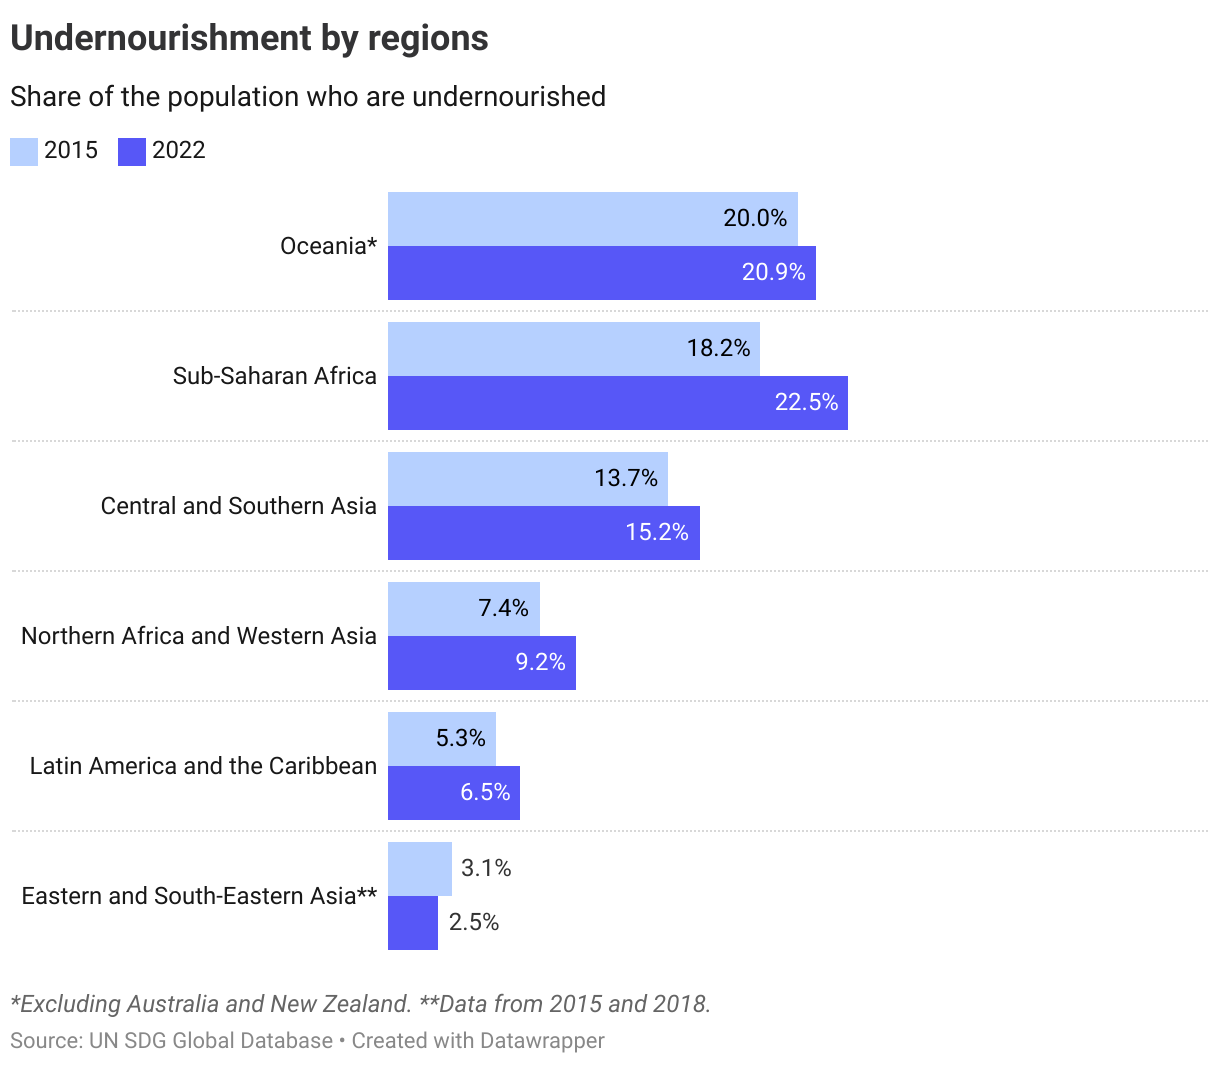
About 3 out of 4 people who are undernourished reside in Sub-Saharan Africa and Central and Southern Asia. In both regions, the share of undernourished have increased since 2015.
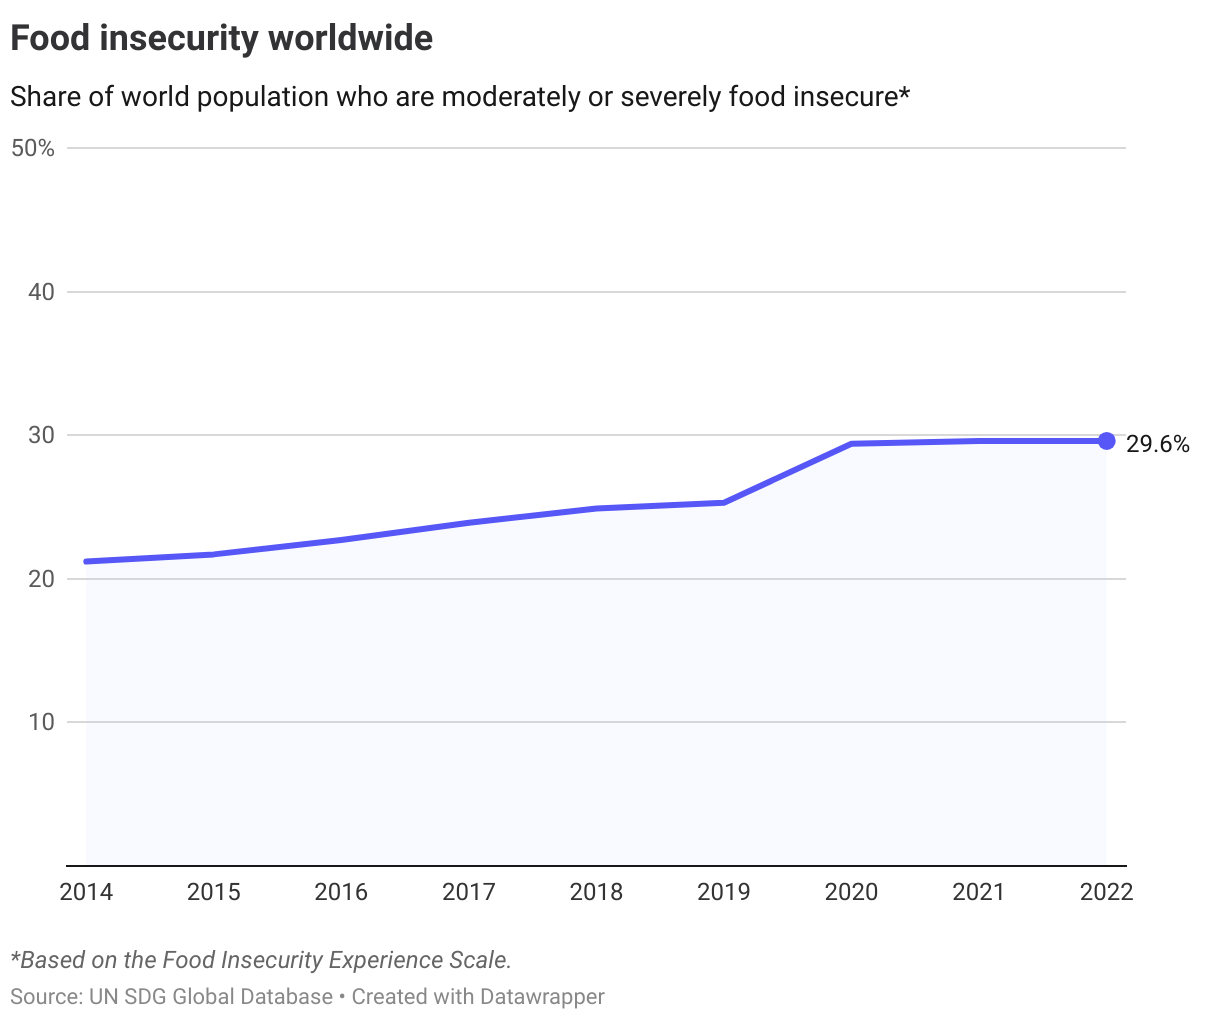
2.1.2 Food insecurity
Food insecurity has also been on the rise in recent years, with the share of the world population who are moderately or severely food insecure rising from 22% in 2015 to just around 30% from 2020 and onwards. This means that in 2022, around 2.4 billion people faced moderate or severe food insecurity worldwide, 391 million more than in 2019, and 745 million more than in 2015.
Moderate food insecurity involves reduced food quality/quantity and uncertainty in obtaining food due to limited resources, potentially leading to malnutrition. Severe food insecurity occurs when people run out of food, and at the most extreme possibly going days without eating.
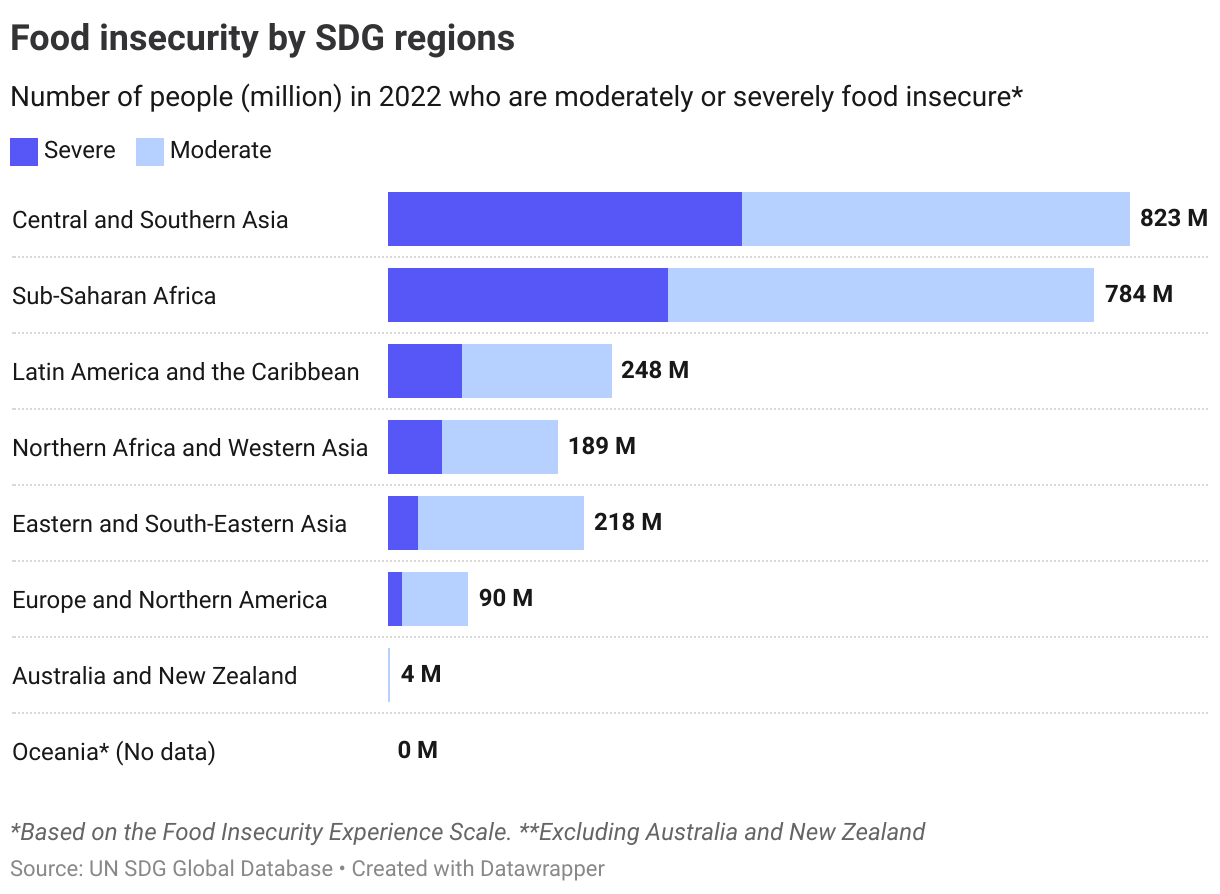
The regions most affected by food insecurity are Sub-Saharan Africa and Central and Southern Asia. In these regions, a total of over 1.6 billion people experienced moderate or severe food insecurity in 2022.
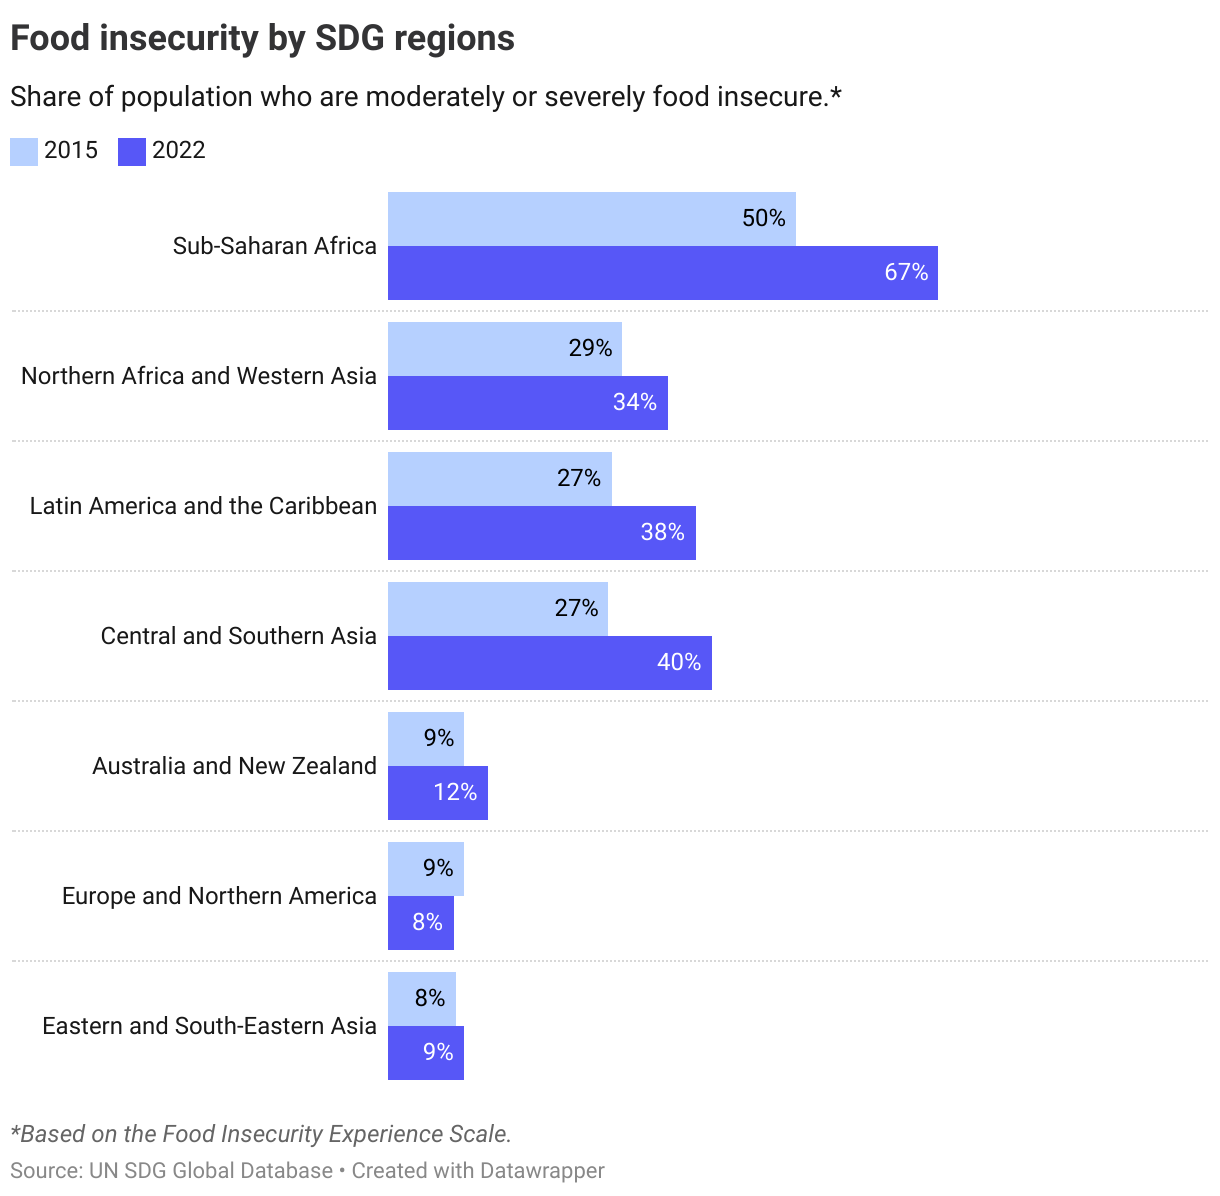
When comparing the share of the population facing moderate or severe food insecurity from 2015 to 2022, all regions have seen an increase except for Europe and Northern America.
The Nordics
There is no data that indicate any presence of undernourishment in the Nordic countries. Thus all the Nordics have already met the target for this indicator. However, a small share of the population is experiencing food insecurity. The underlying data from the UN reveals that out of those reporting food insecurity the majority are experiencing it at a moderate level.
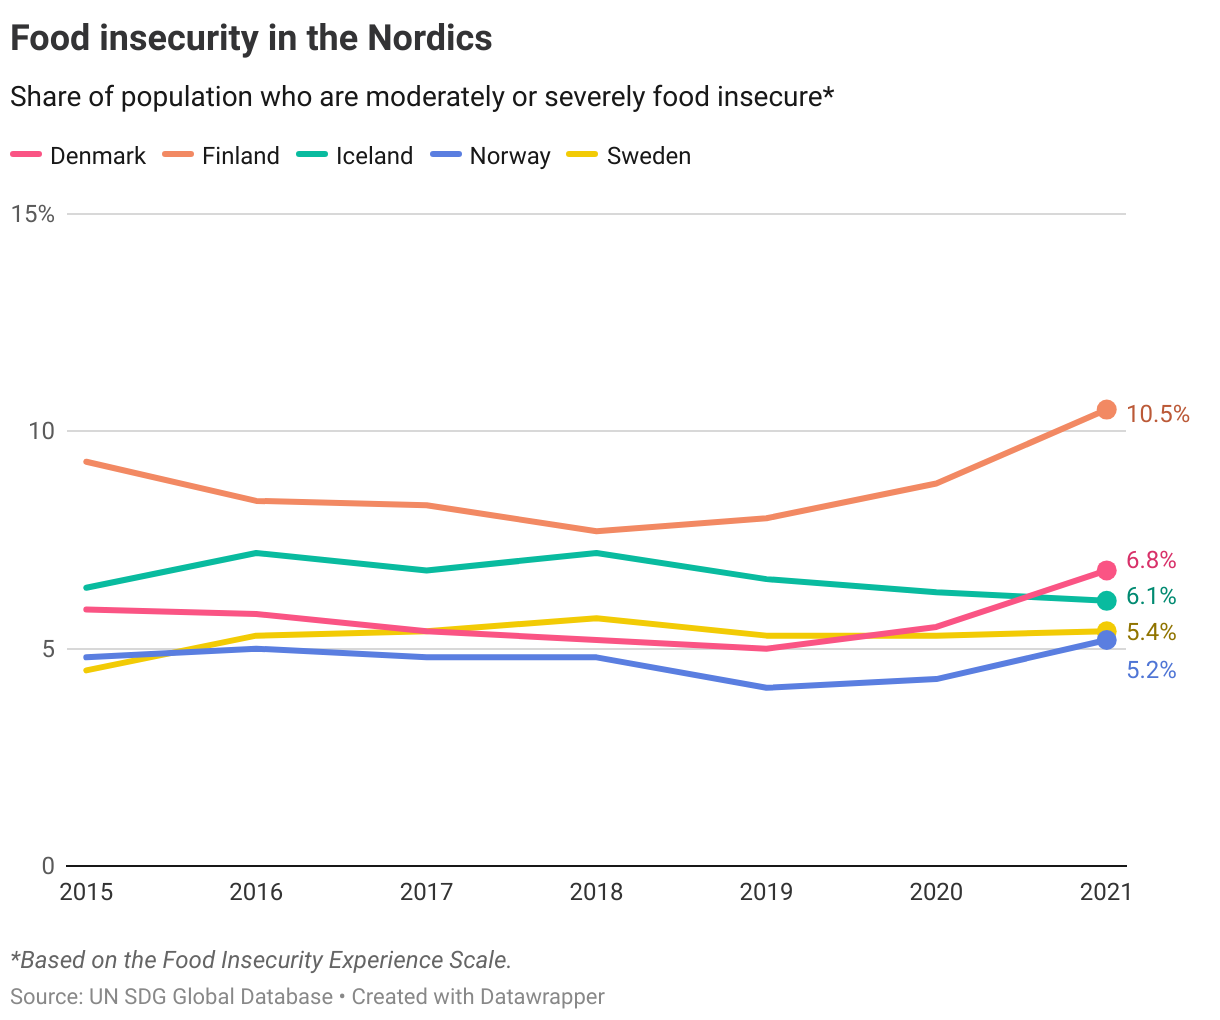
Given that the target for 2030 is to end hunger and ensure access by all people to safe, nutritious, and sufficient food, the OECD has set the target level for OECD countries to reduce food insecurity to below 3%.
While all the Nordics have already met the target if we only consider the share reporting severe food insecurity (below 3% in all countries), when considering the combined share of moderate and severe food insecurity as per UN definition, no country has met or is on track reduce it to below 3% by 2030.
However, given that the majority of indicators (2 out 3) are already achieved and on track in all the Nordics on this target, the overall classification is that the target is met.
Denmark
Target is met
Finland
Target is met
Iceland
Target is met
Norway
Target is met
Sweden
Target is met
Target 2.2
By 2030, end all forms of malnutrition, including achieving, by 2025, the internationally agreed targets on stunting and wasting in children under 5 years of age, and address the nutritional needs of adolescent girls, pregnant and lactating women and older persons
| 2.2.1 | Prevalence of stunting (low height for age) among children under 5 years of age |
| 2.2.2 | Prevalence of wasting (low weight for height) and overweight among children under 5 years of age |
| 2.2.3 | Prevalence of anaemia in women aged 15 to 49 years |
Global trends
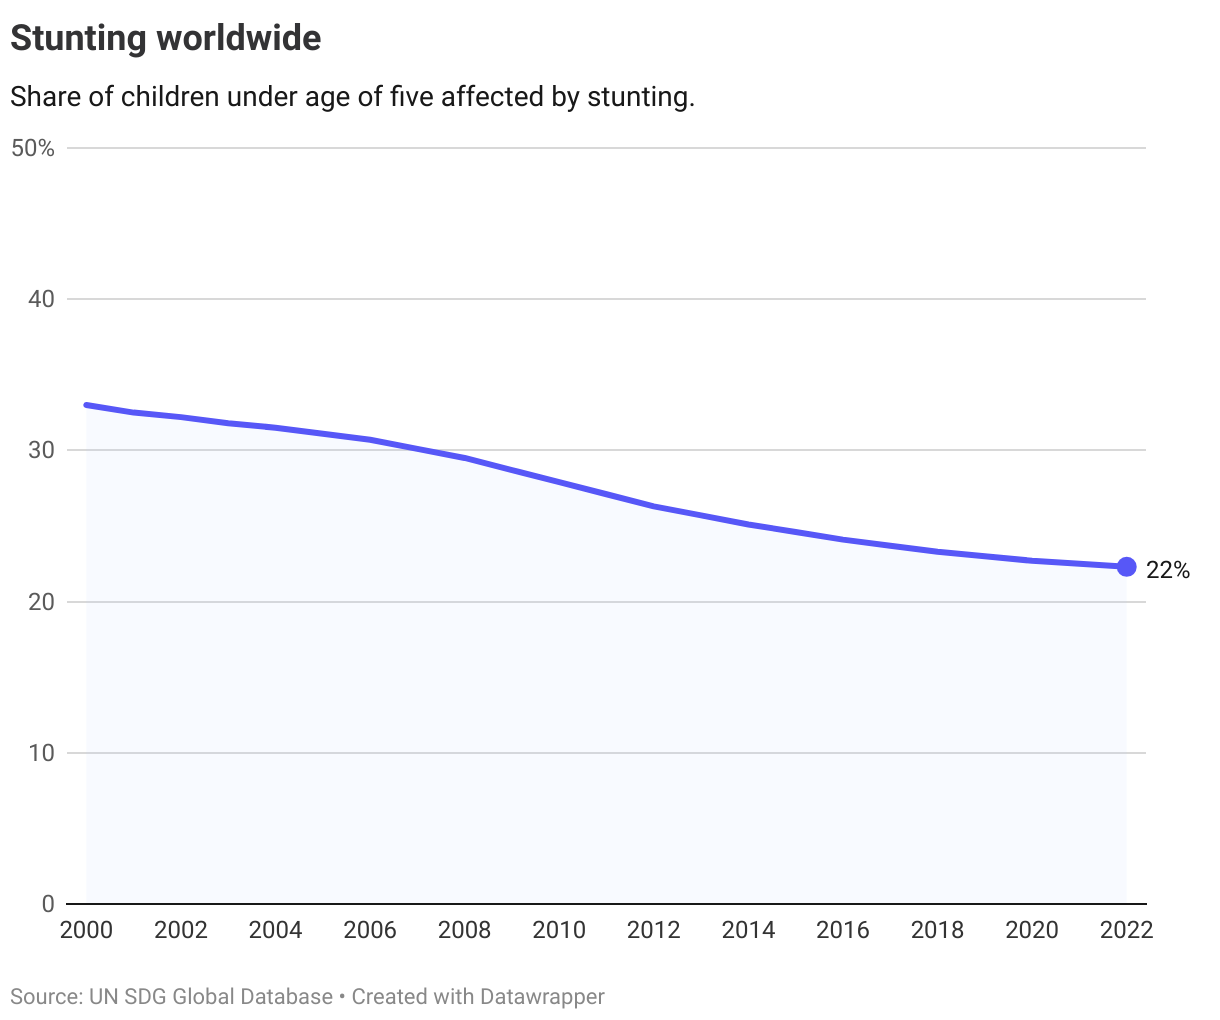
2.2.1 Stunting
Stunting is defined by the World Health Organization (WHO) as “impaired growth and development that children experience from poor nutrition, repeated infection, and inadequate psychosocial stimulation”.
As of 2022, over 22% of children under 5 years of age worldwide (150 million) were affected by stunting, a decline from 33% in 2000 and 25% in 2015. Still, current progress will not be enough to reach the internationally set targets of a 40% reduction (compared to 2012) by 2025, and a 50% reduction by 2030.
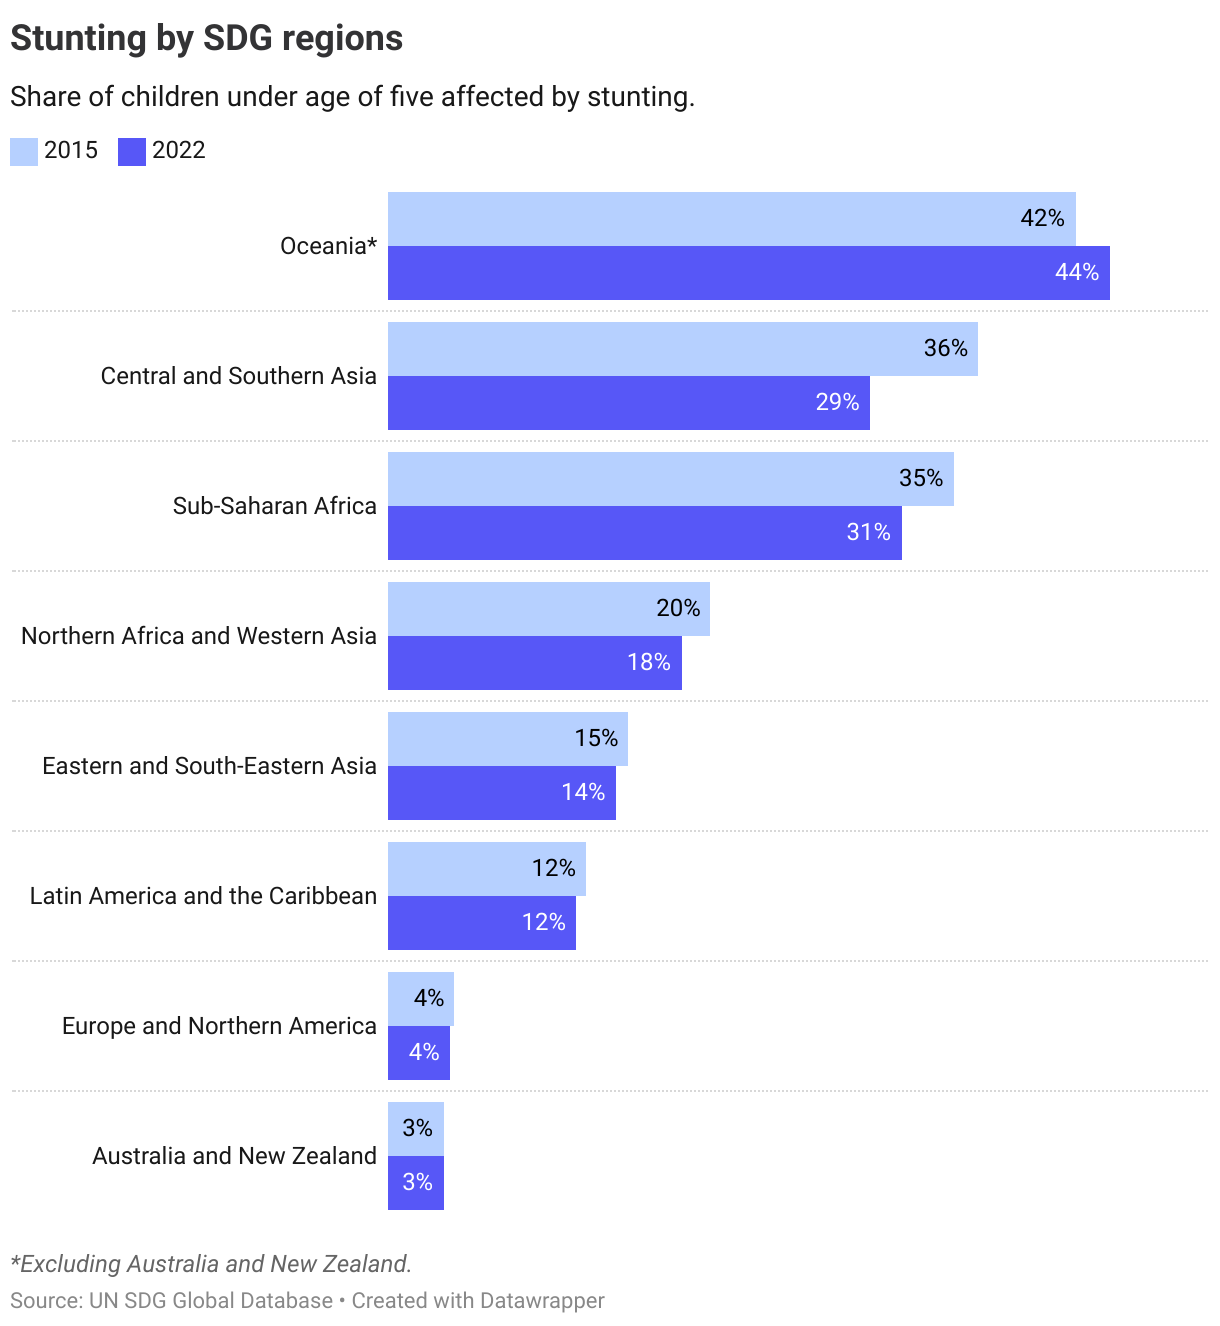
The highest prevalence of stunting is found in Oceania, Sub-Saharan Africa, and Central and Southern Asia. Since 2015, the prevalence has decrease in all regions apart from Oceania.
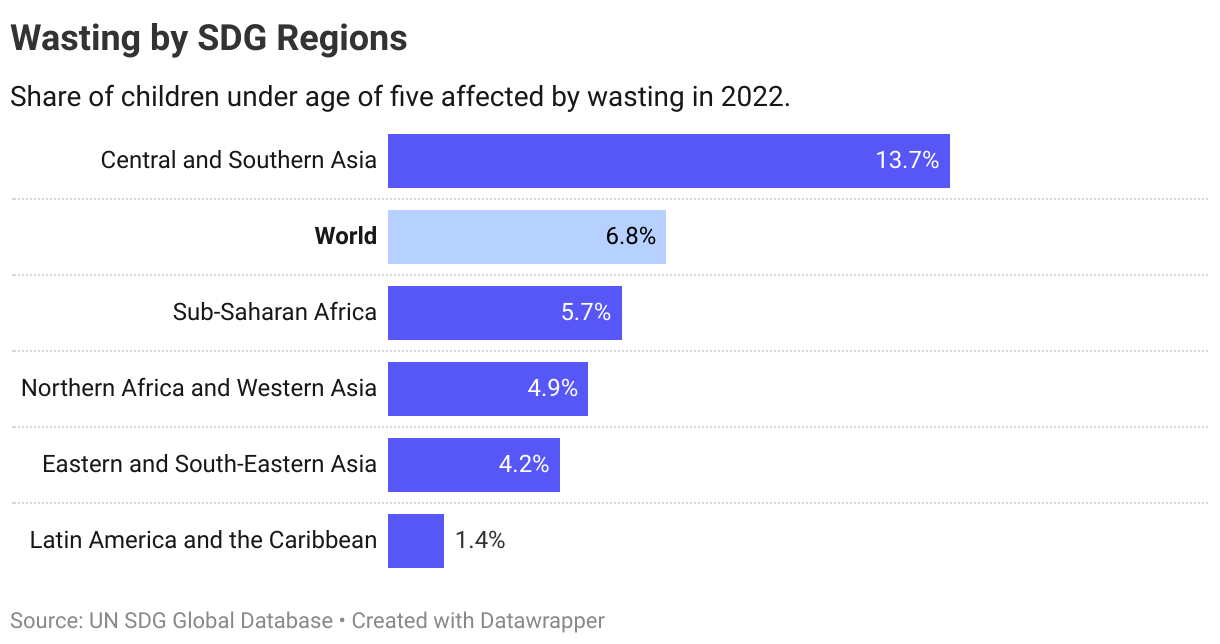
2.2.2. Wasting and overweight
Wasting is defined as a condition where a child has low weight for his or her height, reflecting acute undernutrition. In 2022, the UN estimates that almost 7% of children under 5 years worldwide were affected by wasting. There is a lack of data to assess trends over time, though the current level is above the internationally set target of reducing the prevalence at a global level to 5% in 2025 and 3% in 2030. The prevalence of wasting is particularly high in Central and Southern Asia at over twice the global average.
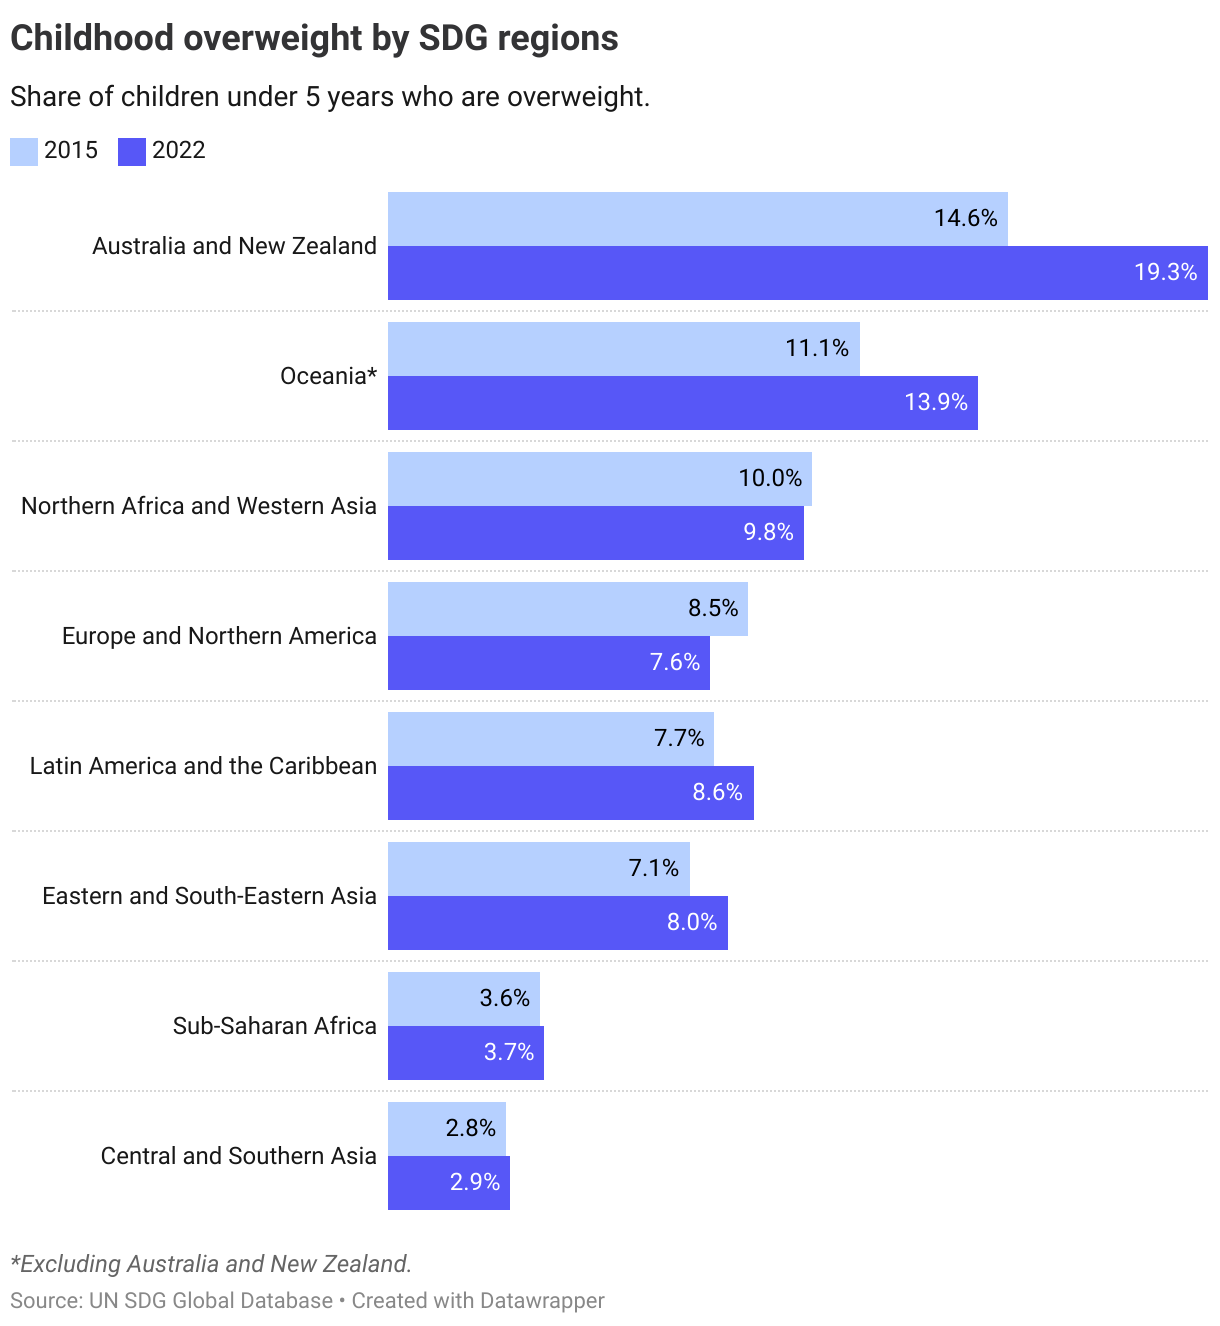
Data also shows that little progress has been made on the prevalence of overweight among children under the age of 5. In 2022, the UN estimates that 5.6% of children under the age of 5 are overweight worldwide. Based on the current trajectory, the internationally set target of reducing the prevalence of children overweight to 3% by 2030 seems out of reach.
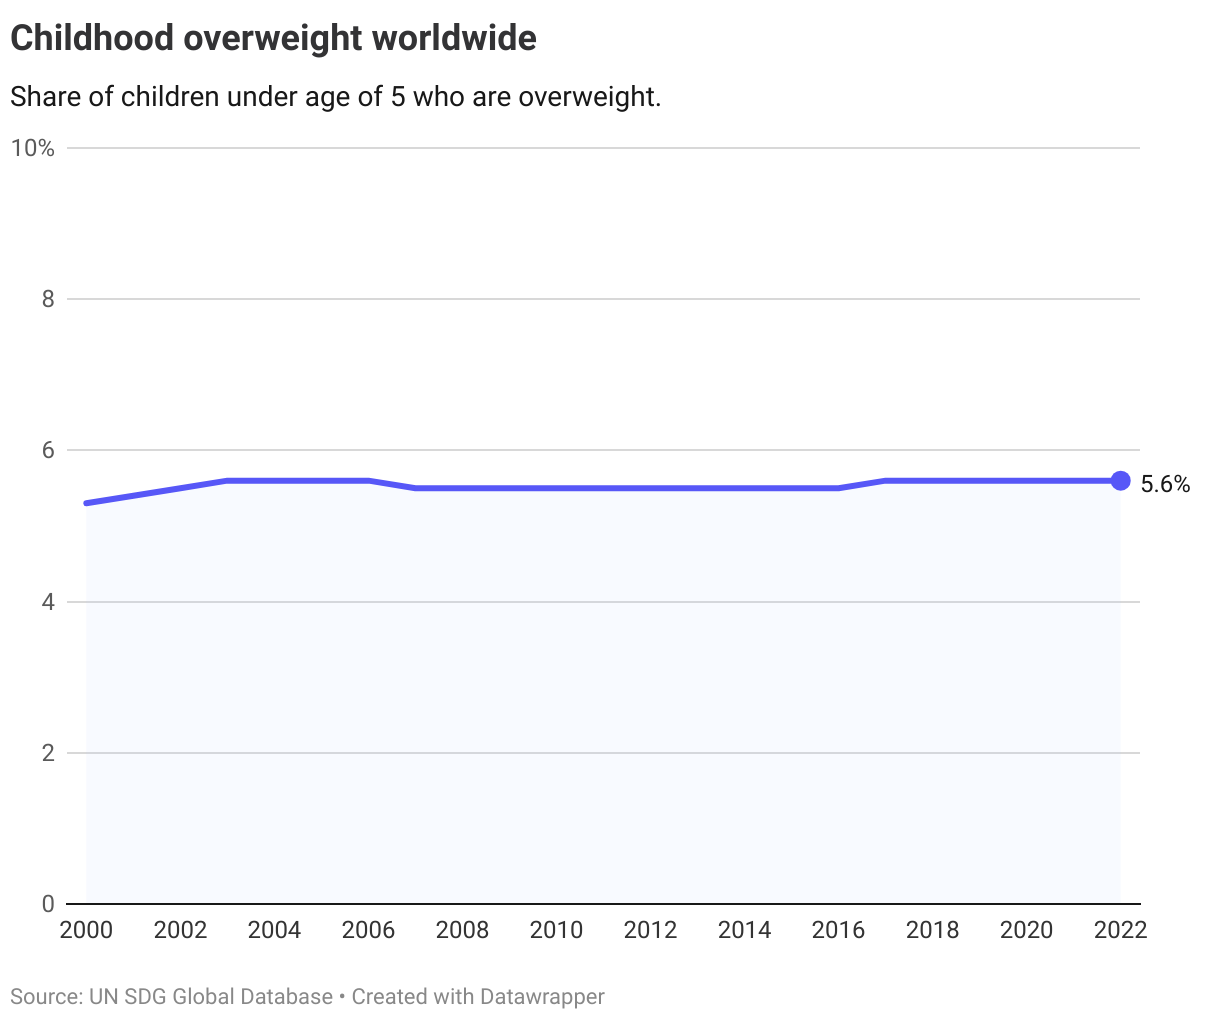
Australia and New Zealand have the highest childhood overweight rates, followed by Oceania, Northern Africa and Western Asia and Europe and Northern America. Between 2015 and 2022, most regions saw increases in overweight rates.
2.2.3. Anaemia
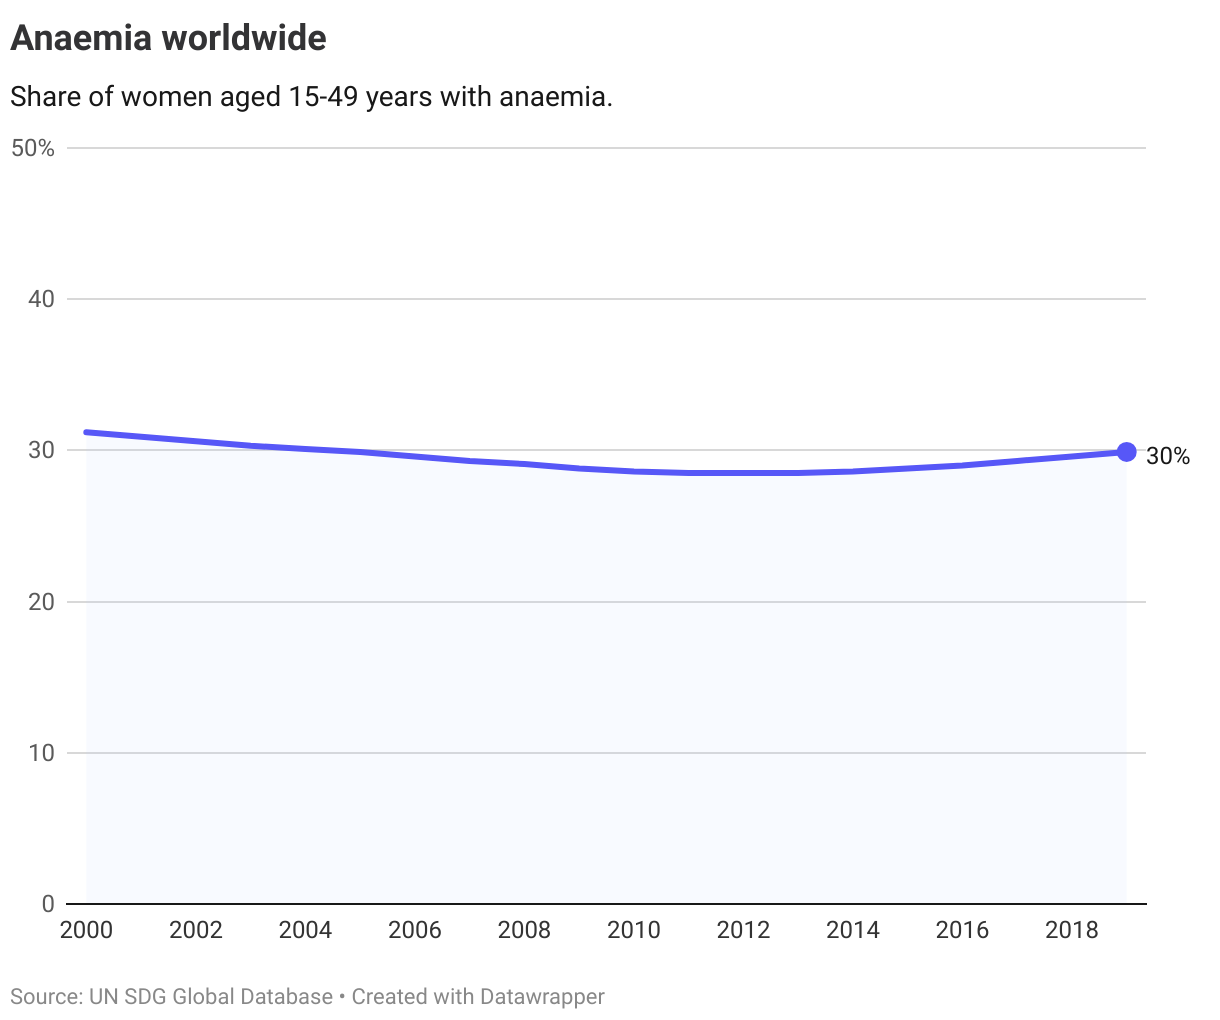
Almost 1 in 3 women worldwide in reproductive age are affected by anaemia, a condition where the number of red blood cells or the haemoglobin concentration within them is lower than normal. This increases the risk of adverse maternal and neonatal outcomes. Globally, the prevalence of anaemia has remained unchanged over the past two decades.
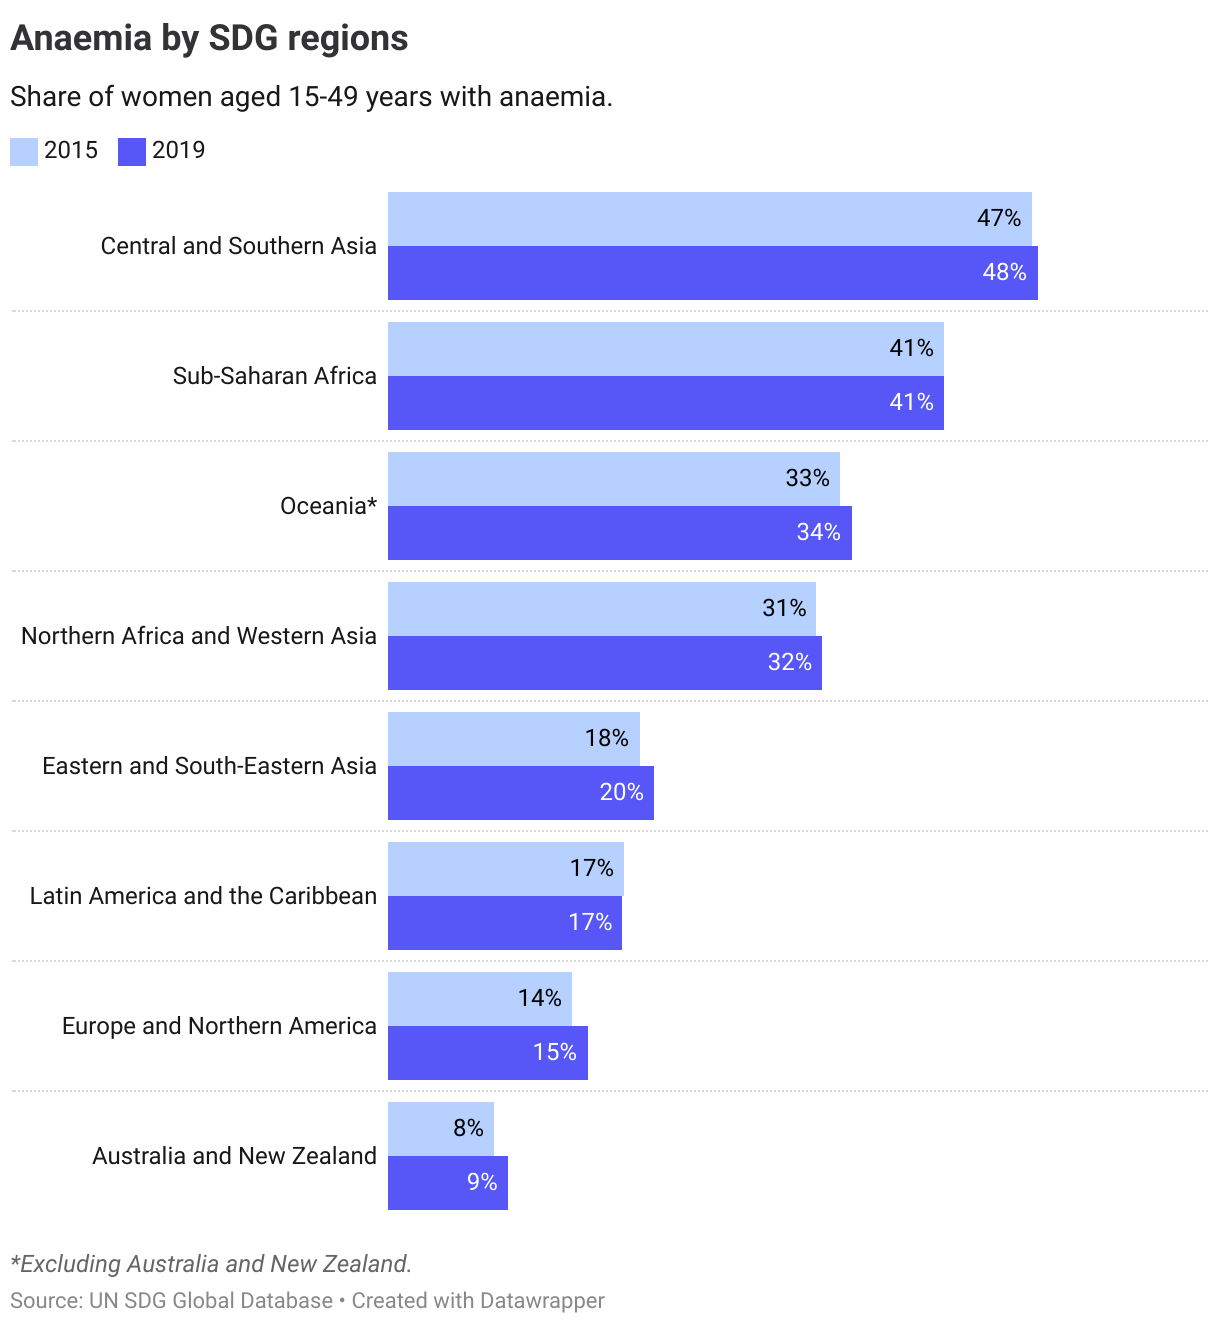
The prevalence of anaemia varies considerably between regions, with the levels in Sub-Saharan Africa and Central and Southern Asia almost three times as high as in Europe and Northern America. As of now, the target of reducing the prevalence of anaemia by 50% before 2030 looks unlikely to be reached with no regions seeing any significant changes in the past years.
The Nordics
2.2.2. Obesity
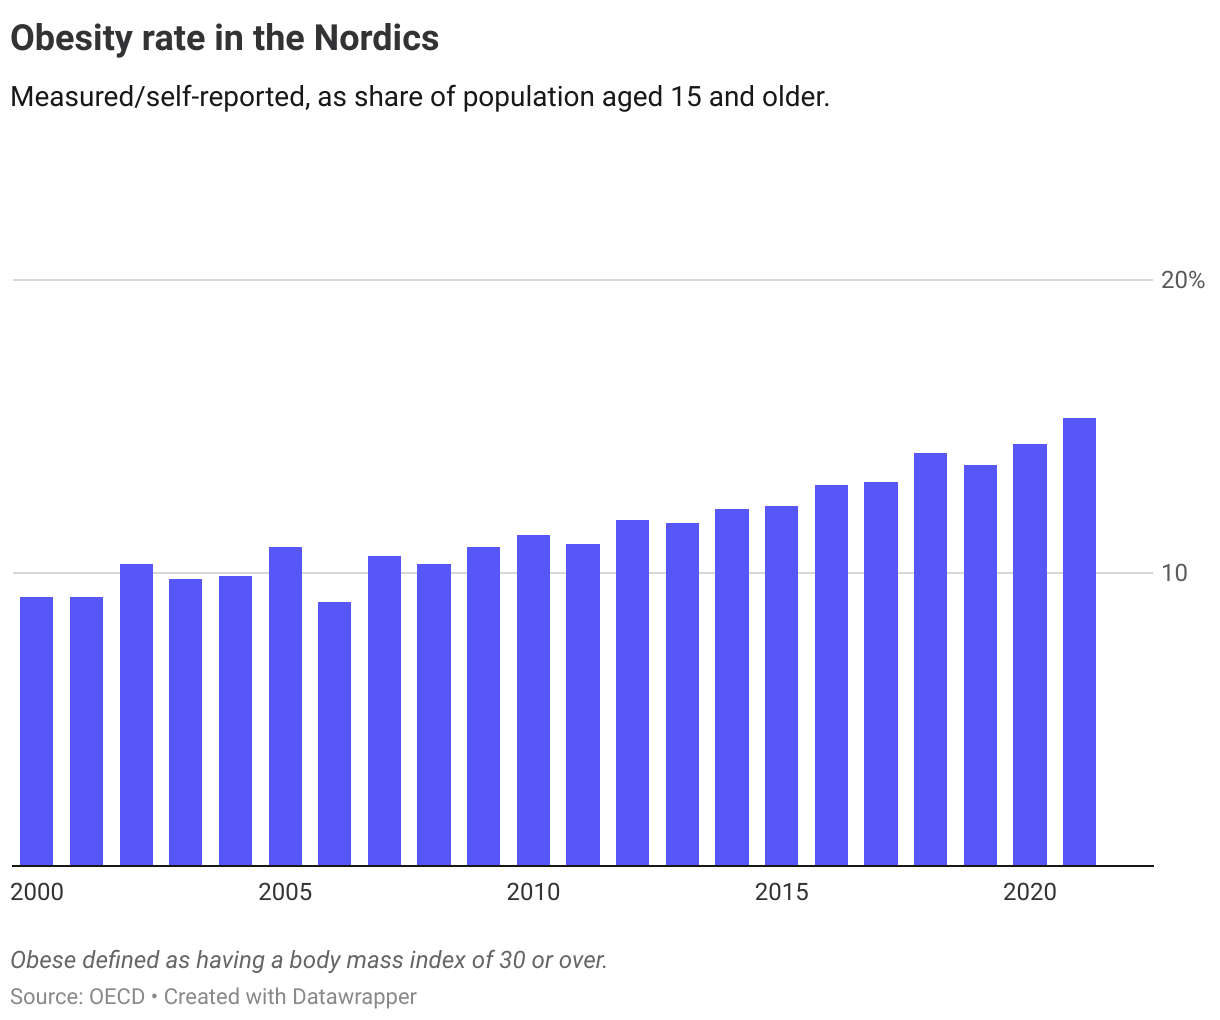
With regards to the prevalence of childhood overweight, there is no data available for the Nordic countries from the UN SDG Global Database. The gauge malnutrition in OECD countries, the OECD includes an indicator on the obesity rate among the general population.
The obesity rate has increased in almost all OECD countries over the past two decades. The Nordics are no exception to this trend, and although data is not available for all years, all countries have higher rates in the latest year (2017-2022) compared to the level at the start of the millennium (2000-2002). No Nordic country is therefore close to the target level operationalised at 3%.
2.2.3. Anaemia
The latest data from 2019 show that the Nordic countries have a slightly lower prevalence than the average for the Europe and Northern America region as a whole (15% in 2019). Still, the prevalence of anaemia has been on the rise in the last decade in all the Nordic countries. At present trends, no Nordic country is on track to reach the target of reducing the prevalence of anaemia to below 3% by 2030.
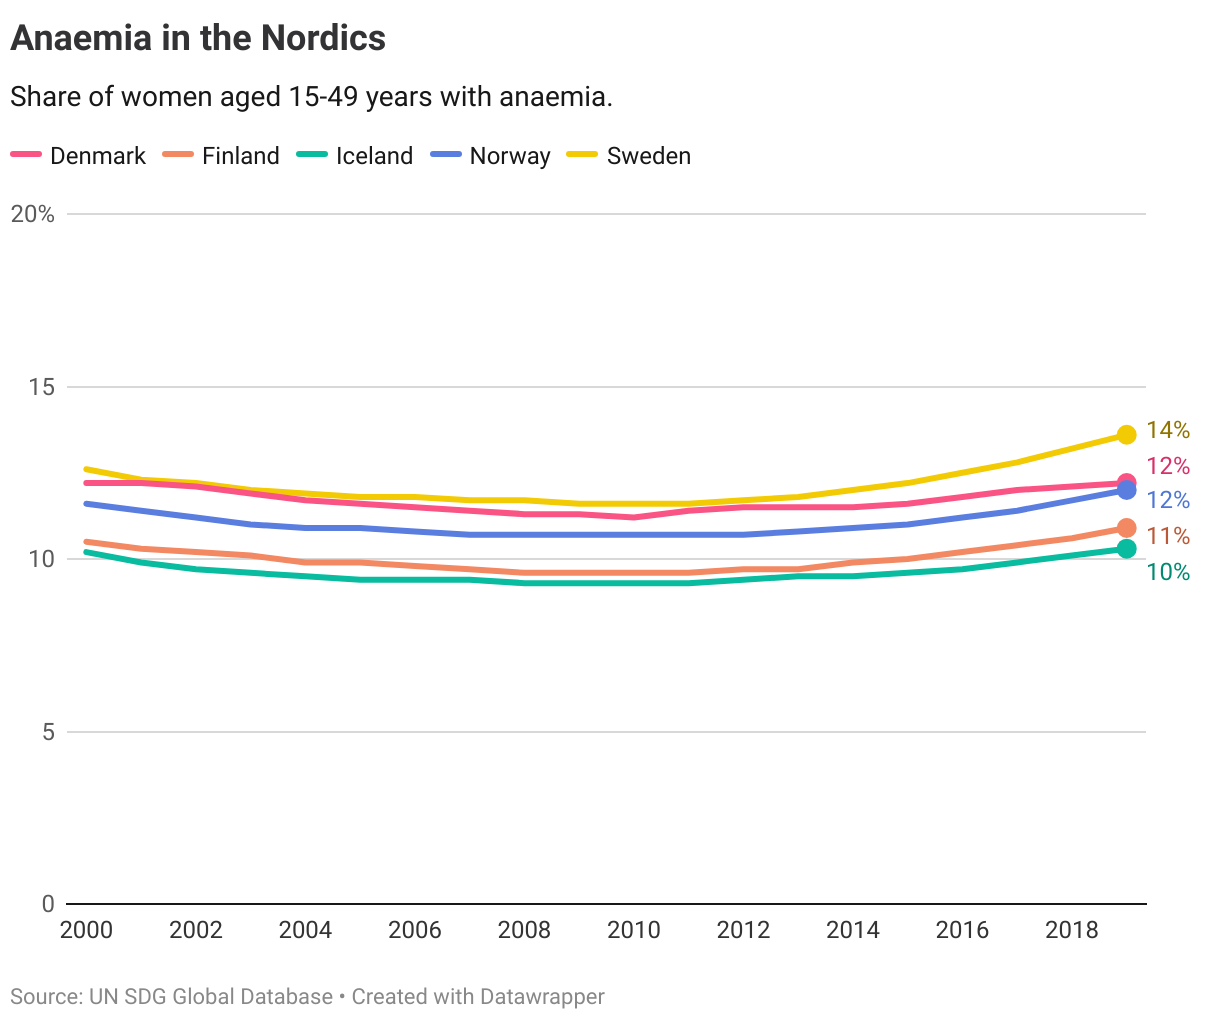
Looking at the two indicators combined the overall assessment is that all the Nordics are at a long distance away from the target and moving further away from it.
Denmark
Long distance to target, not progressing
Finland
Long distance to target, not progressing
Iceland
Long distance to target, not progressing
Norway
Long distance to target, not progressing
Sweden
Long distance to target, not progressing
Target 2.3
By 2030, double the agricultural productivity and incomes of small-scale food producers, in particular women, indigenous peoples, family farmers, pastoralists and fishers, including through secure and equal access to land, other productive resources and inputs, knowledge, financial services, markets and opportunities for value addition and non-farm employment
| 2.3.1 | Volume of production per labour unit by classes of farming/pastoral/forestry enterprise size |
| 2.3.2 | Average income of small-scale food producers |
Global trends
No data is available to measure progress on this indicator.
The Nordics
No data is available to measure progress on this indicator.
Target 2.4
By 2030, ensure sustainable food production systems and implement resilient agricultural practices that increase productivity and production, that help maintain ecosystems, that strengthen capacity for adaptation to climate change, extreme weather, drought, flooding and other disasters and that progressively improve land and soil quality
| 2.4.1 | Proportion of agricultural area under productive and sustainable agriculture |
Global trends
The indicator is currently under development, and there is insufficient data to measure trends at a global or regional level.
The Nordics
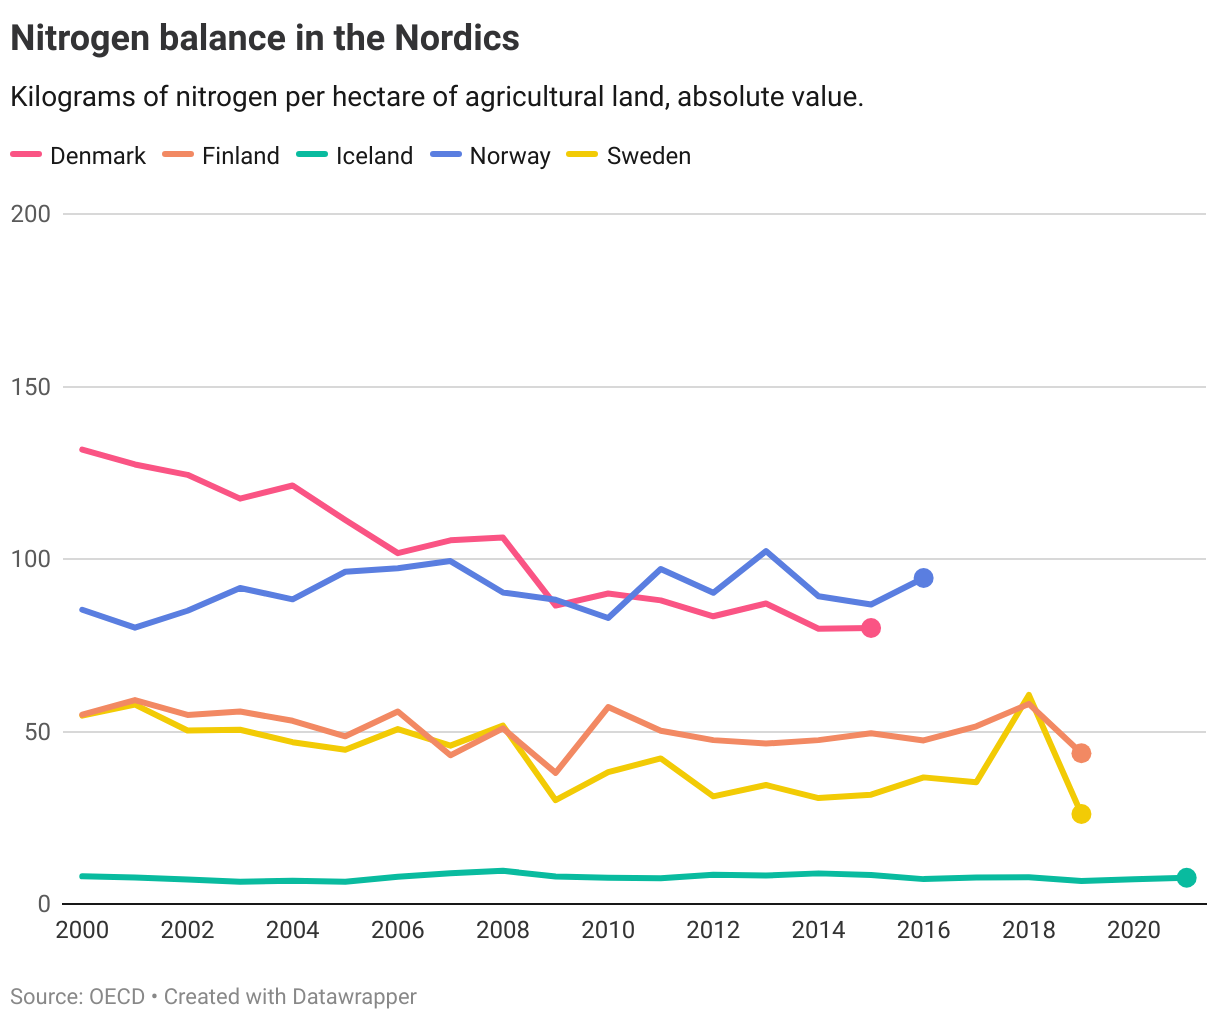
To assess the environmental impact of the agricultural sector in OECD countries, the OECD uses an indicator on nitrogen balance for evaluating SDG progress on target 2.4. Nitrogen surpluses contribute to water and air pollution, while agricultural areas with sustained nutrient deficits may experience reduced soil fertility. A zero nitrogen surplus can be considered an aspirational target for 2030.
Data for Nordic countries on this indicator show that all countries, except for Iceland, have a large distance to the target of zero nitrogen surplus. Over the last decades, nitrogen surplus levels have declined in Sweden, Denmark, and Finland, while no decreasing trend can be seen in Norway. The overall assessment is therefore mixed, with no Nordic country on track to reach the target by 2030.
Denmark
Long distance to target but progressing
Finland
Long distance to target but progressing
Iceland
Short distance to target
Norway
Long distance to target, not progressing
Sweden
Long distance to target but progressing
Target 2.5
By 2020, maintain the genetic diversity of seeds, cultivated plants and farmed and domesticated animals and their related wild species, including through soundly managed and diversified seed and plant banks at the national, regional and international levels, and promote access to and fair and equitable sharing of benefits arising from the utilization of genetic resources and associated traditional knowledge, as internationally agreed.
| 2.5.1 | Number of (a) plant and (b) animal genetic resources for food and agriculture secured in either medium- or long-term conservation facilities |
| 2.5.2 | Proportion of local breeds classified as being at risk of extinction |
Note that the target was set to be reached by 2020.
Global trends
2.5.1. Plant and animal genetic resources
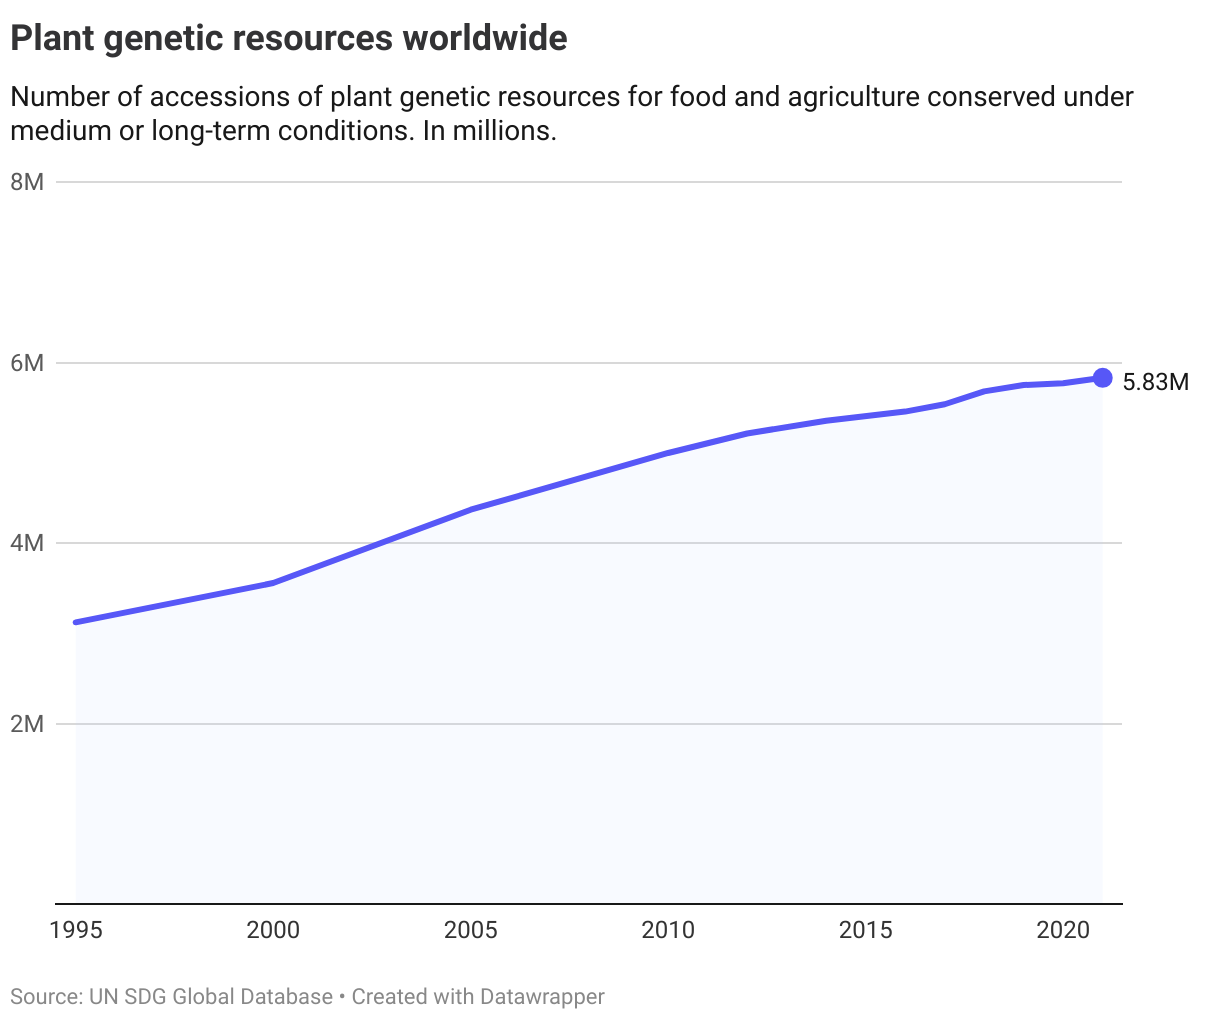
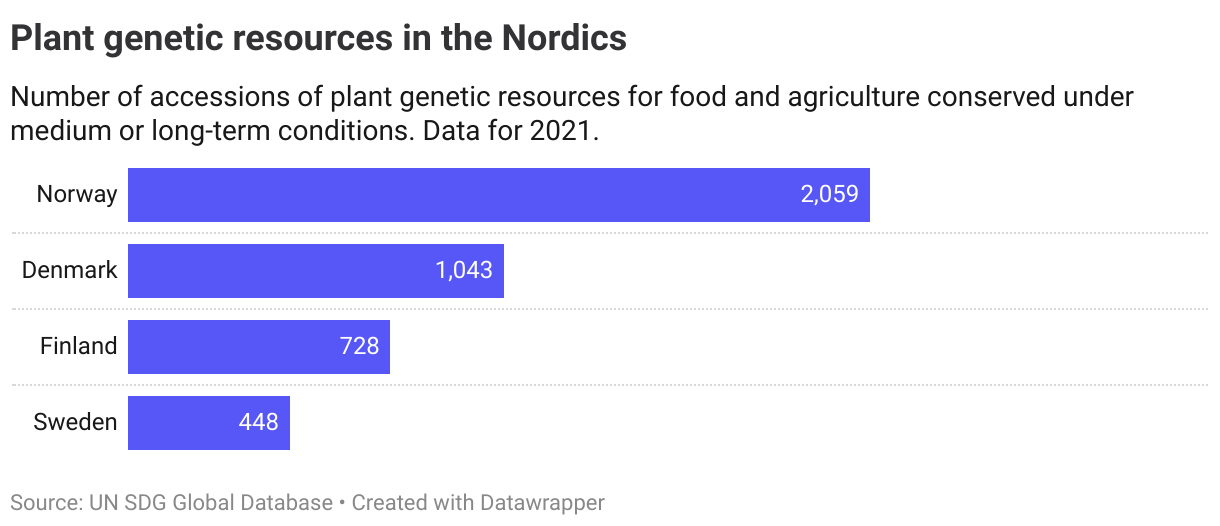
As of 2021, about 5.8 million plant genetic resources for food and agriculture were conserved under medium or long-term conditions. Although this number has nearly doubled since 1995, the growth rate has declined over the past decade. Crop wild relatives, wild food plants, and neglected and underutilized crop species continue to be underrepresented in ex situ collections, according the UN. (Ex situ collections: plant genetic resources stored and maintained outside their natural habitat.)
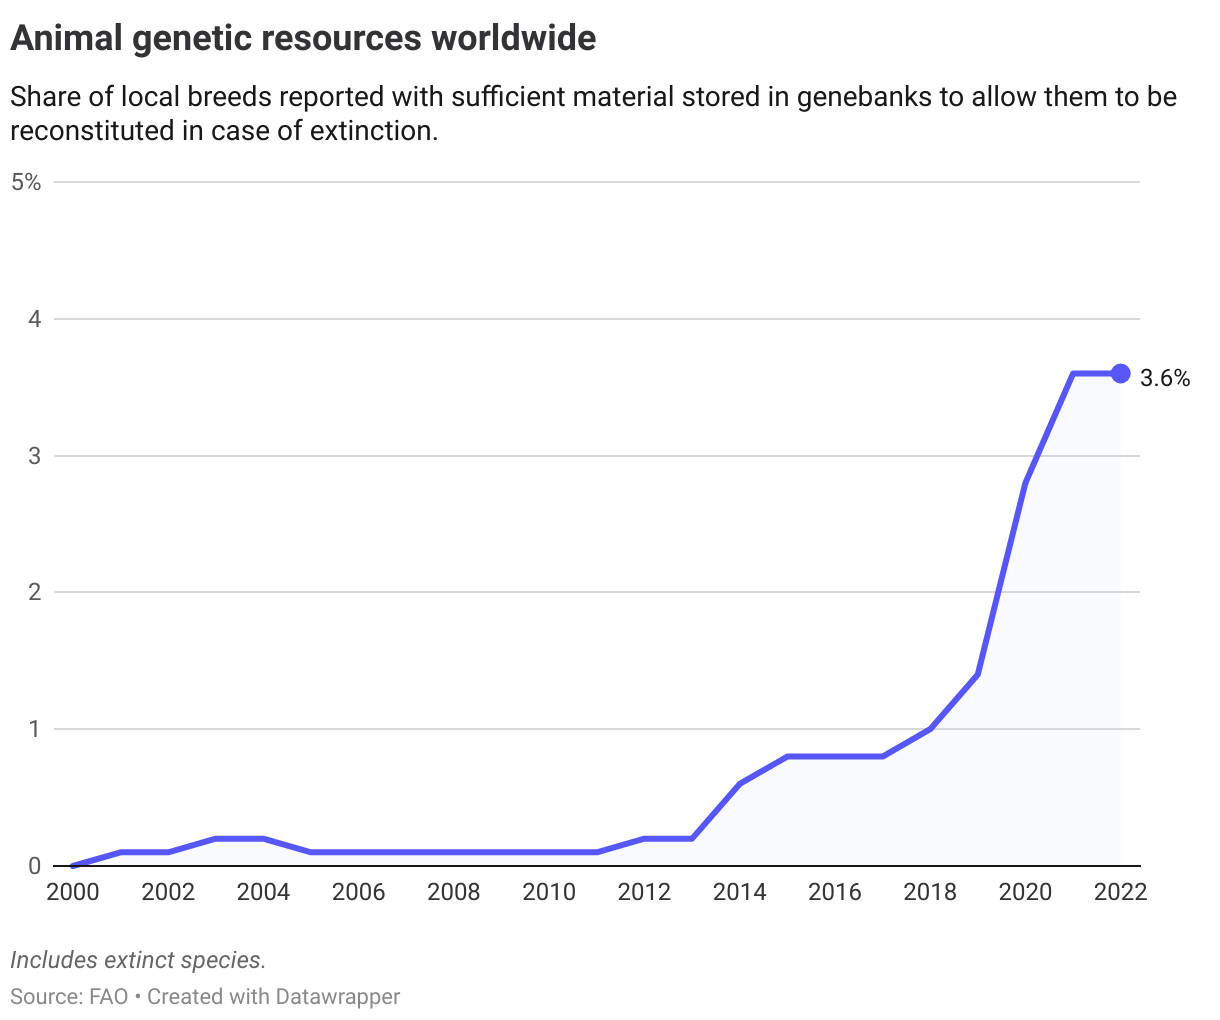
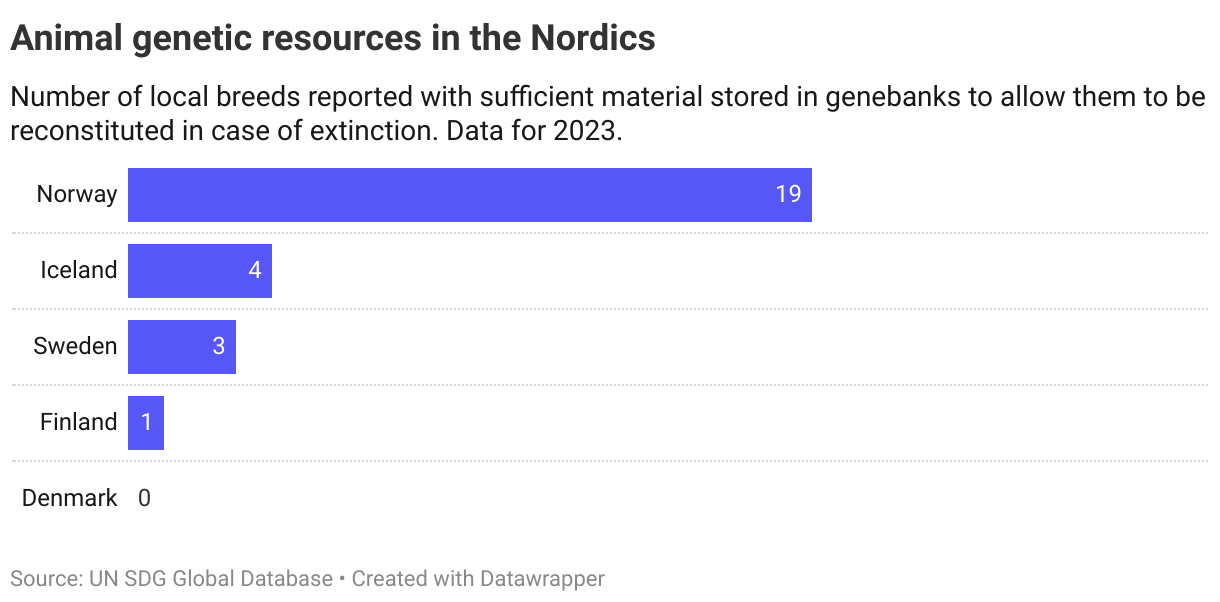
Presently, only 277 out of 7,704 local livestock breeds (3.6%) are reported as having enough material stored in gene banks to allow them to be reconstituted in case of extinction.
2.5.2. Local breeds at risk of extinction
There is limited data on the share of local breeds classified as being at risk of extinction, and the UN does not provide a current global progress assessment. Nevertheless, the Food and Agriculture Organization (FAO) estimates that 72% of surveyed local livestock breeds were at risk of extinction.
The Nordics
Data on the Nordic countries for this target is limited. Data exists for the number of stored resources, but this does not allow for cross-country comparison or measurement of progress against a set target.
The share of local breeds at risk is the only indicator for this target that can be compared across countries, with the OECD setting the target to less than 3% in 2030. All the Nordic countries have the majority of local breeds classified as being at risk.
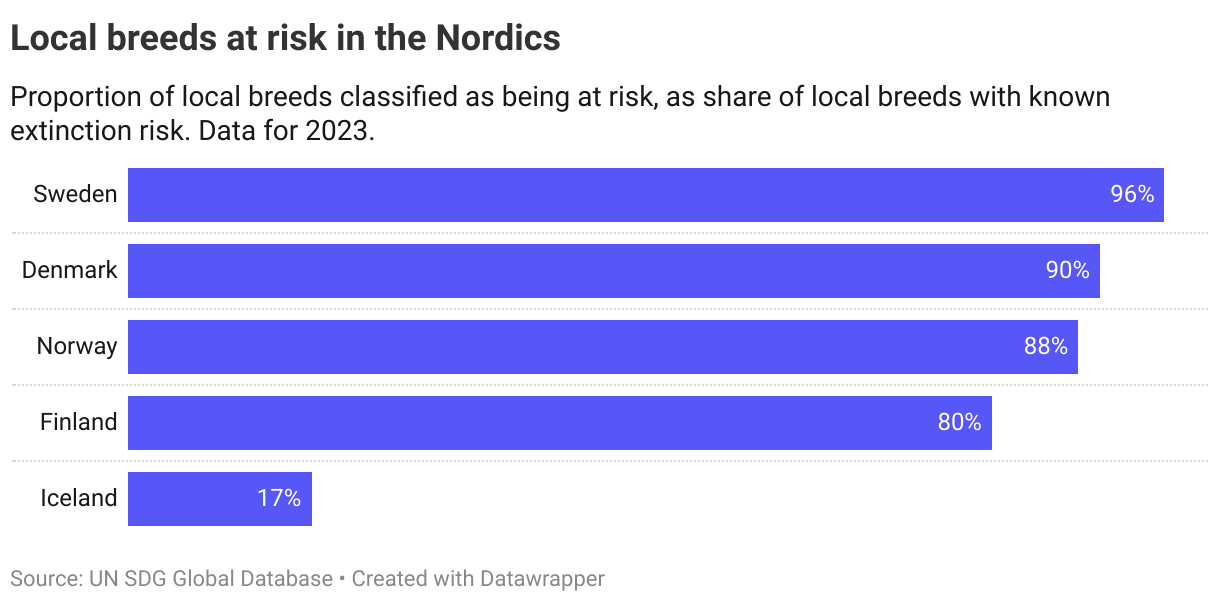
No Nordic country is thus currently on track to reach the target of below 3% in 2030.
Denmark
Long distance to target, not progressing
Finland
Long distance to target, not progressing
Iceland
Long distance to target, not progressing
Norway
Long distance to target, not progressing
Sweden
Long distance to target, not progressing
Target 2.a
Increase investment, including through enhanced international cooperation, in rural infrastructure, agricultural research and extension services, technology development and plant and livestock gene banks in order to enhance agricultural productive capacity in developing countries, in particular least developed countries
| 2.a.1 | The agricultural orientation index (AOI) for government expenditures |
| 2.a.2 | Total official flows (official development assistance plus other official flows) to the agricultural sector |
Global trends
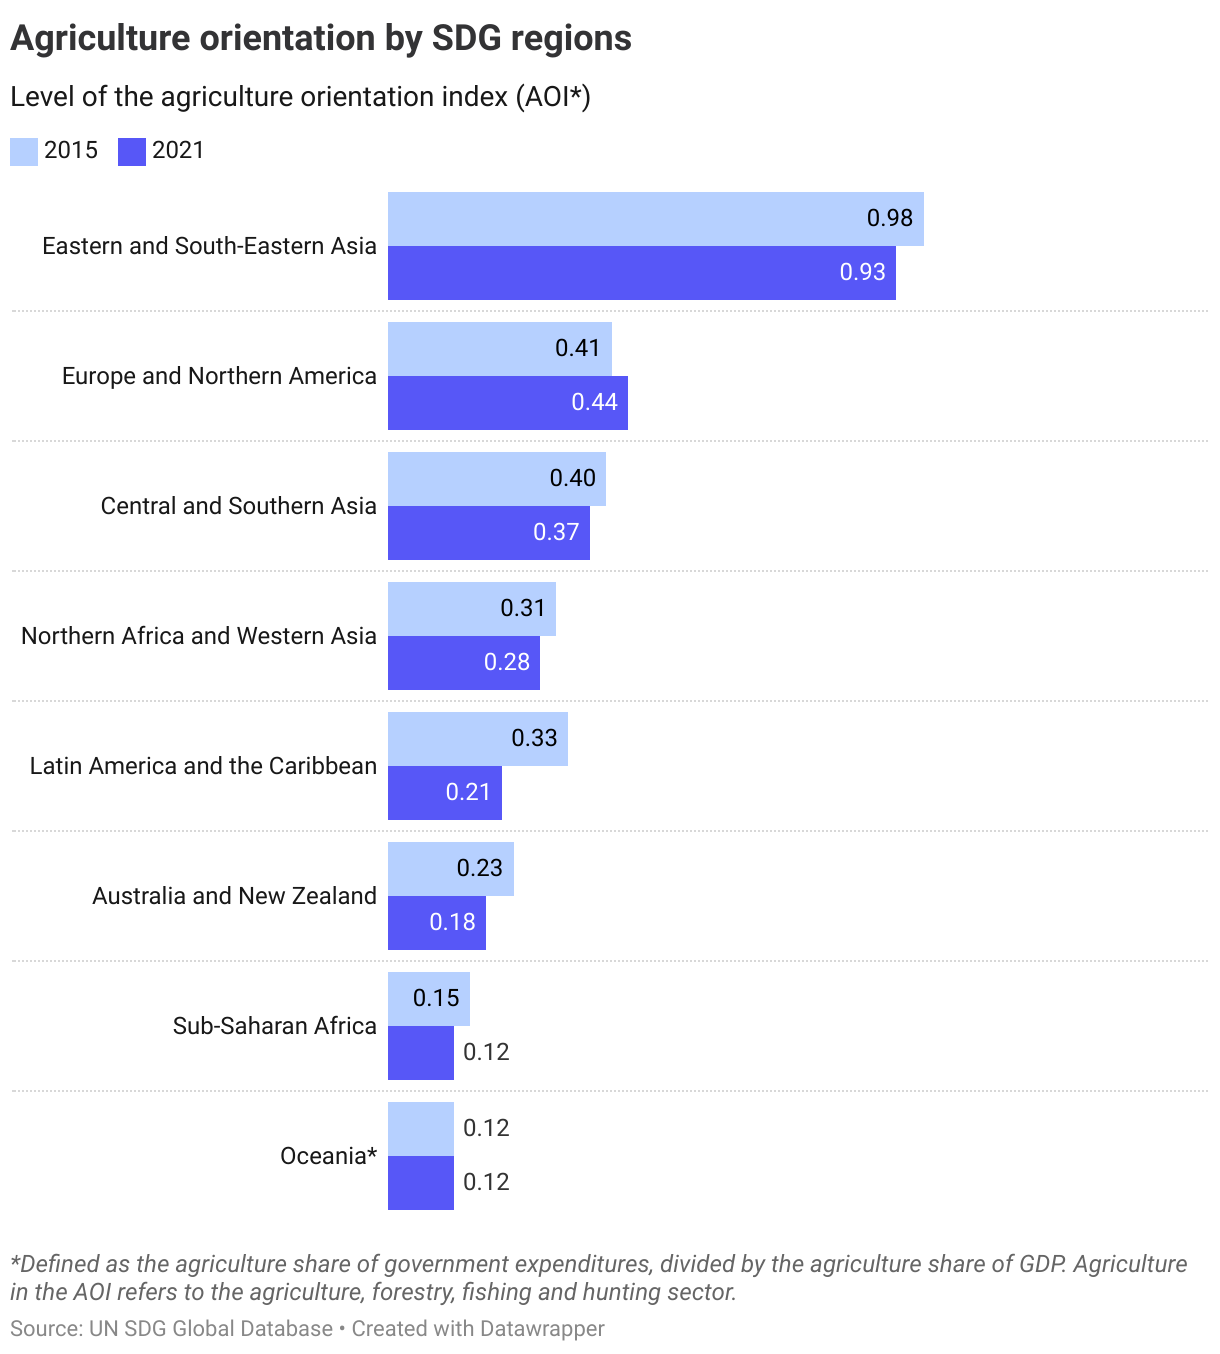
2.a.1. The agricultural orientation index
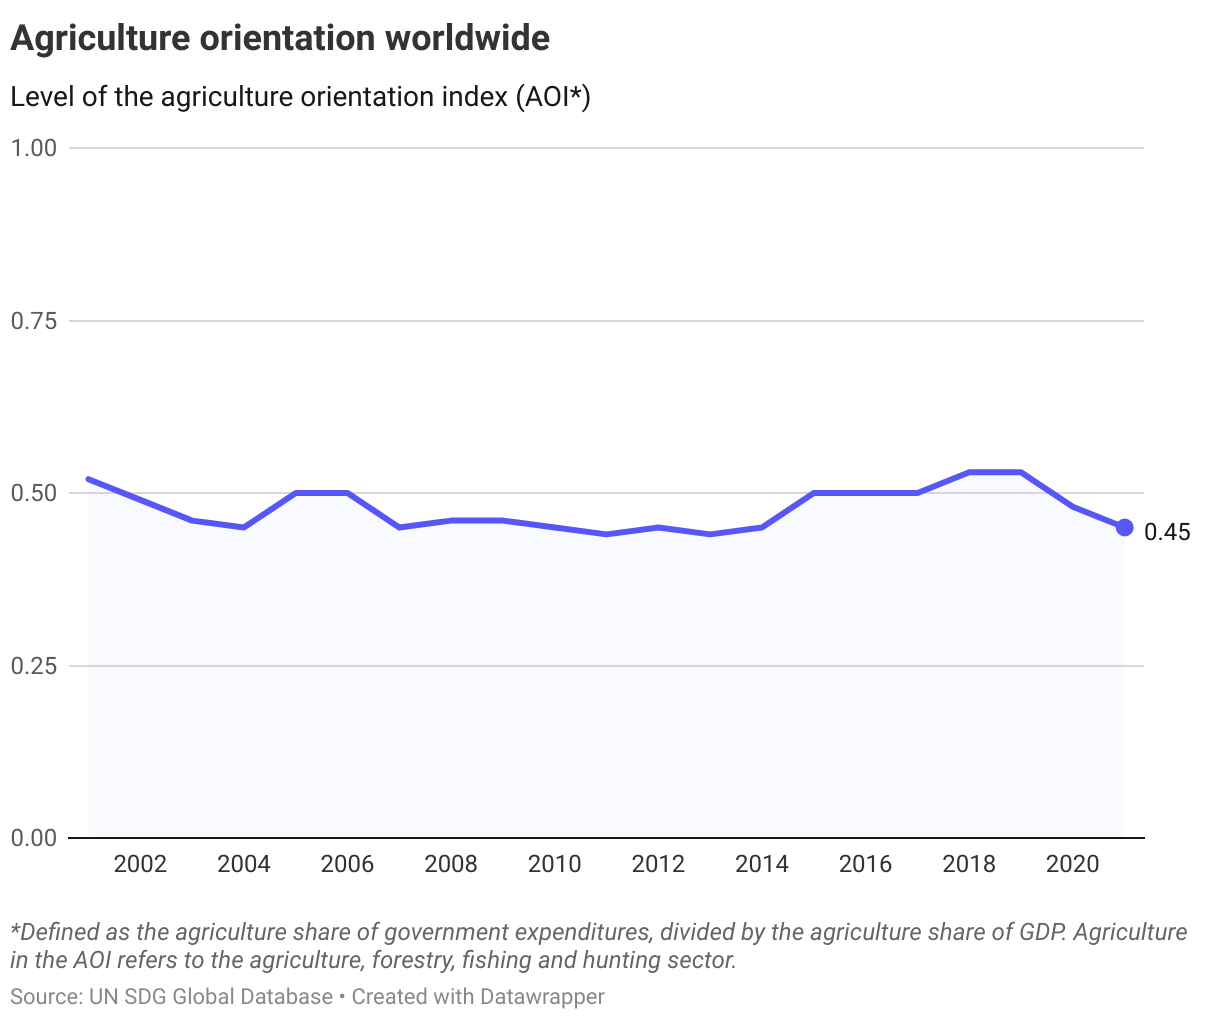
The agricultural orientation index (AOI) is calculated by taking a country’s agricultural share of government expenditure and dividing it by the agricultural share of GDP. As such, it aims to capture the orientation toward the agricultural sector in a country with scores given according to the following methodology:
- An Agriculture Orientation Index (AOI) greater than 1 reflects a higher orientation towards the agriculture sector, with the sector receiving a higher share of government spending relative to its contribution to economic value-added.
- An AOI equal to 1 reflects neutrality in a government’s orientation to the agriculture sector.
- An AOI less than 1 reflects a lower orientation to agriculture.
At the worldwide level, the AOI has remained relatively stable over the past decades. There is currently no set target for this index.
At a regional level, it is currently highest in Eastern and South-Eastern Asia, followed by Europe and Northern America.
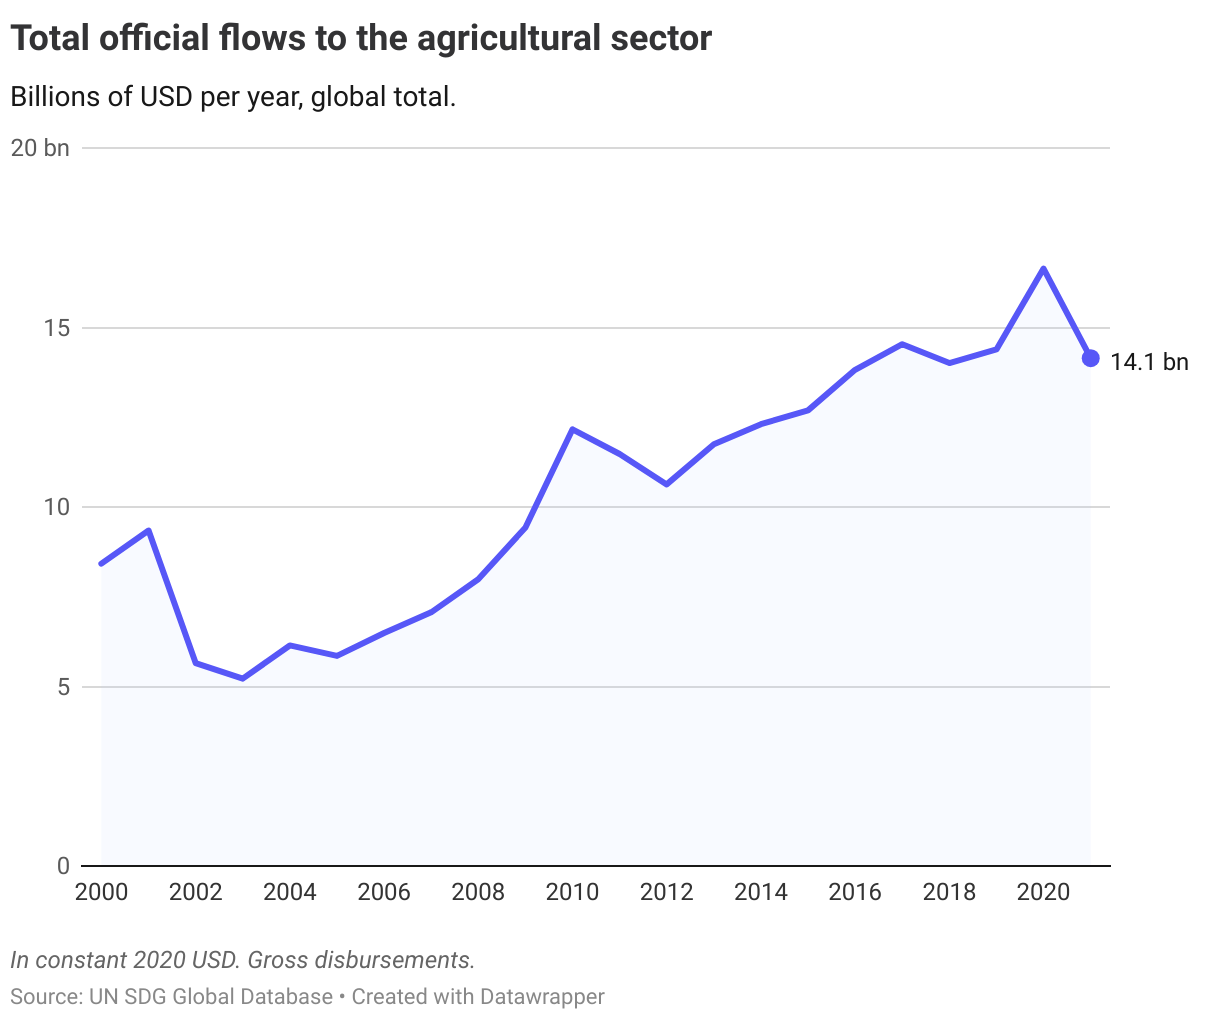
2.a.2. Aid to the agricultural sector
Although the total official development flows to the agricultural sector have increased in absolute volume since 2000, its share of total aid flows has decreased from around 25% in the mid-1980s to approximately 5% in 2019. The UN SDG status report suggests that this shift is primarily due to the increasing aid flows directed towards social sectors.
The Nordics
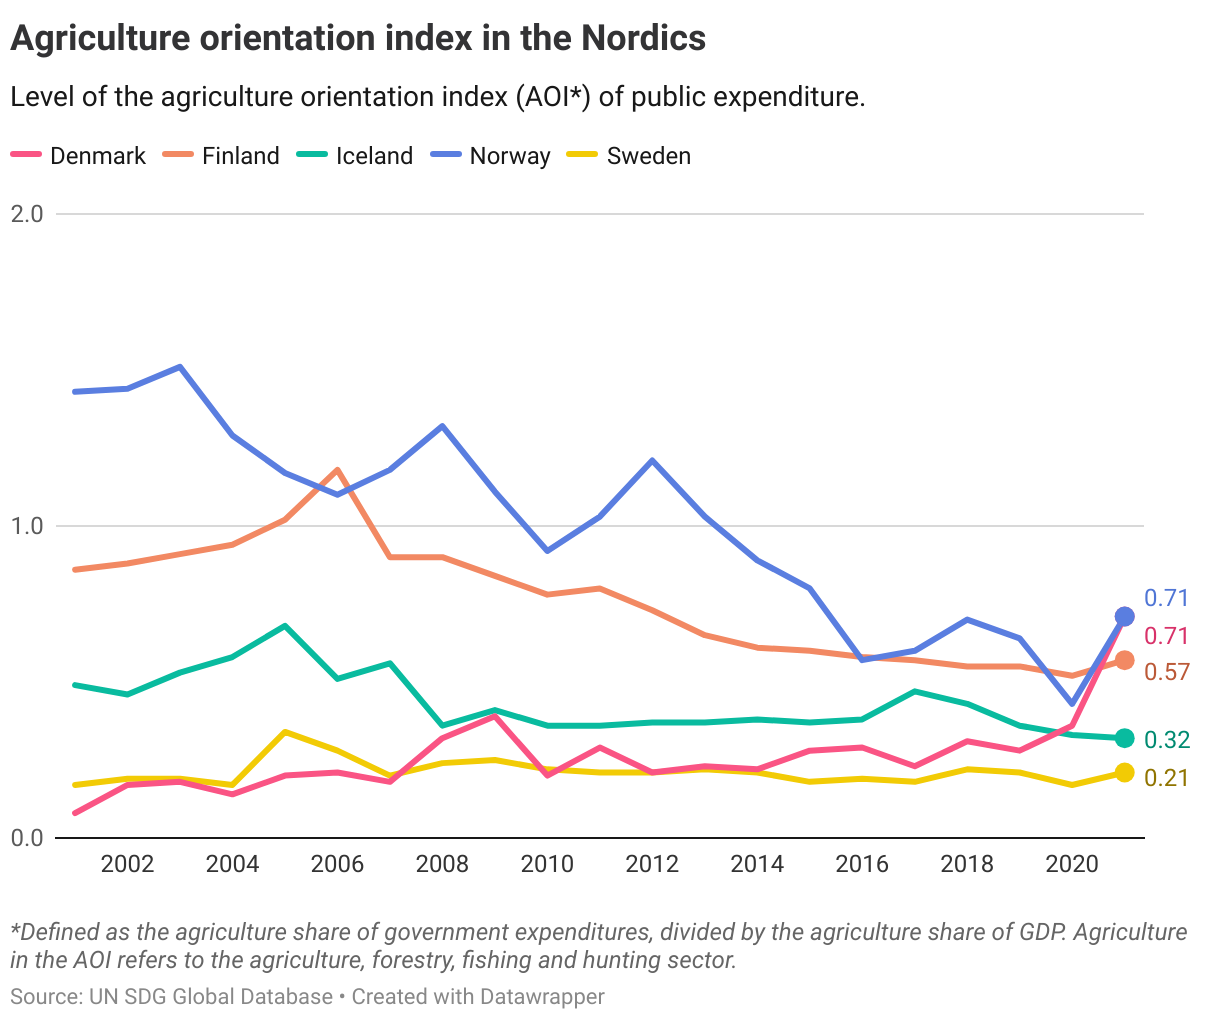
The AOI index presents a varied pattern across the Nordic countries. Norway and Finland have experienced a decline in their index scores over the past two decades, indicating a lower orientation towards the agricultural sector. In contrast, the other Nordic countries initially had lower index scores with less change observed over time. No assessment is given for this indicator as the level of agricultural orientation will depend on the national context and priorities.
Data on official development flow to the agricultural sector is available for the Nordic countries, but only in terms of absolute values, making it unsuitable for an assessment of progress.
Target 2.b
Correct and prevent trade restrictions and distortions in world agricultural markets, including through the parallel elimination of all forms of agricultural export subsidies and all export measures with equivalent effect, in accordance with the mandate of the Doha Development Round
| 2.b.1 | Agricultural export subsidies |
Global trends
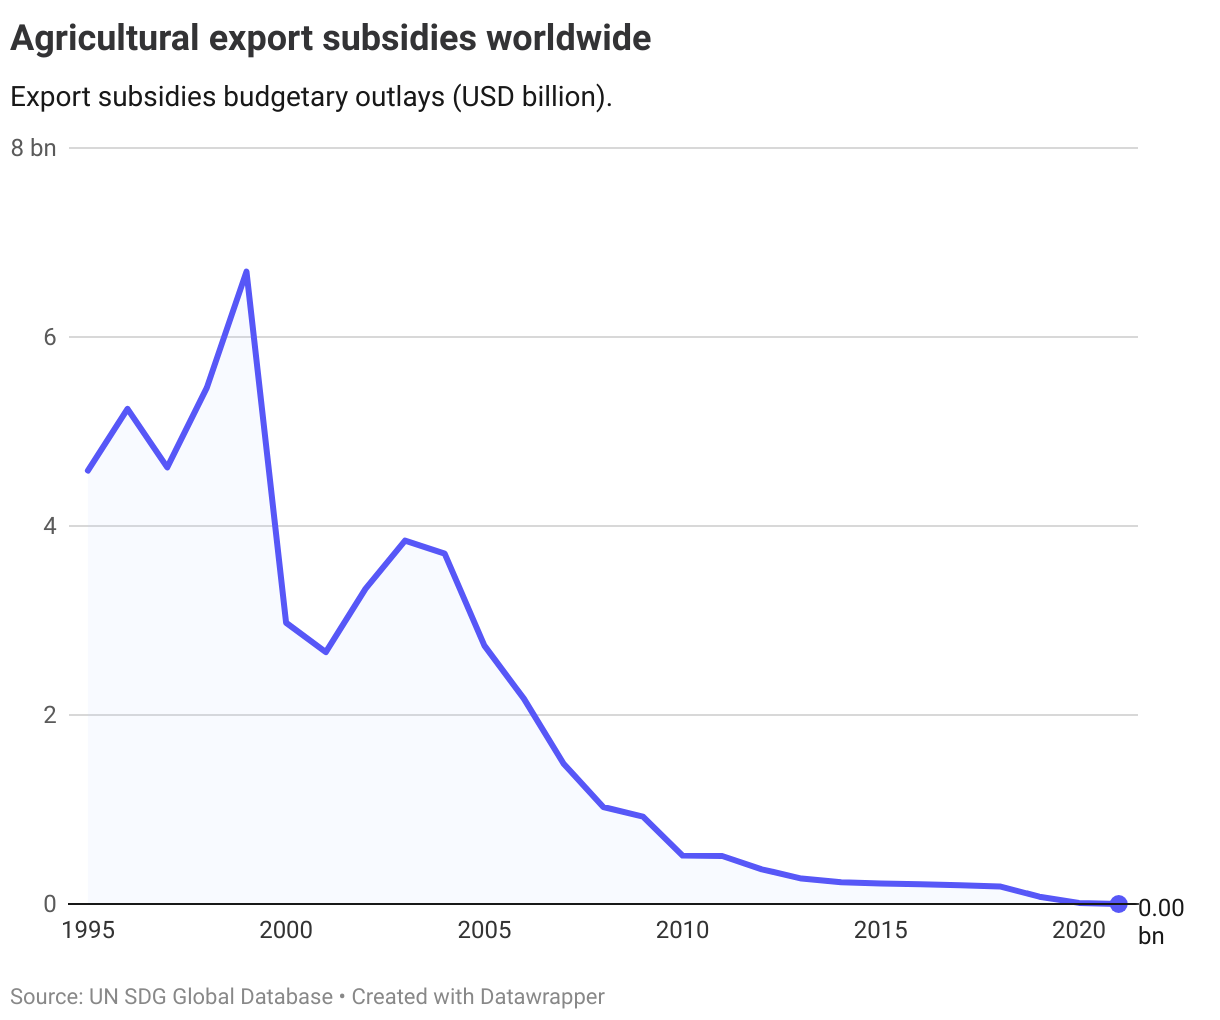
In late 2015, World Trade Organization (WTO) members agreed to eliminate all forms of agricultural export subsidies. Developed countries were required to remove these subsidies immediately, while developing countries had until the end of 2018. Data from the WTO shows that the level of subsidies has been drastically reduced over the past years, and was negligble in 2021.
The Nordics
In line with the OECD methodology, no evaluation is given on a country-level basis for this indicator.
Target 2.c
Adopt measures to ensure the proper functioning of food commodity markets and their derivatives and facilitate timely access to market information, including on food reserves, in order to help limit extreme food price volatility
| 2.c.1 | Indicator of food price anomalies |
Global trends
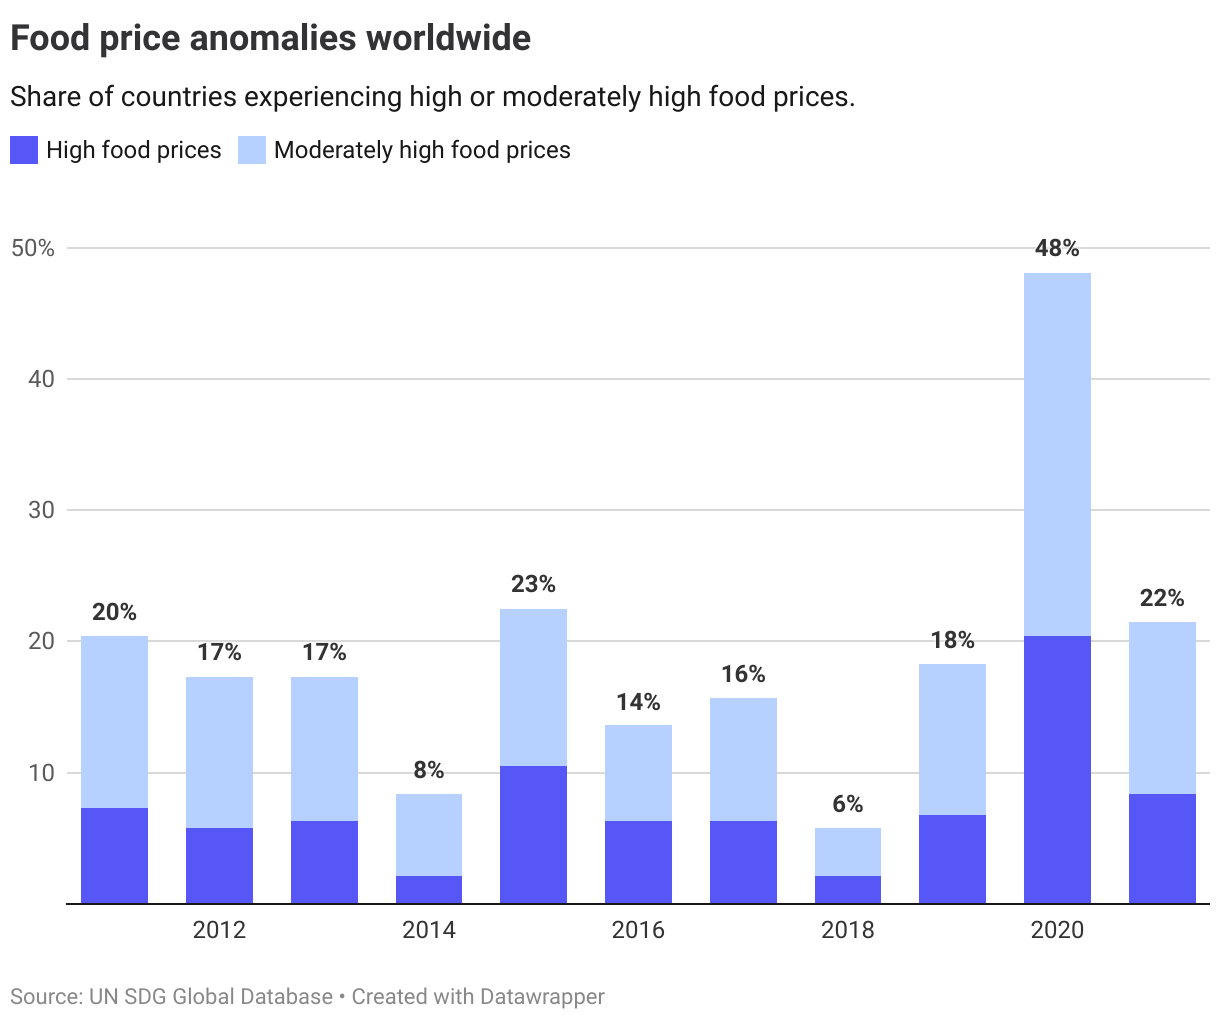
The FAO indicator of food price anomalies (IFPA) aims to capture instances of high or moderately high food prices. According to the IFPA, over 22% of all countries worldwide experienced high or moderately high food prices in 2021, down from 48% in 2020.
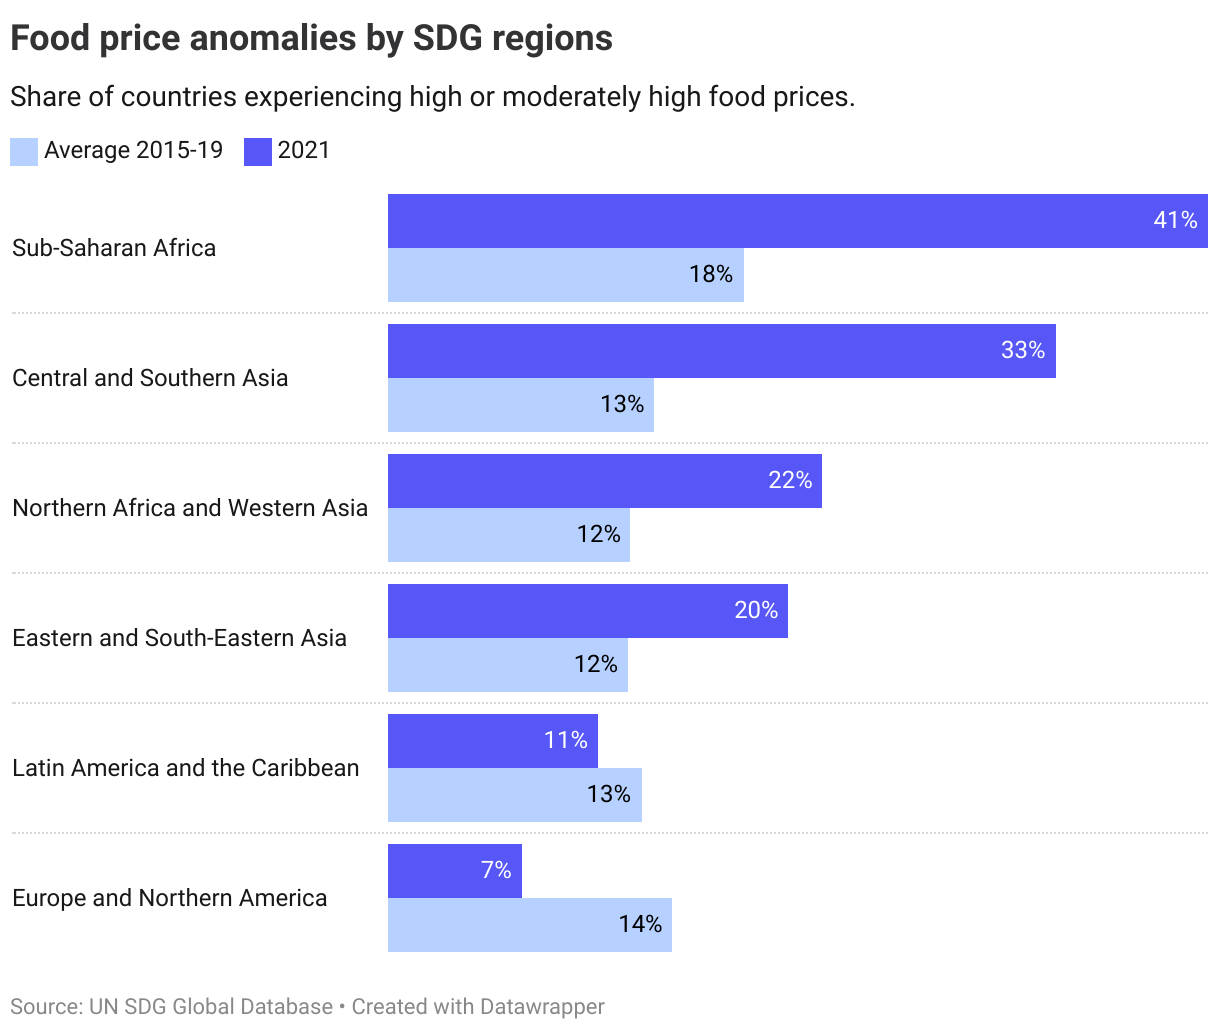
At a regional level, all regions saw an increase in countries experiencing food price anomalies from 2019 to 2020. In 2021 the level has returned closer to 2019 levels in many regions. Still, the prevalence of food price anomalies countinue to be significantly higher in most regions compared to the 2015-19 average.
The Nordics
Data to be updated.