

Introduction
This data tracker analyses the Nordic countries’ progress towards achieving Sustainable Development Goal 15: Protect, restore and promote sustainable use of terrestrial ecosystems, sustainably manage forests, combat desertification, and halt and reverse land degradation and halt biodiversity loss. The goal is comprised of 12 targets.
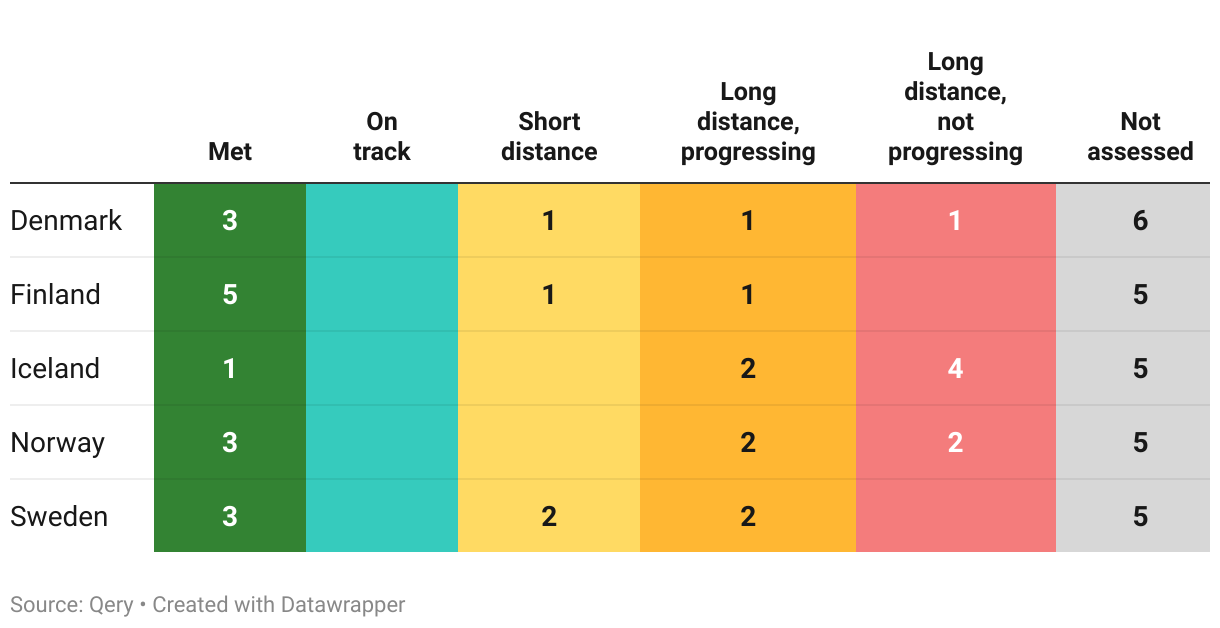
The Nordic countries – Denmark, Finland, Iceland, Norway and Sweden – are classified into one of five categories for each target:
Met: The country has already met the 2030 target.
On track: The country has not yet met the target but is on track to do so by 2030.
Short distance: The country has not met the target and is not projected to do so but is close to achieving it. This category also applies when the country currently meets the target but is projected to move away from it.
Long distance but progressing: The country is far from the target but is making progress towards it.
Long distance and not progressing: The country is far from the target and is not making progress towards reaching it.
Details on the methodology used, together with the overall assessment for all 17 goals, can be found on our overview page. Note that the analysis is currently work in progress.
Overall assessment of progress
As of mid-2023, this is our assessment of the Nordic countries progress on the 12 targets part of SDG 15:
The Nordic countries’ performance on the different targets part of this goal can be explored further below. Each section follows the same structure:
- First, the official target text and related indicators is described and the latest global and regional trends are highlighted briefly.
- Second, where data is available, we then zoom in on the Nordic countries to describe how they are progressing, and assess their likelihood of achieving the target by the 2030 deadline.
- Note that both sections above strictly uses data from the UN SDG Global Database and/or the OECD.
Target 15.1
By 2020, ensure the conservation, restoration and sustainable use of terrestrial and inland freshwater ecosystems and their services, in particular forests, wetlands, mountains and drylands, in line with obligations under international agreements
| 15.1.1 | Forest area as a proportion of total land area |
| 15.1.2 | Proportion of important sites for terrestrial and freshwater biodiversity that are covered by protected areas, by ecosystem type |
Global trends
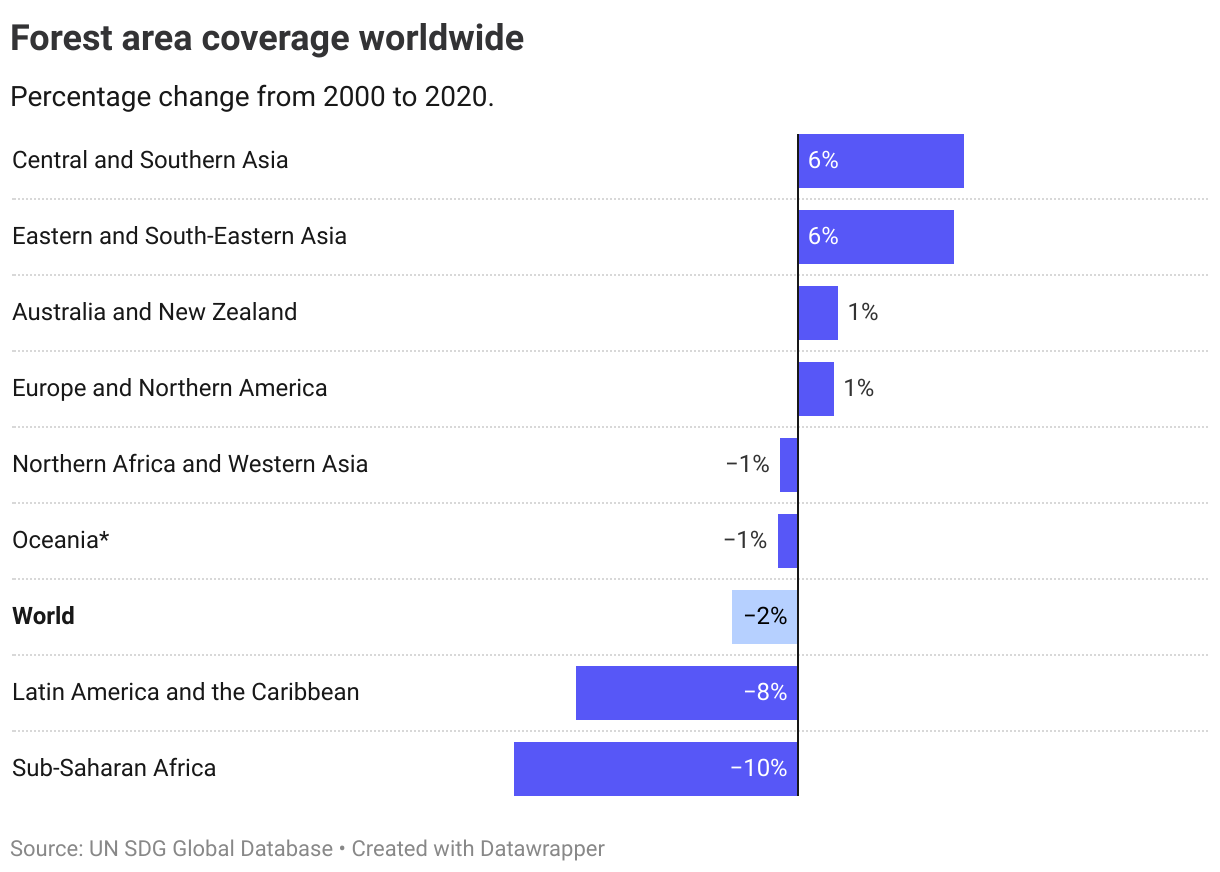
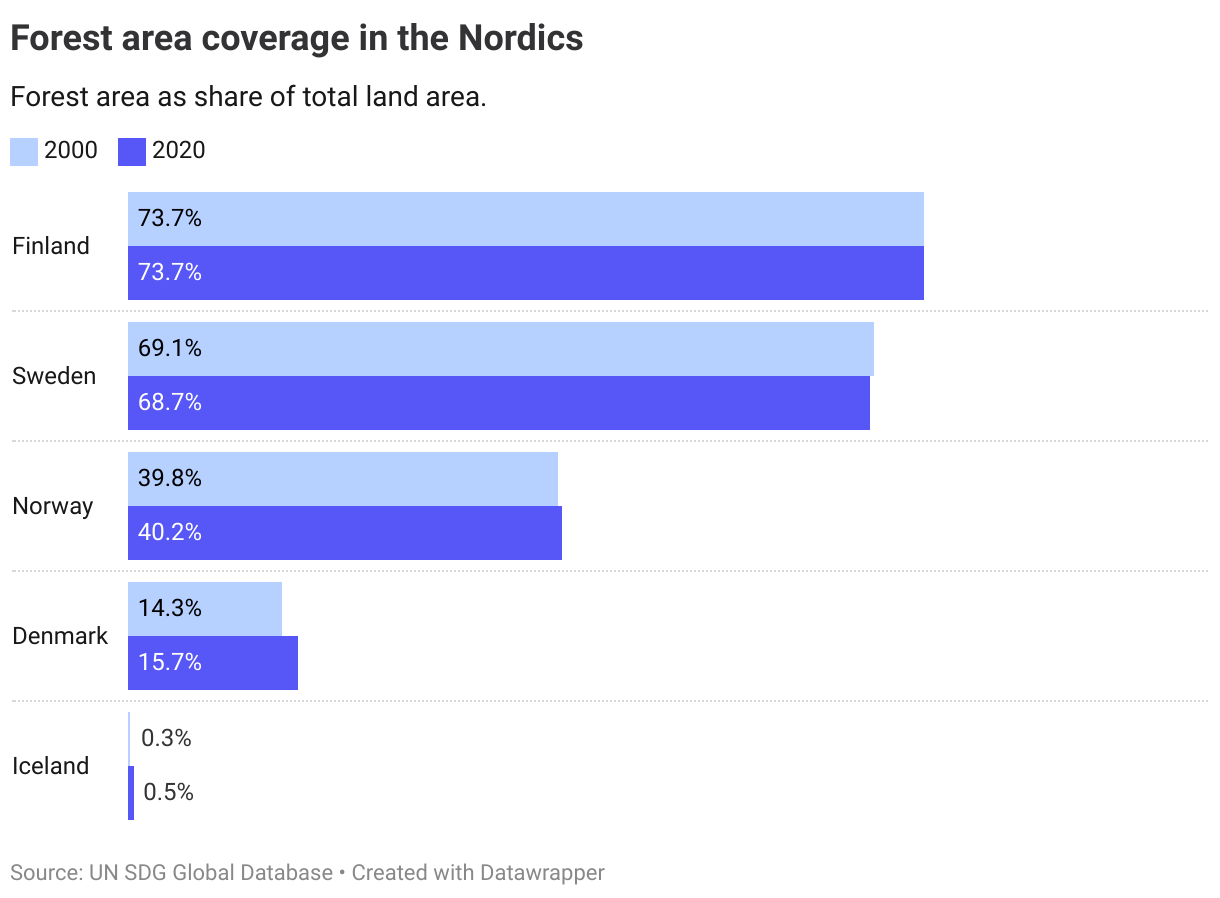
15.1.1. Forest area
Over the past two decades, the world’s forest area has declined from 31.9% of total land area in 2000 to 31.2% 2020. The main driver behind global deforestation is the conversion of forest into agricultural use, including the expansion of croplands and areas for livestock grazing. This is particularly the case in Latin America and Sub-Saharan Africa, where forest coverage has declined by 8% and 10% respectively.
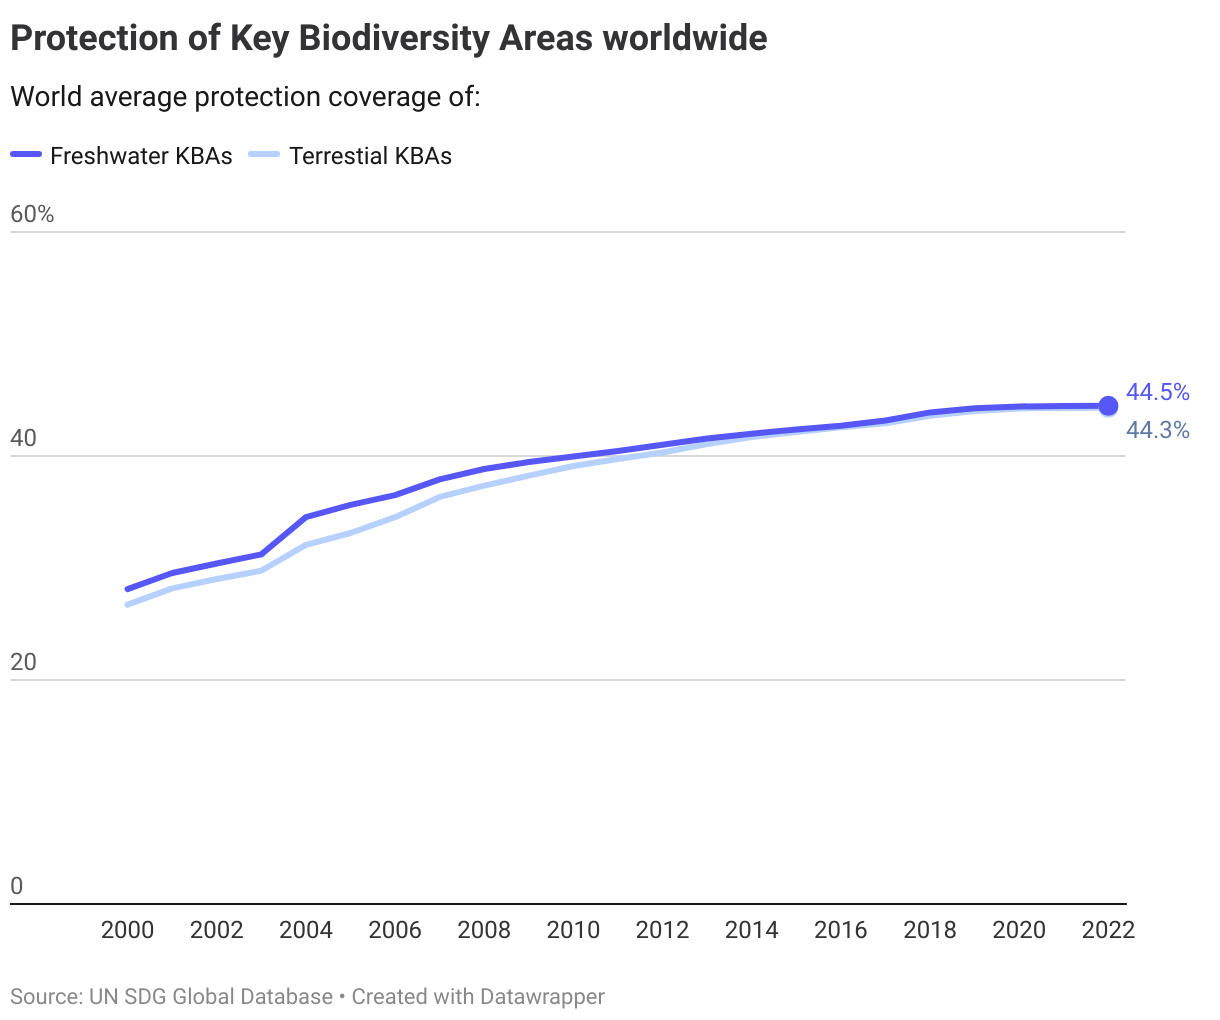
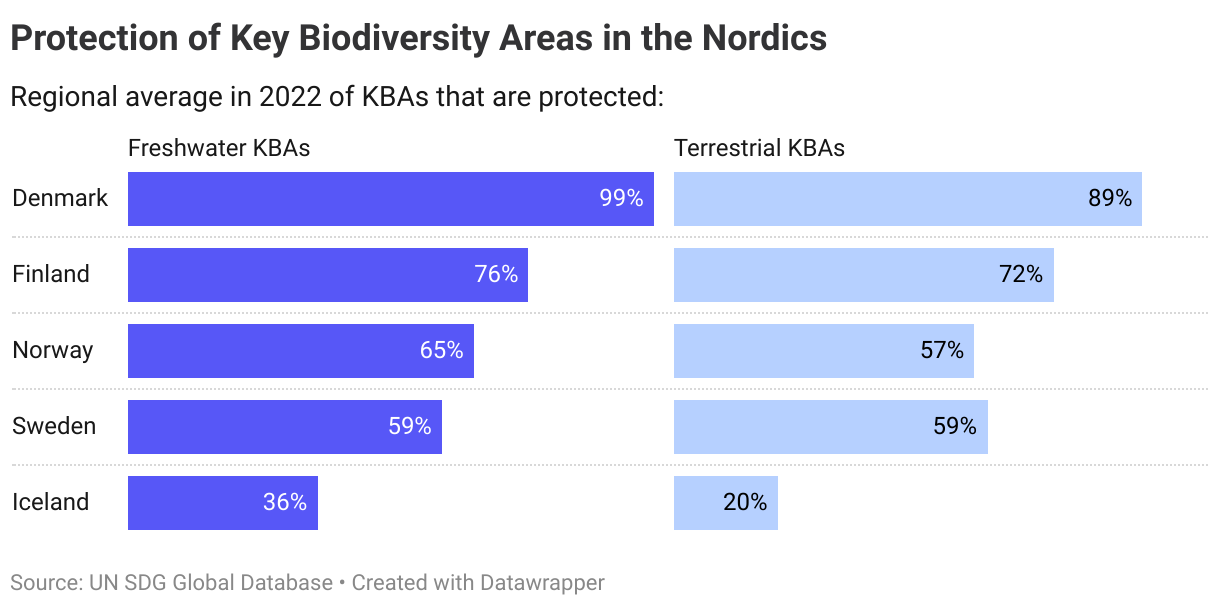
15.1.2. Protected areas for terrestrial and freshwater biodiversity
Substantial progress has been made in expanding the coverage of terrestrial and freshwater Key Biodiversity Areas (KBAs), which are areas classified as contributing significantly to the global persistence of biodiversity. As of 2022, the world average coverage rate stood at just above 44% for both freshwater and terrestrial KBAs.
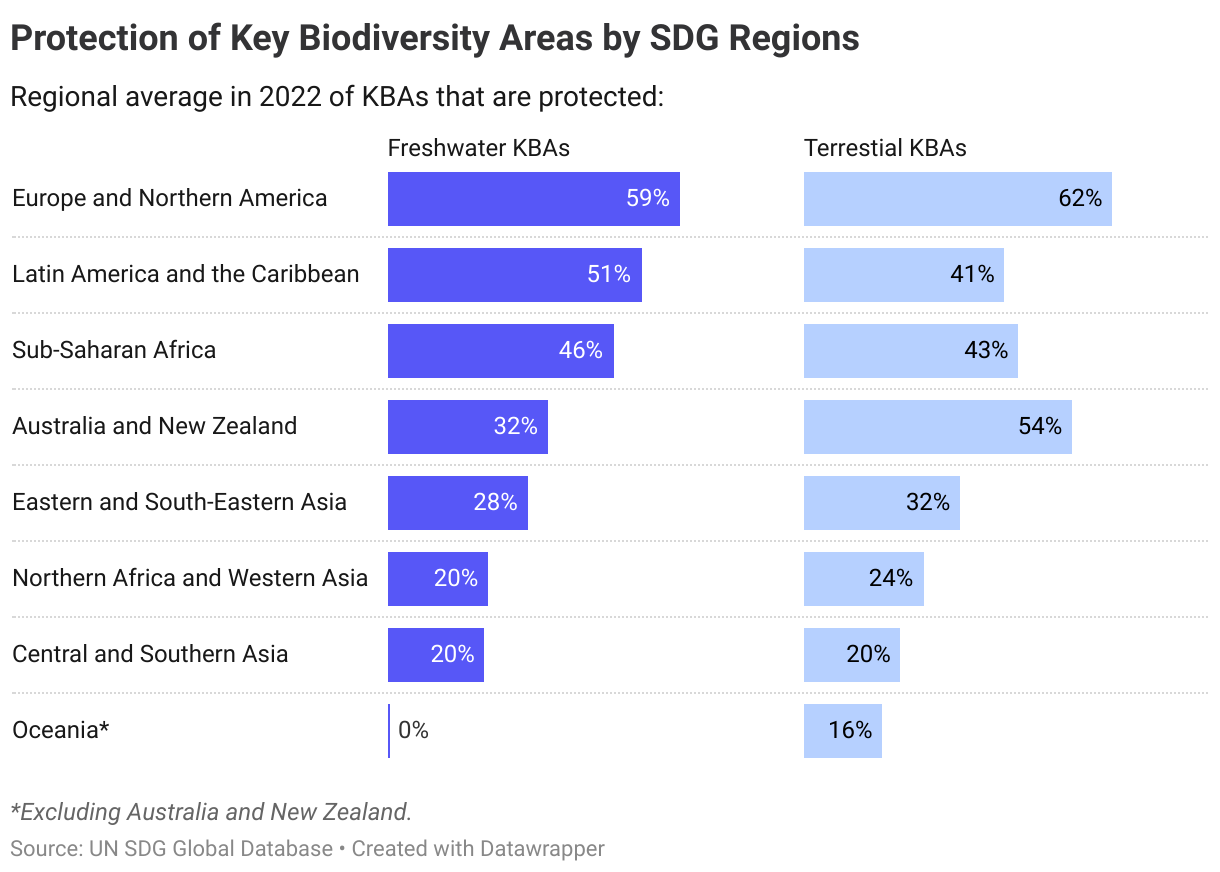
All regions have made progress in increasing their coverage rates over the past two decades, with Europe and Northern America having the highest degree of protection in 2021.
The Nordics
Since 2000 there have been few changes in forest area coverage in the Nordics. The most notable change is Denmark which has seen an increase of around 10% in areas covered, from 14.3% in 2000 to 15.7% in 2020.
Protection of both terrestrial and freshwater Key Biodiversity Areas has increased in all the Nordics over the past two decade. Still protections level vary significantly. Denmark is almost at complete protection level for freshwater KBAs, while Iceland has has around a third of areas protected.
For terrestrial KBAs protection levels are generally lower. With the target operationalised by the OECD at 95% protection levels, based on the best OECD performers in 2015, none of the Nordics currently have achieved or are on track to reach this target level. Denmark is at a short distance, while the other countries are at a long distance, though they are making progress.
Denmark
Short distance to target
Finland
Long distance to target but progressing
Iceland
Long distance to target but progressing
Norway
Long distance to target but progressing
Sweden
Long distance to target but progressing
Target 15.2
By 2020, promote the implementation of sustainable management of all types of forests, halt deforestation, restore degraded forests and substantially increase afforestation and reforestation globally
| 15.2.1 | Progress towards sustainable forest management |
Global trends
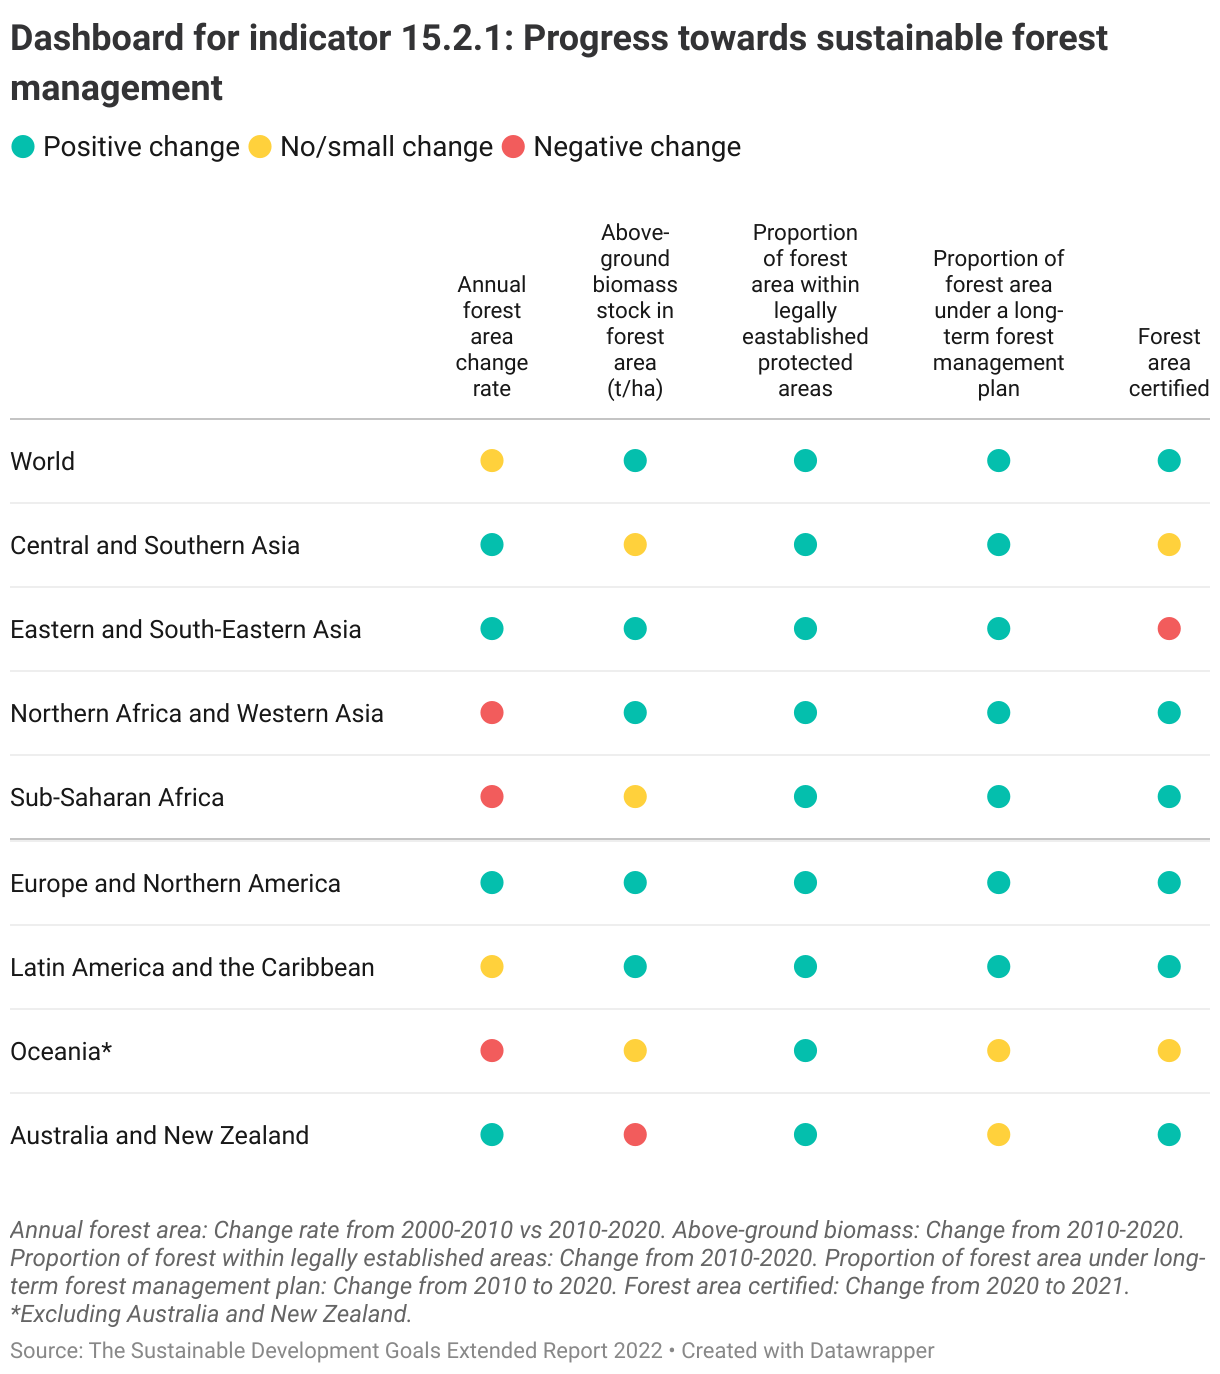
This indicator is composed of five sub-indicators measuring various dimensions of sustainable forest management:
- Annual forest area change rate
- Above-ground biomass in forest
- Proportion of forest area within legally established protected areas
- Proportion of forest area under a long-term management plan
- Forest area under an independently verified forest management certification scheme
Despite the overall decline in forest area as highlighted in target 15.1, an overall assessment of the five sub-indicators shows that there has been considerable progress worldwide towards sustainable forest management.
In particular, the share of world forests within legally protected areas as well as forest areas under long-term management plans has increased in almost all regions. In 2020, 58% of world forest areas were under a long-term management plan, up from 52% in 2000 and 56% in 2015.
The Nordics
For OECD-countries, the OECD has operationalised the target as follows: the proportion of forest area within legally established protected areas and under a long-term management plan, are operationalised at 36% and 100% respectively, based on the best performing countries in the OECD in 2015. Annual net change rate of forest area is operationalised at 0%, while the OECD adds an additional indicator on the intensity of use of forest resources (a ratio where lower than 1 means no overharvesting).
Nordic country data shows that all countries met the target related to annual net change of forest area and intensity of use (with the exception of Finland for the latter). For the share of forest under legally established protected areas and under long-term management plan, the picture is more mixed. Still, as the majority of indicators are within required target levels for Denmark, Iceland, Norway and Sweden, their overall assessment is that this target is met.
Denmark
Target is met
Finland
Short distance to target
Iceland
Target is met
Norway
Target is met
Sweden
Target is met
Target 15.3
By 2030, combat desertification, restore degraded land and soil, including land affected by desertification, drought and floods, and strive to achieve a land degradation-neutral world
| 15.3.1 | Proportion of land that is degraded over total land area |
Data is insufficient for assessment of progress at the global, regional or Nordic country level.
Target 15.4
By 2030, ensure the conservation of mountain ecosystems, including their biodiversity, in order to enhance their capacity to provide benefits that are essential for sustainable development
| 15.4.1 | Coverage by protected areas of important sites for mountain biodiversity |
| 15.4.2 | Mountain Green Cover Index |
Global trends
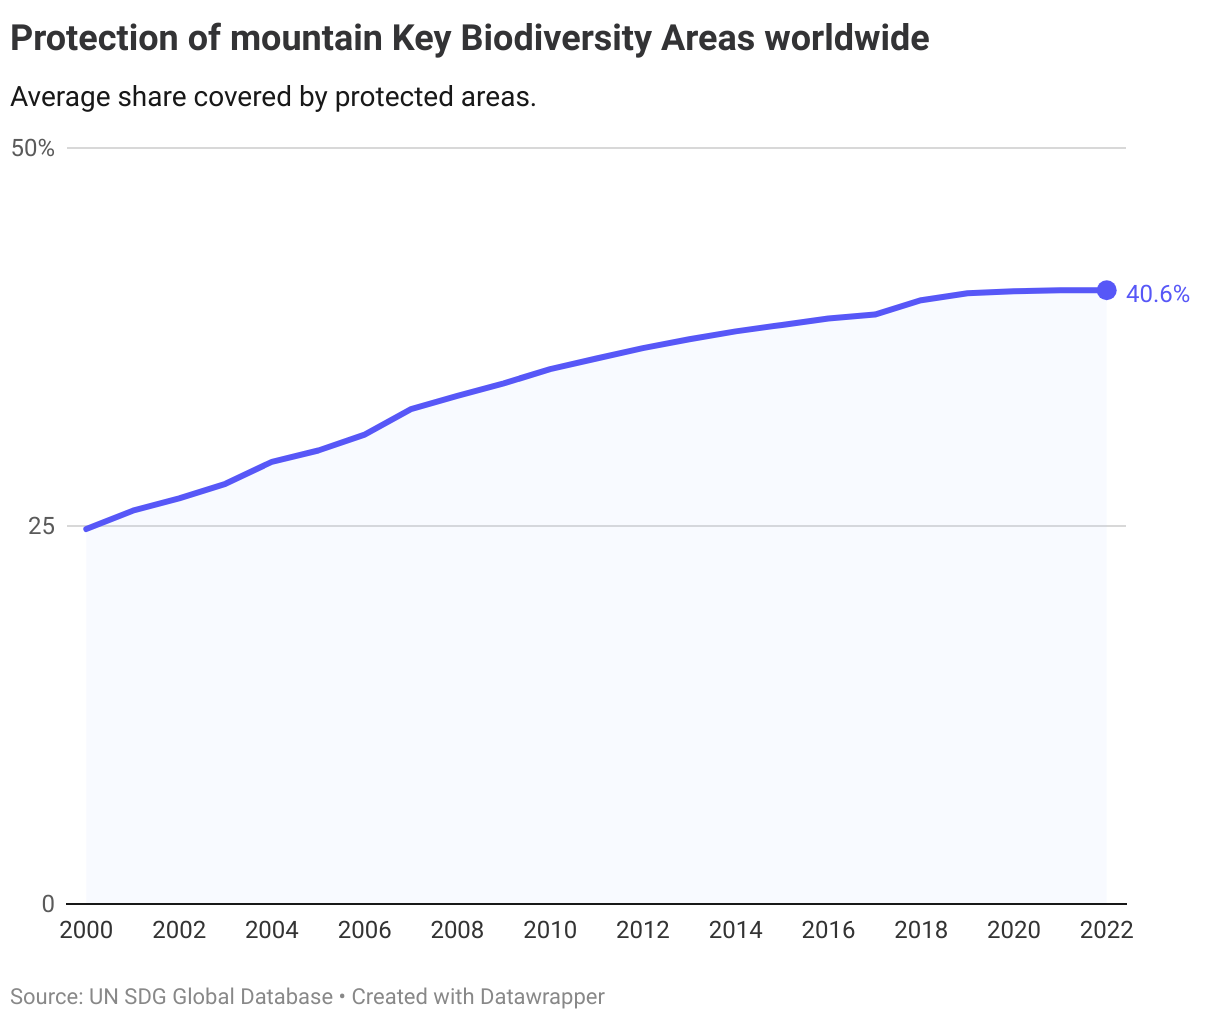
15.4.1. Protected areas for mountain biodiversity
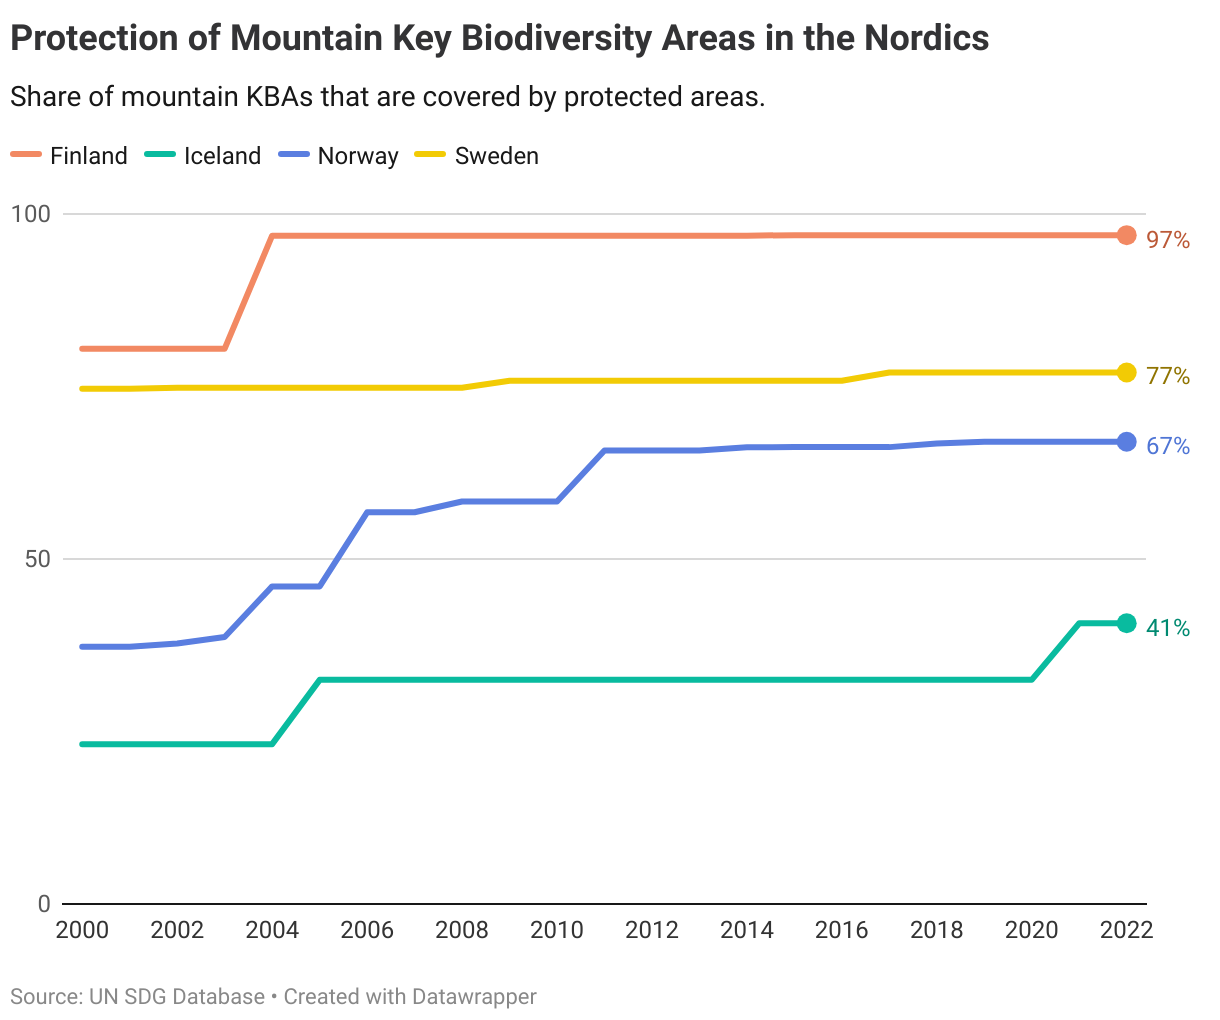
Worldwide protection levels of mountain Key Biodiversity Areas (KBAs) have increased steadily over the past two decades, although the pace of increase has slowed in the past few years. As of 2022, some 60% of mountain KBAs were still unprotected.
15.4.2. Mountain green index
The most recent data from 2020 on the Mountain Green Cover Index, a measure of changes in green vegetation in mountain areas, show that coverage worldwide was approximately unchanged globally since 2015.
The Nordics
Out of the Nordics, Finland has the highest level of mountain KBA protection at 97%, above the OECD operationalised target at 91% (based on best OECD performers in 2015). Iceland, Norway and Sweden still need to make more progress to reach this target by 2030, according to the OECD assessment. (Target is not applicable to Denmark).
Insufficient data for the Nordics to make an assessment of the Mountain Green Cover Index.
Denmark
Not applicable
Finland
Target is met
Iceland
Long distance to target but progressing
Norway
Long distance to target but progressing
Sweden
Long distance to target but progressing
Target 15.5
Take urgent and significant action to reduce the degradation of natural habitats, halt the loss of biodiversity and, by 2020, protect and prevent the extinction of threatened species
| 15.5.1 | Red List Index |
Global trends
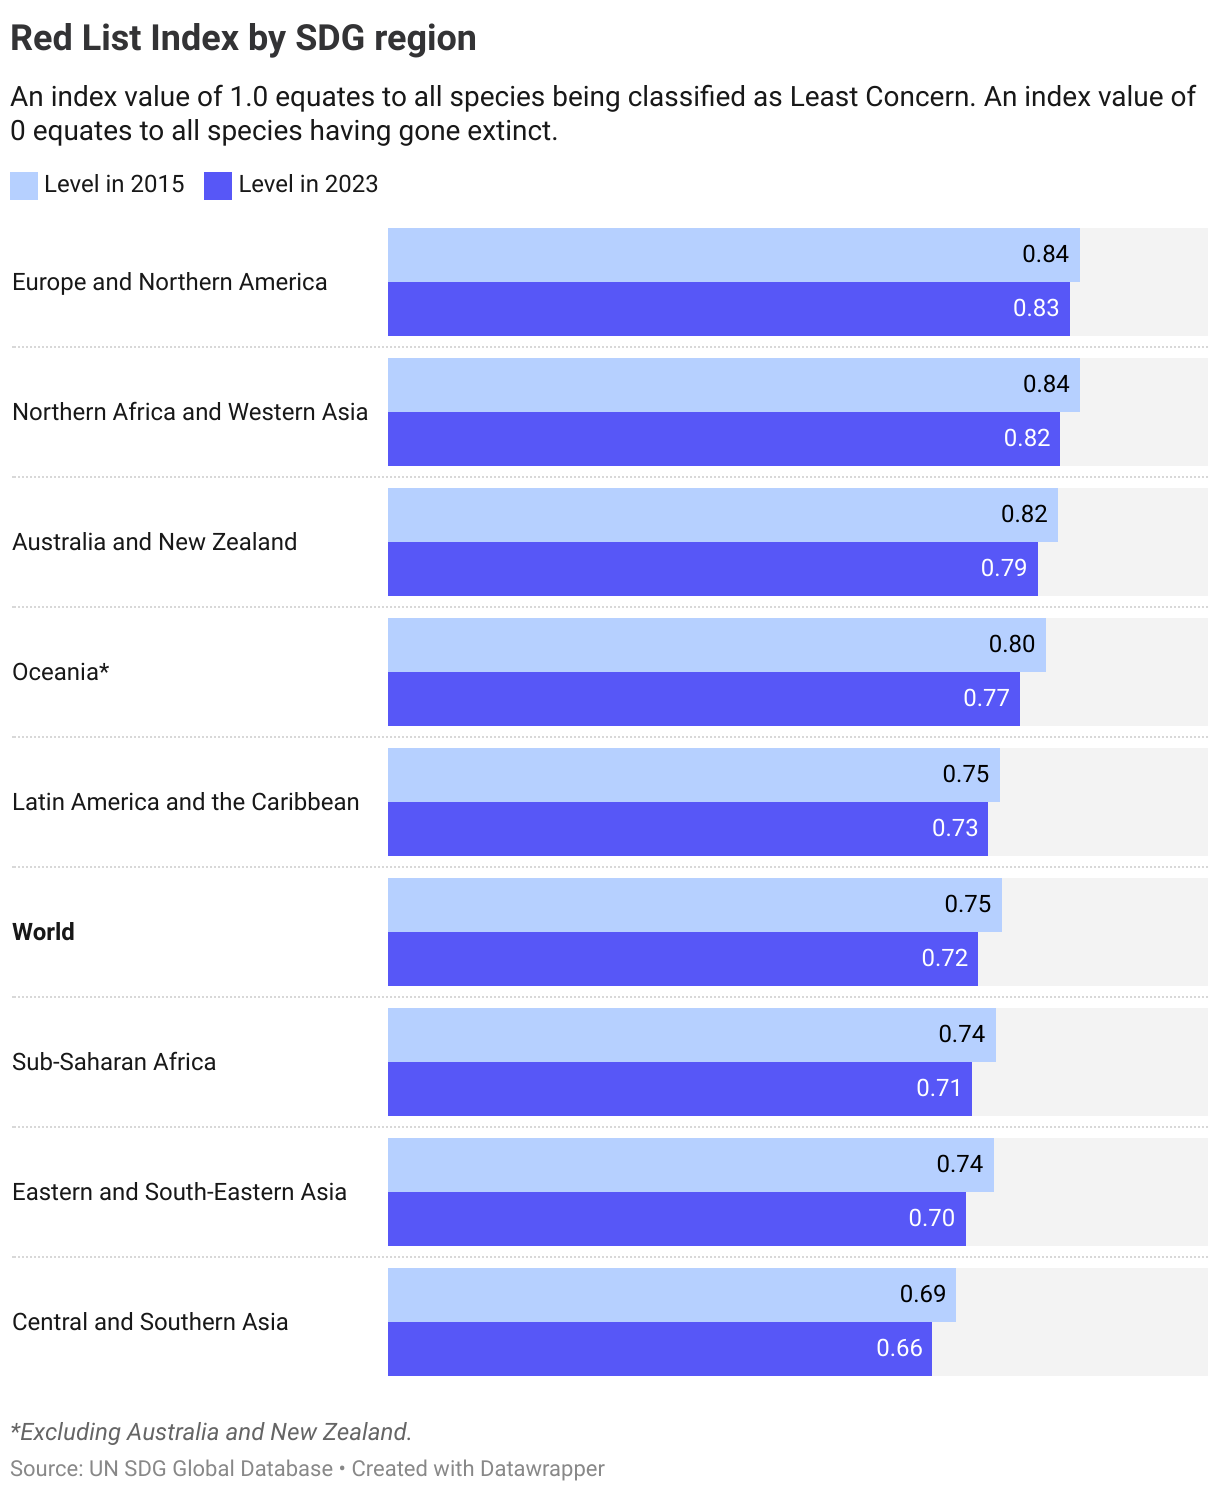
The Red List Index measures trends in overall extinction risk for species. The latest data show a worldwide deterioration in species extinction risk with the Red List Index declining to 0.72, compared to 0.75 in 2015 and 0.80 in 2000.
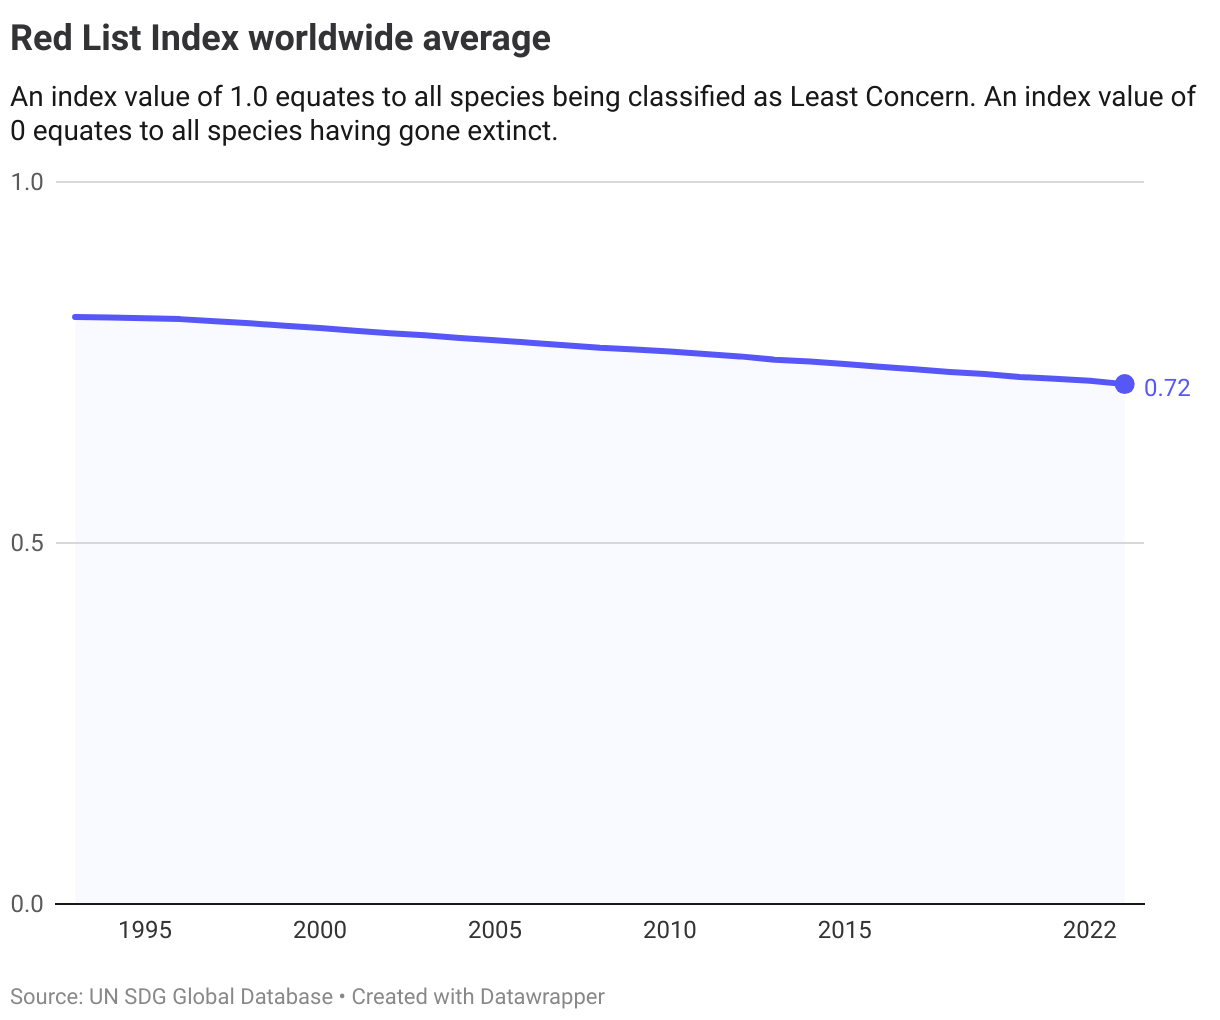
While the index varies between regions, deterioration was observed in all regions since 2000.
The Nordics
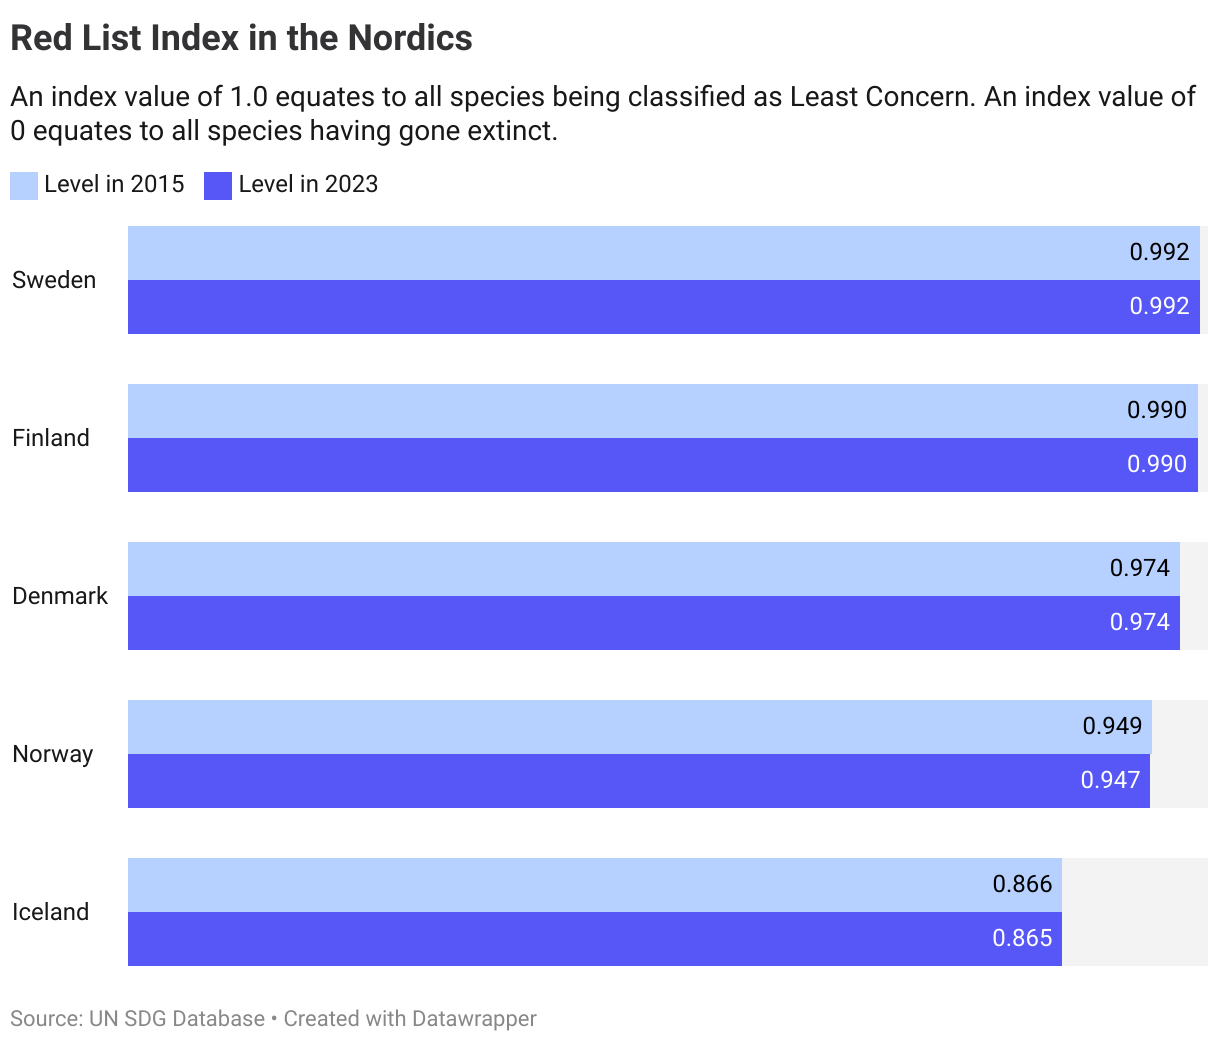
While high index levels were observed in all the Nordic countries, indicating a low risk of extinction, none of the Nordics have achieved the set target level of 1.0. Denmark, Finland and Sweden are considered to be at a small distance to target (score of 0.95 or above).
Denmark
Short distance to target
Finland
Short distance to target
Iceland
Long distance to target, not progressing
Norway
Long distance to target, not progressing
Sweden
Short distance to target
Target 15.6
Promote fair and equitable sharing of the benefits arising from the utilization of genetic resources and promote appropriate access to such resources, as internationally agreed
| 15.6.1 | Number of countries that have adopted legislative, administrative and policy frameworks to ensure fair and equitable sharing of benefits |
Global trends
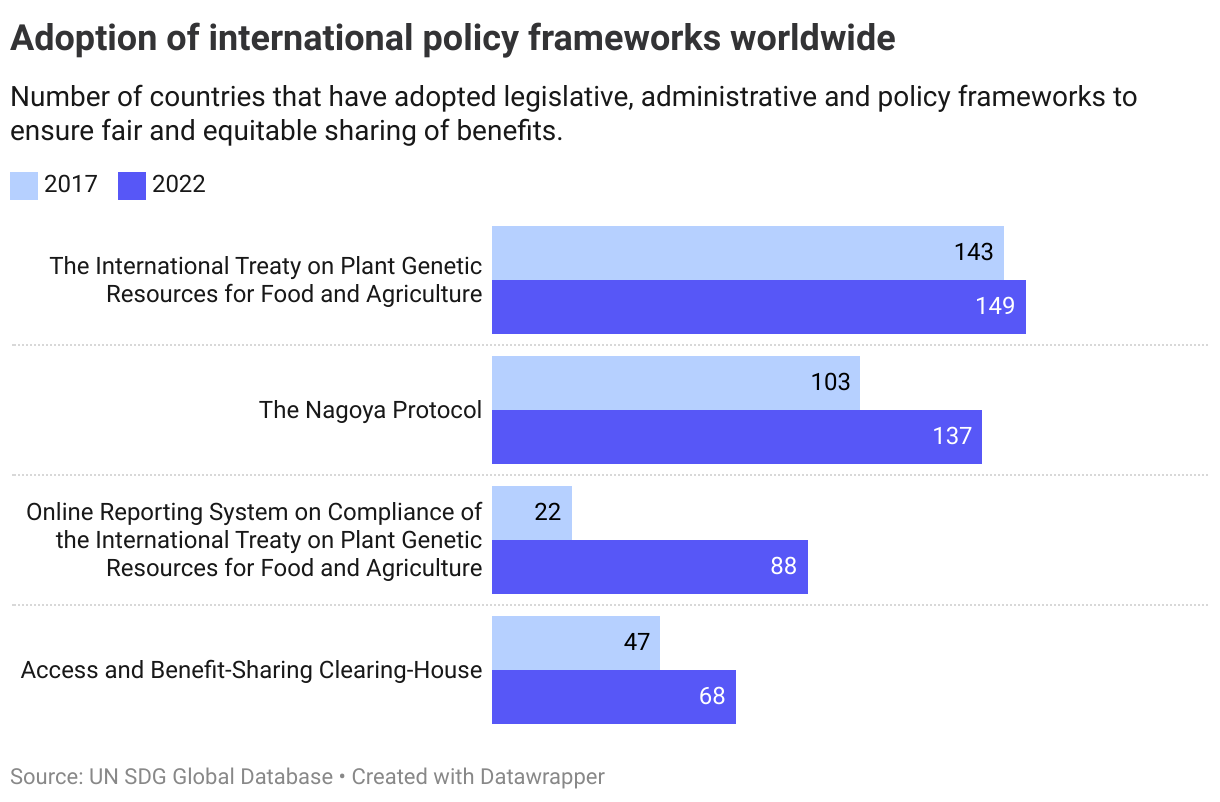
This indicator consists of 4 sub-indicators:
- Countries that are Contracting Parties to the International Treaty on Plant Genetic Resources for Food and Agriculture
- Countries that are Parties to the Nagoya Protocol to the Convention on Biological Diversity
- Countries that have legislative, administrative and policy measures reported through the Online Reporting System on Compliance of the International Treaty on Plant Genetic Resources for Food and Agriculture
- Countries that have legislative, administrative or policy measures reported to the Access and Benefit-Sharing Clearing-House of the Secretariat of the Convention on Biological Diversity
A fifth sub-indicator is also included, concerning the number, by country, of Standard Material Transfer Agreements (SMTAs) transferring plant genetic resources for food and agriculture. (This is a cumulative figure per country and not assessed further).
Worldwide adoption of the four policy frameworks has improved over the past years, with all four sub-indicators seeing an increase in country adoption over the past five years.
The Nordics
Denmark, Finland, Norway and Sweden all have adopted the legislative, administrative and policy frameworks included in the indicator. Iceland is listed as only having adopted the International Treaty on Plant Genetic Resources for Food and Agriculture.
Denmark
Target is met
Finland
Target is met
Iceland
Long distance to target and not progressing
Norway
Target is met
Sweden
Target is met
Target 15.7
Take urgent action to end poaching and trafficking of protected species of flora and fauna and address both demand and supply of illegal wildlife products
| 15.7.1 | Proportion of traded wildlife that was poached or illicitly trafficked |
No data is available for assessment of progress at the global, regional or Nordic country level.
Target 15.8
By 2020, introduce measures to prevent the introduction and significantly reduce the impact of invasive alien species on land and water ecosystems and control or eradicate the priority species
| 15.8.1 | Proportion of countries adopting relevant national legislation and adequately resourcing the prevention or control of invasive alien species |
Global trends
This target is measured through three policy sub-indicators:
- the existence of Legislation, Regulation, Act related to the prevention of introduction and management of invasive alien species (IAS)
- the existence of National Biodiversity Strategy and Action Plan targets alignment to Aichi Biodiversity Target (ABT) number 9
- countries with an allocation from the national budget to manage the threat of invasive alien species
Almost all countries (98%) have national legislation in place to prevent the introduction and management of invasive alien species, while the share of countries aligning their national targets with global targets is also high (86%) and increasing. As regards budget allocations, 55% of countries reported that they made allocations in 2020 from national budgets.
The Nordics
Denmark, Finland, Norway and Sweden all have policies and plans in existence in line with the two first sub-indicators, as well as making national budget allocations. Available data for Iceland shows they only satisfy sub-indicator on the existence of policies to prevent the introduction and management of IAS.
Denmark
Target is met
Finland
Target is met
Iceland
Long distance to target and not progressing
Norway
Target is met
Sweden
Target is met
Target 15.9
By 2020, integrate ecosystem and biodiversity values into national and local planning, development processes, poverty reduction strategies and accounts
| 15.9.1 | (a) Number of countries that have established national targets in accordance with or similar to Aichi Biodiversity Target 2 of the Strategic Plan for Biodiversity 2011–2020 in their national biodiversity strategy and action plans and the progress reported towards these targets; and (b) integration of biodiversity into national accounting and reporting systems, defined as implementation of the System of Environmental-Economic Accounting |
Global trends
As of 2022, the majority of countries have established national targets in line with the Aichi Biodiversity Target 2. However, progress towards the targets varies considerably. Only 52 countries are on track to achieve or exceed their national targets, while the remaining are either not improving at a sufficient rate, moving away from the targets or have no target at all.
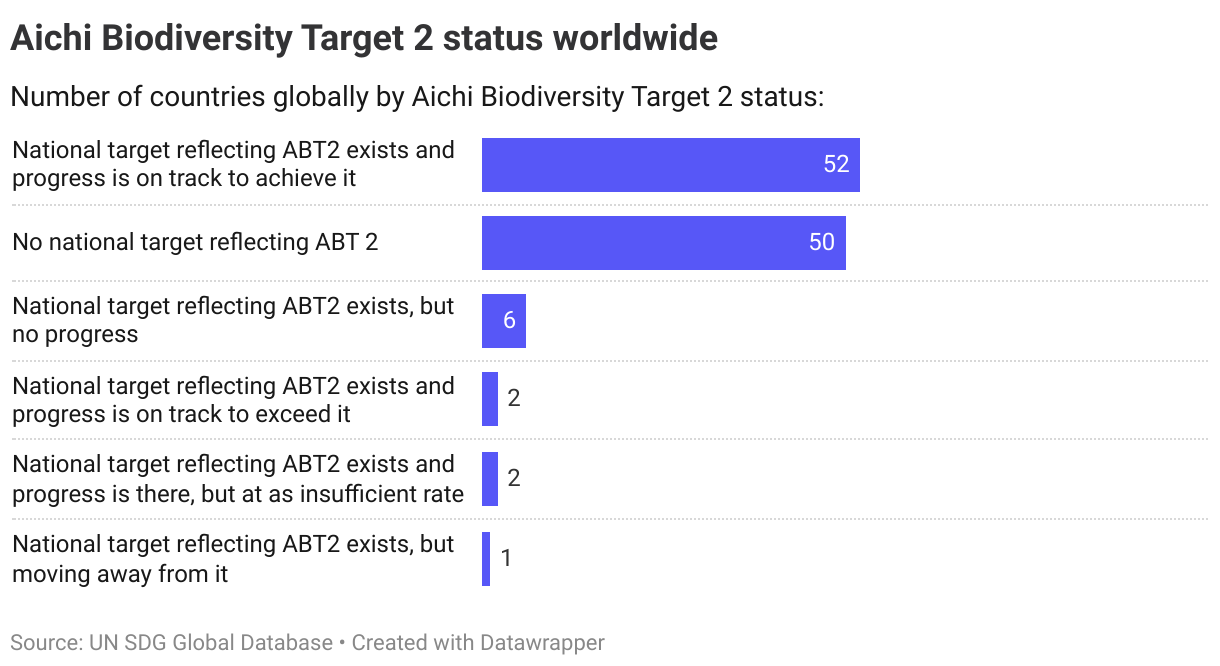
Globally, there has been a steady increase in the number of countries integrating biodiversity values into their national accounting and reporting systems.
The Nordics
All the Nordic countries have integrated biodiversity into national accounting and reporting systems. Only Finland has a national target reflecting ABT2 and is on track to achieve it. Sweden has a national target reflecting ABT2, but progress is at an insufficient rate. The other countries have no national target reflecting ABT2.
Denmark
Long distance to target and not progressing
Finland
Target is met
Iceland
Long distance to target and not progressing
Norway
Long distance to target and not progressing
Sweden
Short distance to target
Target 15.a
Mobilize and significantly increase financial resources from all sources to conserve and sustainably use biodiversity and ecosystems
| 15.a.1 | (a) Official development assistance on conservation and sustainable use of biodiversity; and (b) revenue generated and finance mobilized from biodiversity-relevant economic instruments |
Global trends
While the target sets out a commitment to increase support to developing countries for biodiversity, there is no set numerical target.
The latest data shows that total aid commitments for biodiversity have declined over recent years in absolute terms and stood at 9.8 billion USD in 2022, equalling the levels seen in 2015 and 2017.
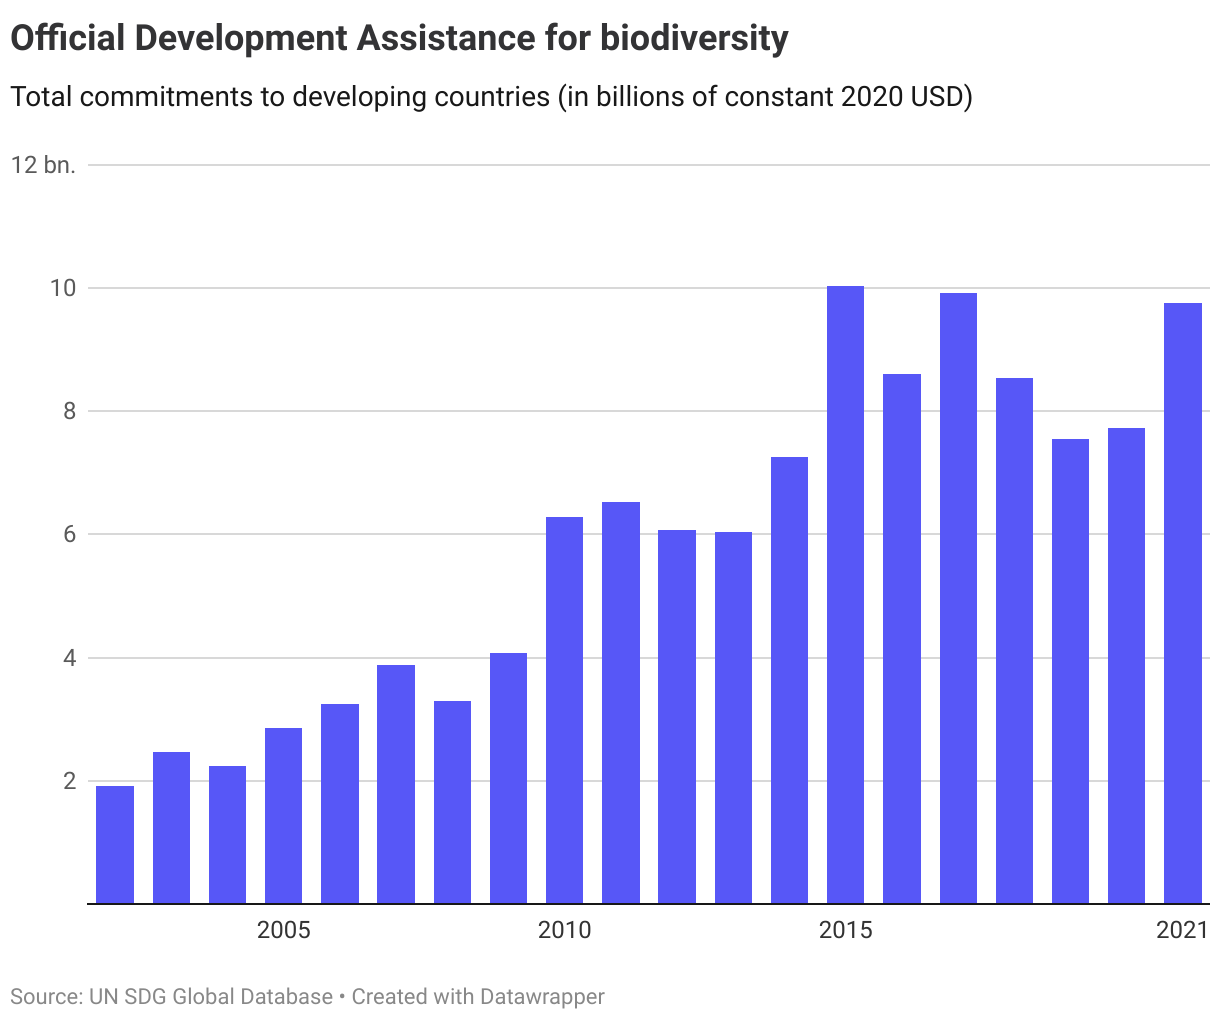
No data is available on the revenue generated and finance mobilized from biodiversity-relevant economic instruments.
The Nordics
No assessment of progress is performed for the Nordic countries, as the sectoral distribution of international flows will depend on national contexts and priorities.
Target 15.b
Mobilize significant resources from all sources and at all levels to finance sustainable forest management and provide adequate incentives to developing countries to advance such management, including for conservation and reforestation
| 15.b.1 | (a) Official development assistance on conservation and sustainable use of biodiversity; and (b) revenue generated and finance mobilized from biodiversity-relevant economic instruments |
This target is measured through the same indicator as target 15.a.
Target 15.c
Enhance global support for efforts to combat poaching and trafficking of protected species, including by increasing the capacity of local communities to pursue sustainable livelihood opportunities
| 15.c.1 | Proportion of traded wildlife that was poached or illicitly trafficked |
Insufficient data are available for assessment of progress at the global, regional or Nordic country level.