

Introduction
This data tracker looks at Nordic countries’ progress towards achieving Sustainable Development Goal 10: Reduce inequality within and among countries. The goal is comprised of 10 targets.
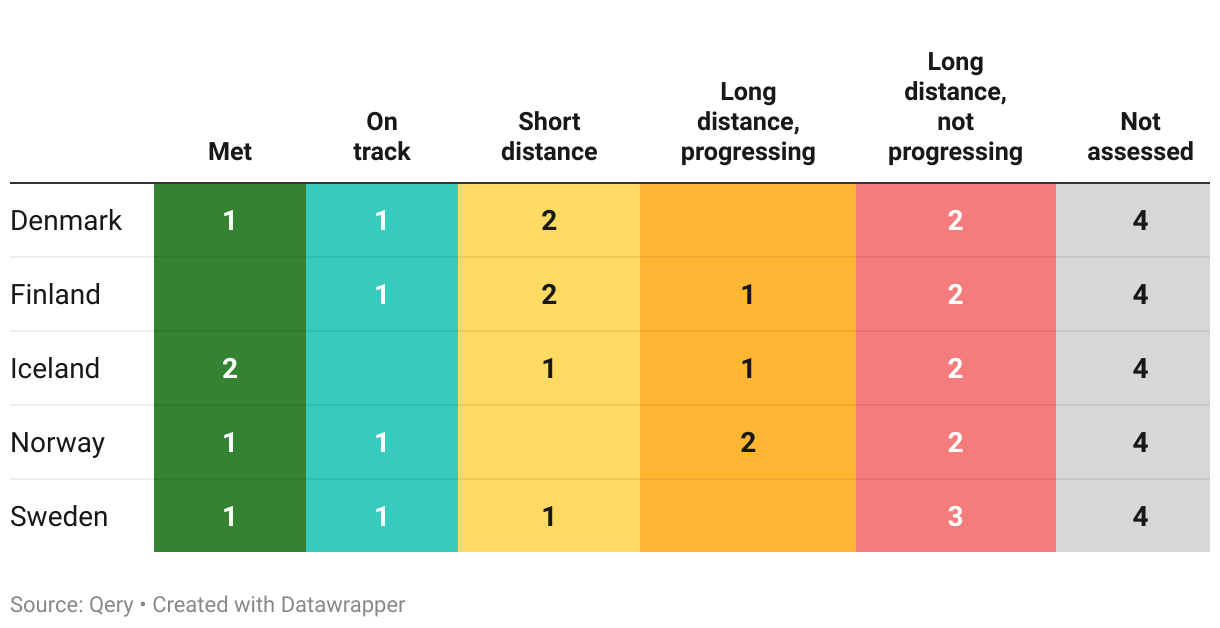
The Nordic countries – Denmark, Finland, Iceland, Norway and Sweden – are classified into one of five categories for each target:
Met: The country has already met the 2030 target.
On track: The country has not yet met the target but is on track to do so by 2030.
Short distance: The country has not met the target and is not projected to do so but is close to achieving it. This category also applies when the country currently meets the target but is projected to move away from it.
Long distance but progressing: The country is far from the target but is making progress towards it.
Long distance and not progressing: The country is far from the target and is not making progress towards reaching it.
Details on the methodology used, together with the overall assessment for all 17 goals, can be found on our overview page. Note that the analysis is currently work in progress.
Overall assessment of progress
As of mid-2023, this is our assessment of the Nordic countries progress on the 10 targets part of SDG 10:
The Nordic countries’ performance on the different targets part of this goal can be explored further below. Each section follows the same structure:
- First, the official target text and related indicators is described and the latest global and regional trends are highlighted briefly.
- Second, where data is available, we then zoom in on the Nordic countries to describe how they are progressing, and assess their likelihood of achieving the target by the 2030 deadline.
- Note that both sections above strictly uses data from the UN SDG Global Database and/or the OECD.
Target 10.1
By 2030, progressively achieve and sustain income growth of the bottom 40 per cent of the population at a rate higher than the national average
| 10.1.1 | Growth rates of household expenditure or income per capita among the bottom 40 per cent of the population and the total population |
Global trends
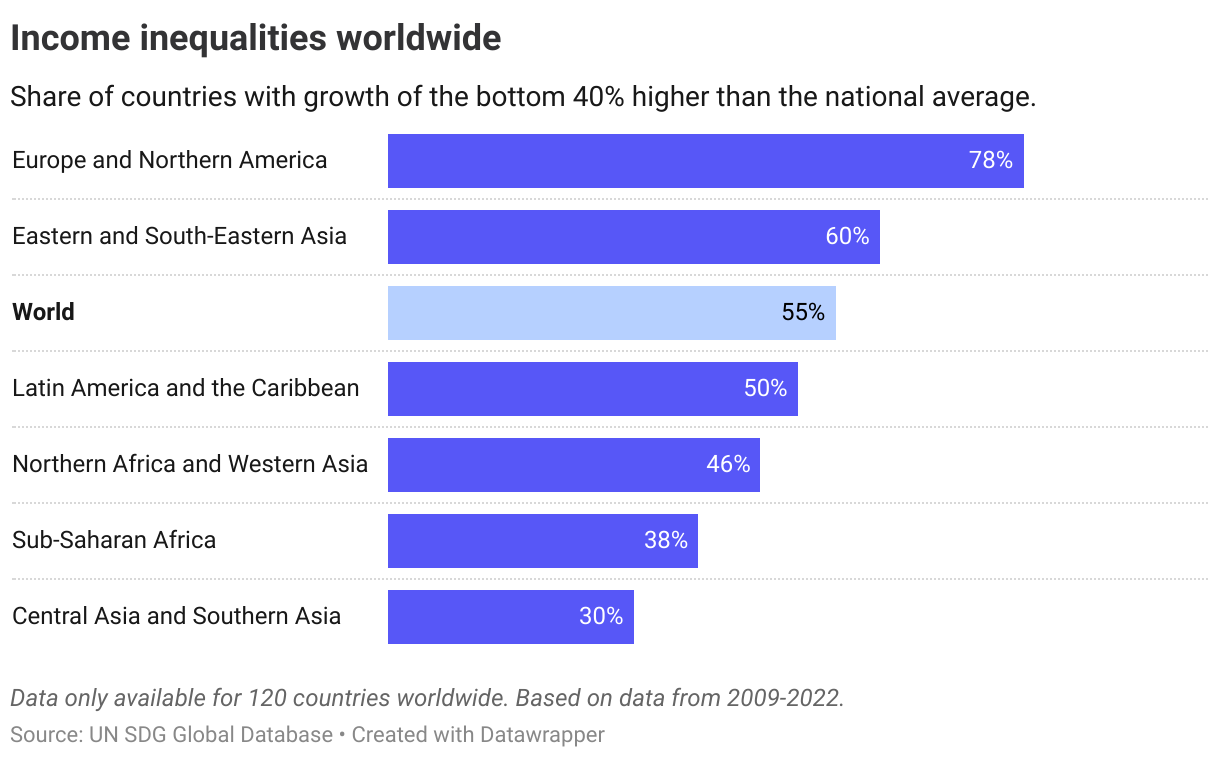
More than half of countries with data available had higher income growth among the bottom 40 percent than the national average, according to the latest UN estimates. In Europe and Northern America over three quarters of countries achieved this, while just one in three in Central Asia and Southern Asia.
The Nordics
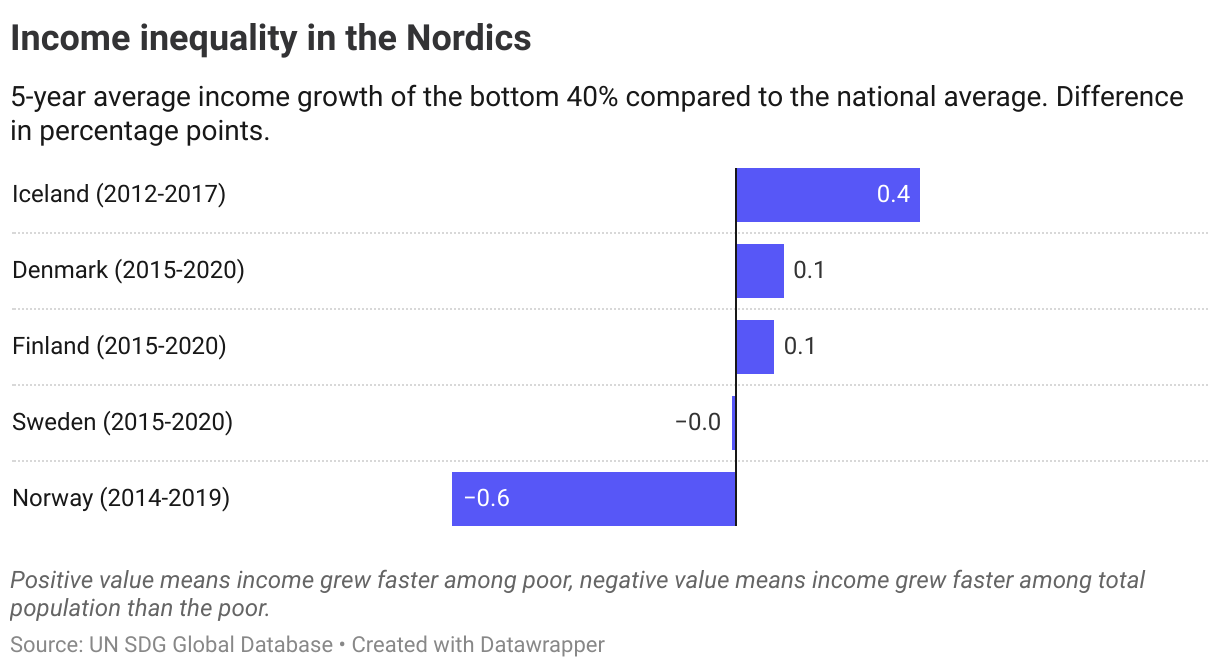
The OECD benchmarks progress on this indicator by comparing the latest country data against the top OECD performers in 2015. This entails a target of income growth in the poorest 40% of the population that rises 1 percentage points (pp.) faster than the national average over a five year period.
The latest data for the Nordics shows that no country is close to achieving this level, with Iceland coming closest recording a 0.4pp. faster growth rate among the poorest (2012-2017). In Norway, incomes grew faster among the total population than among the poorest 40%. Note that the lastest data per country differ.
Denmark
Long distance to target, not progressing
Finland
Long distance to target, not progressing
Iceland
Long distance to target, not progressing
Norway
Long distance to target, not progressing
Sweden
Long distance to target, not progressing
Target 10.2
By 2030, empower and promote the social, economic and political inclusion of all, irrespective of age, sex, disability, race, ethnicity, origin, religion or economic or other status
| 10.2.1 | Proportion of people living below 50% of median income |
Global trends
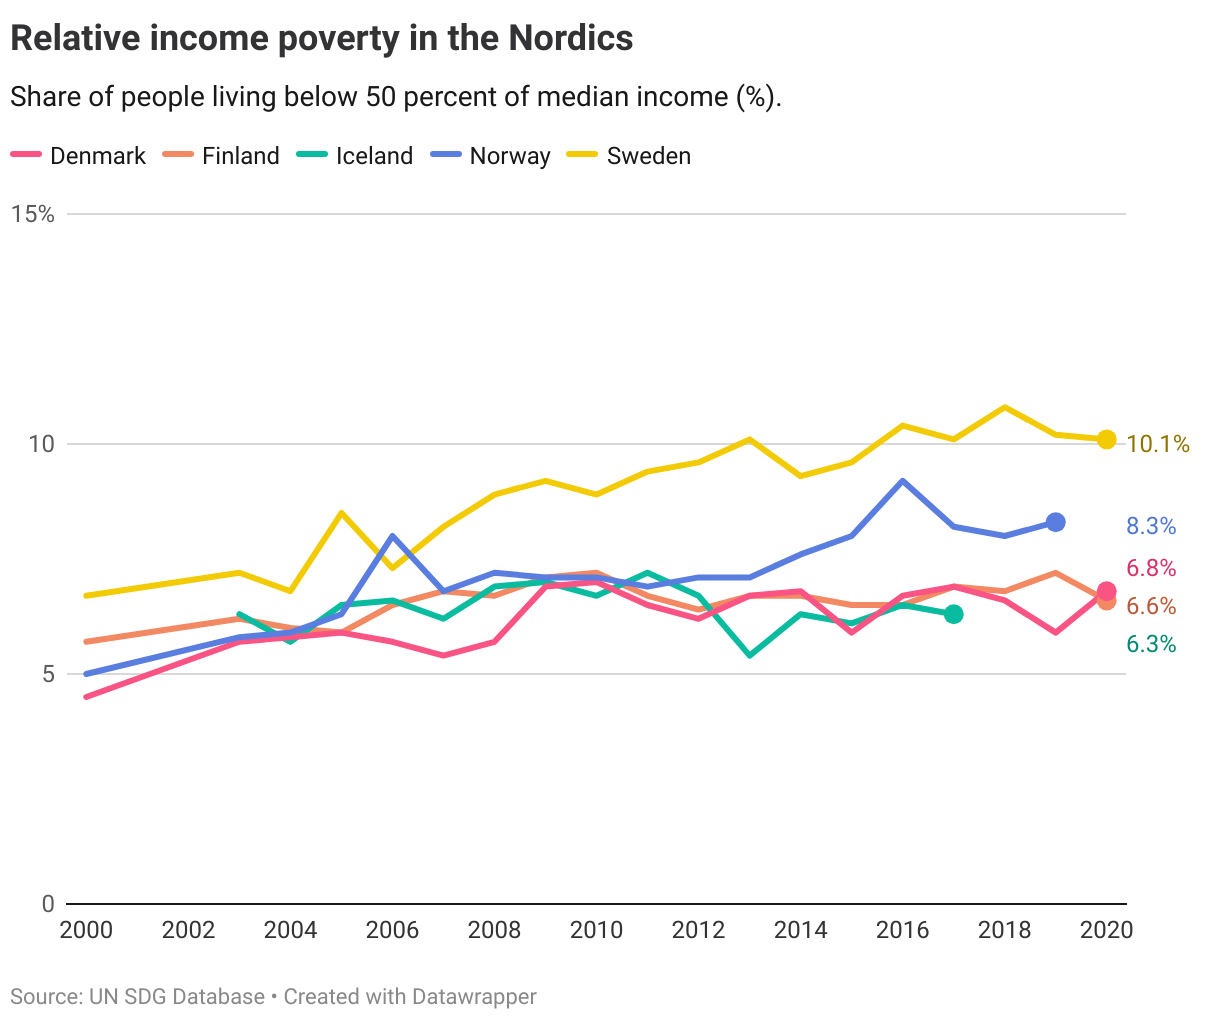
A key measure of inclusion is the relative income poverty rate, measured by the share of a country’s population living on less than half the median income. On average across some 160 countries worldwide, 13% of the population live below 50% of the median income.
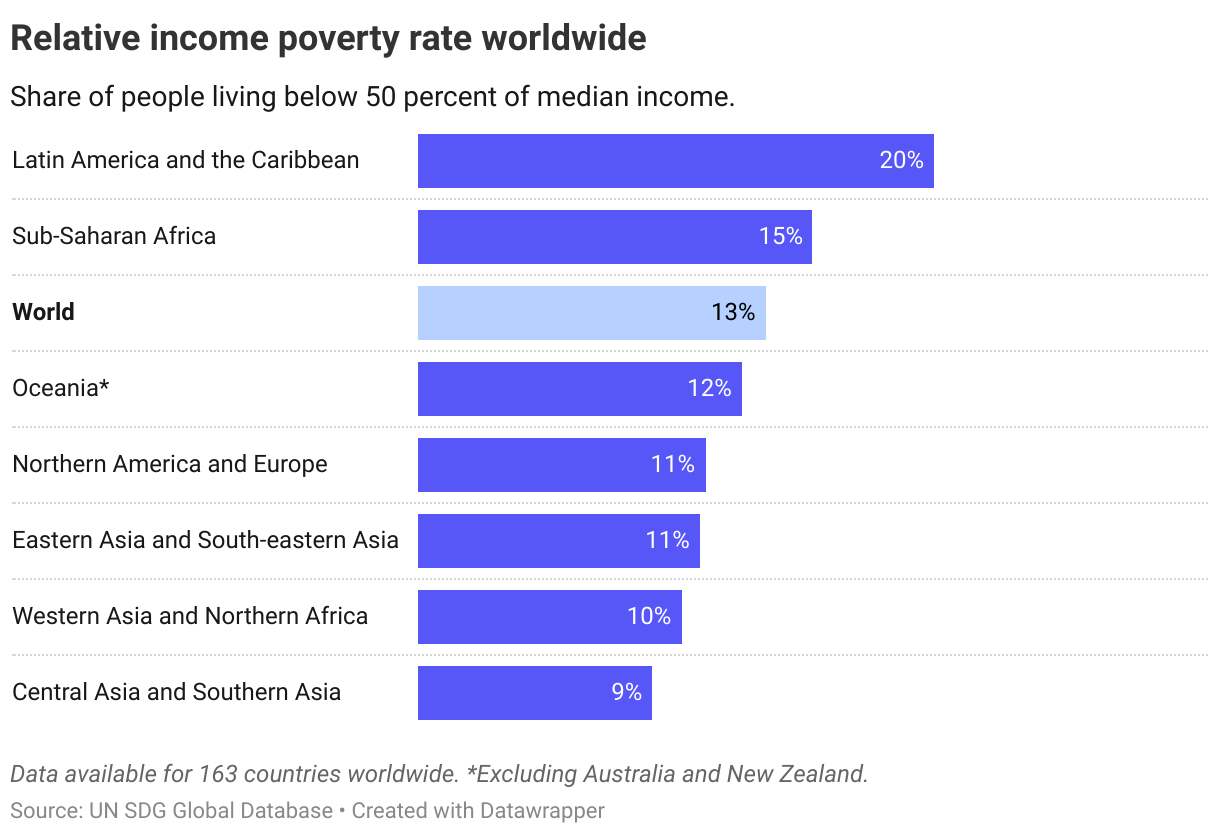
Over time, progress towards reducing this rate has been made in about two-thirds of countries. Although rates are highest in Latin America and the Caribbean, this is one of the regions which has made the most progress over the last years according to the UN. In Europe and Northern America, less than half of the countries have managed to reduce the relative income poverty rate.
The Nordics
The OECD has operationalised the 2030-target for relative income poverty at 5.5% for OECD countries. This is half the median OECD average share in 2015.
None of the Nordics have made significant progress towards this target in recent years, and the relative income poverty rate is higher than in 2000 in Denmark, Finland, Norway and Sweden.
Denmark
Short distance to target
Finland
Short distance to target
Iceland
Short distance to target
Norway
Long distance to target, not progressing
Sweden
Long distance to target, not progressing
Target 10.3
Ensure equal opportunity and reduce inequalities of outcome, including by eliminating discriminatory laws, policies and practices and promoting appropriate legislation, policies and action in this regard
| 10.3.1 | Proportion of population reporting having personally felt discriminated against or harassed within the previous 12 months on the basis of a ground of discrimination prohibited under international human rights law |
Insufficient data is available to assess global, regional or Nordic country trends.
Target 10.4
Adopt policies, especially fiscal, wage and social protection policies, and progressively achieve greater equality
| 10.4.1 | Labour share of GDP |
| 10.4.2 | Redistributive impact of fiscal policy |
Global trends
Compared to 2004, the earliest year for which data is available, the labour share of income (indicator 10.4.1) worldwide stood at 54%, compared to 53.8% in 2020. Thus over the past two decades, the labour share has remained more or less unchanged.
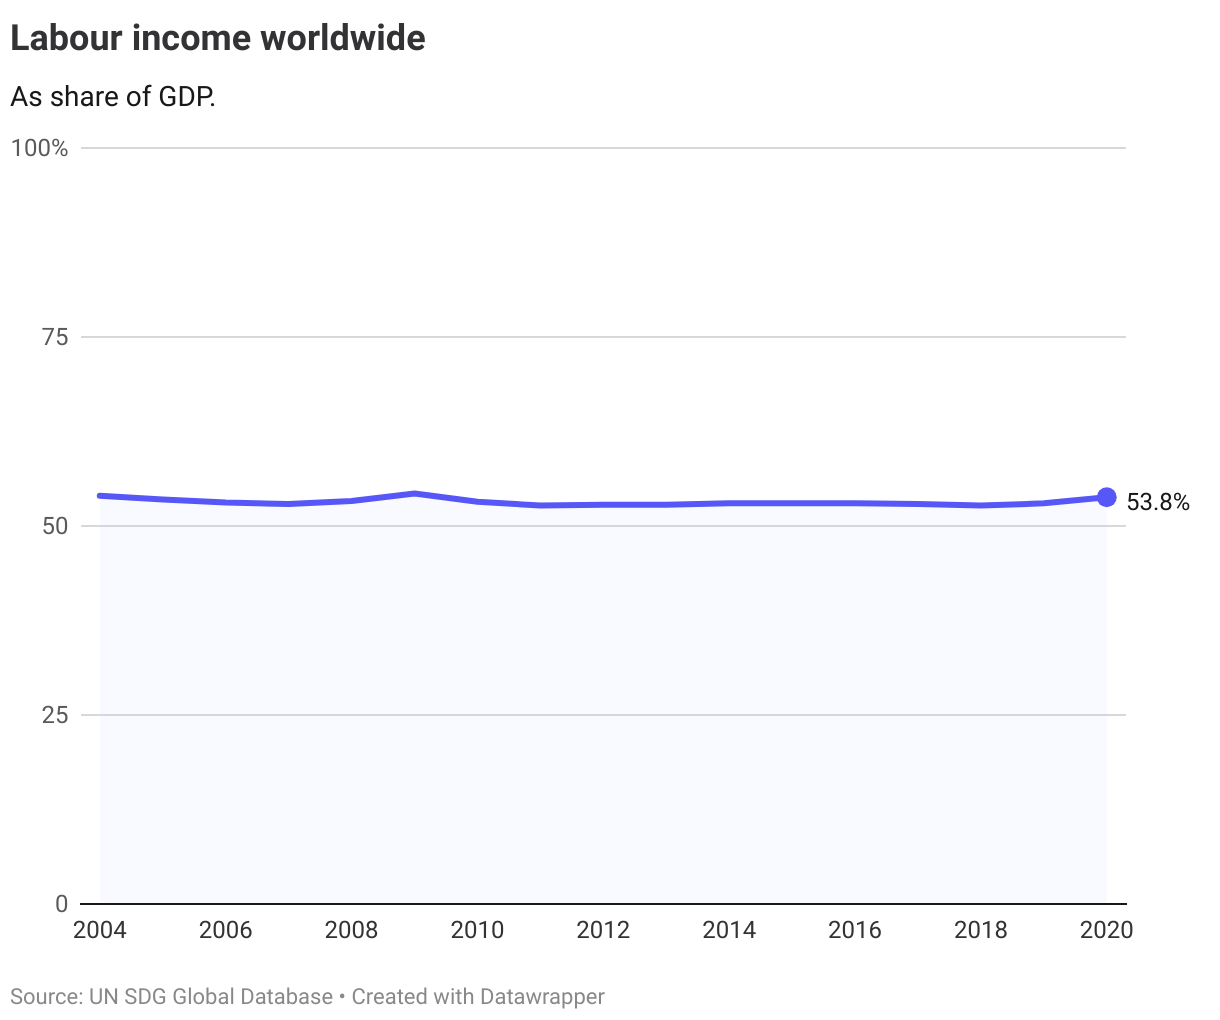
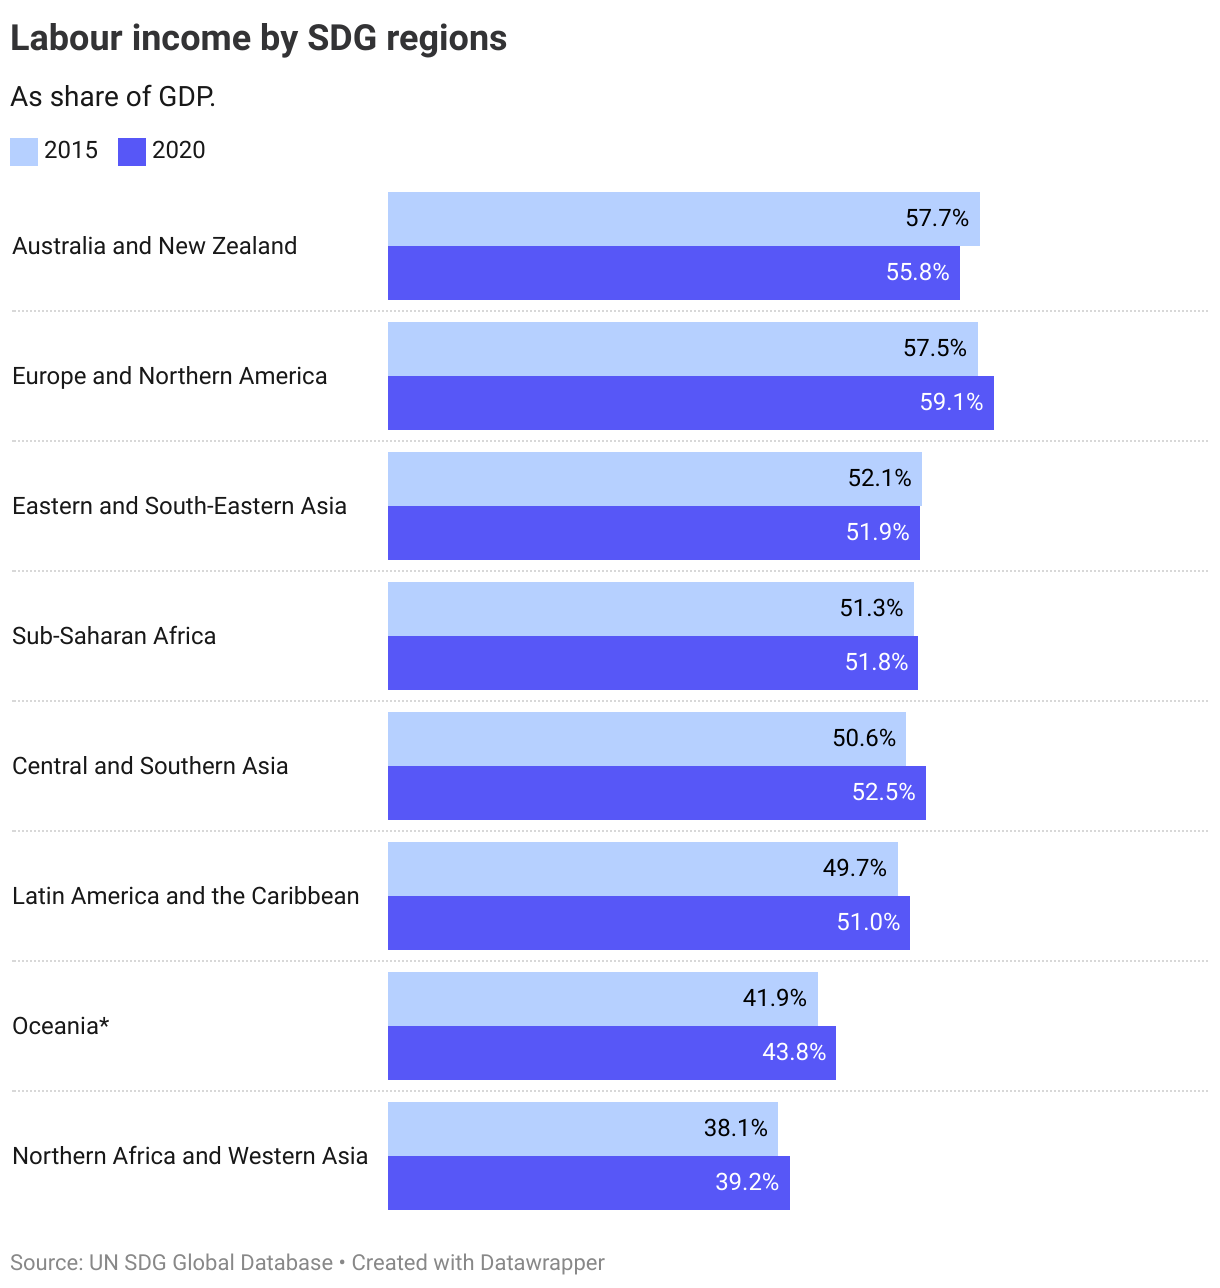
Labour shares are generally higher in high-income countries. Since 2015, the majority of regions have seen an increase in the labour income share.
Data on the redistributive impacts of fiscal policy (indicator 10.4.2) are not available at the global or regional level.
The Nordics
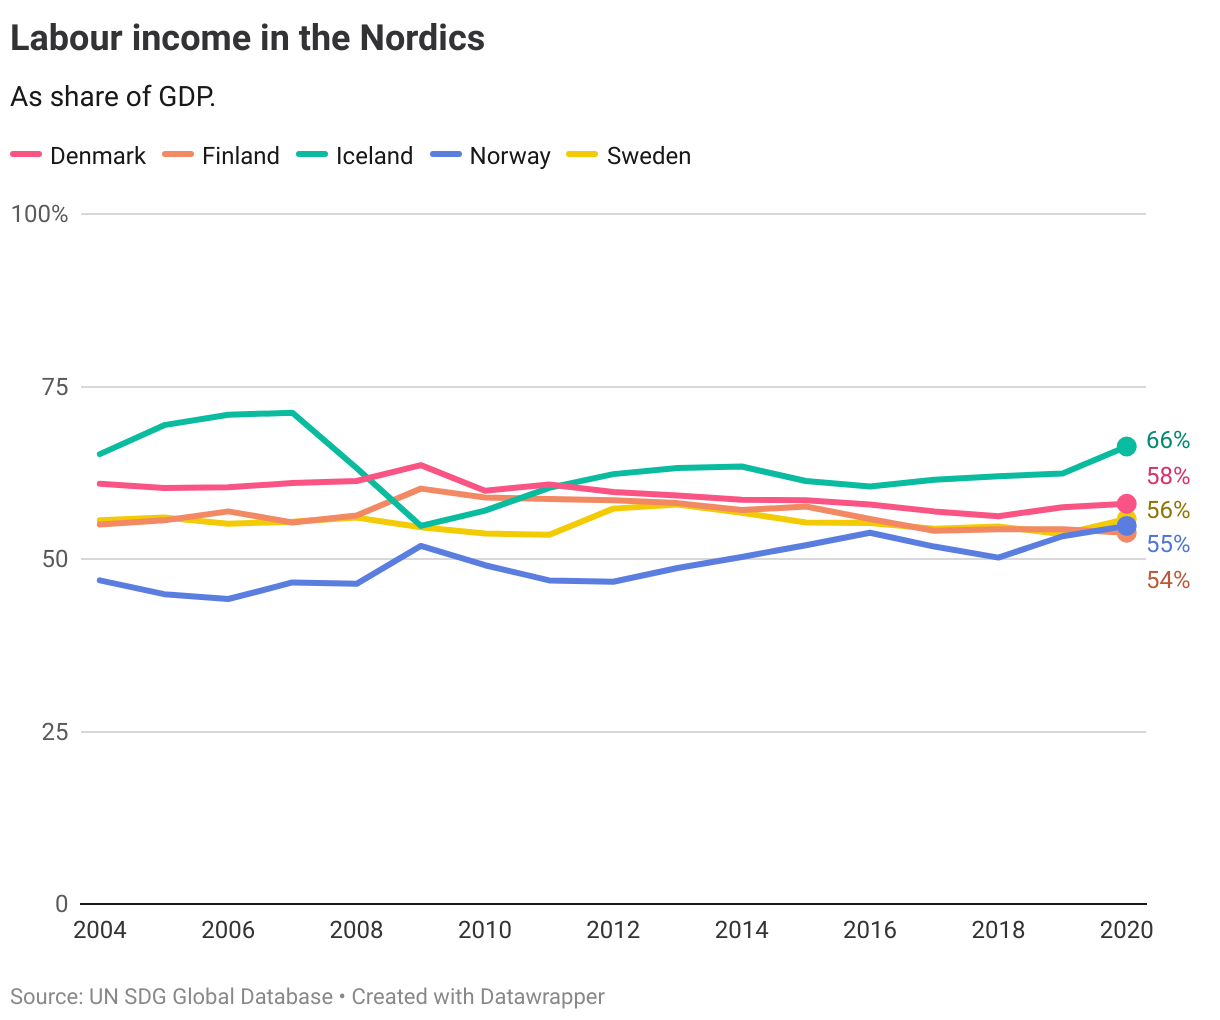
In assessing progress for OECD countries, the OECD relies on data from its Income Distribution Database (IDD) rather than the SDG global indicator database due to the availability of more updated data.
For the labour share, the OECD target is operationalised at 62%, which is the level of top OECD performers in 2015. The latest data from 2020 shows that only Iceland is above this threshold, and of those below, only Norway is trending towards it.
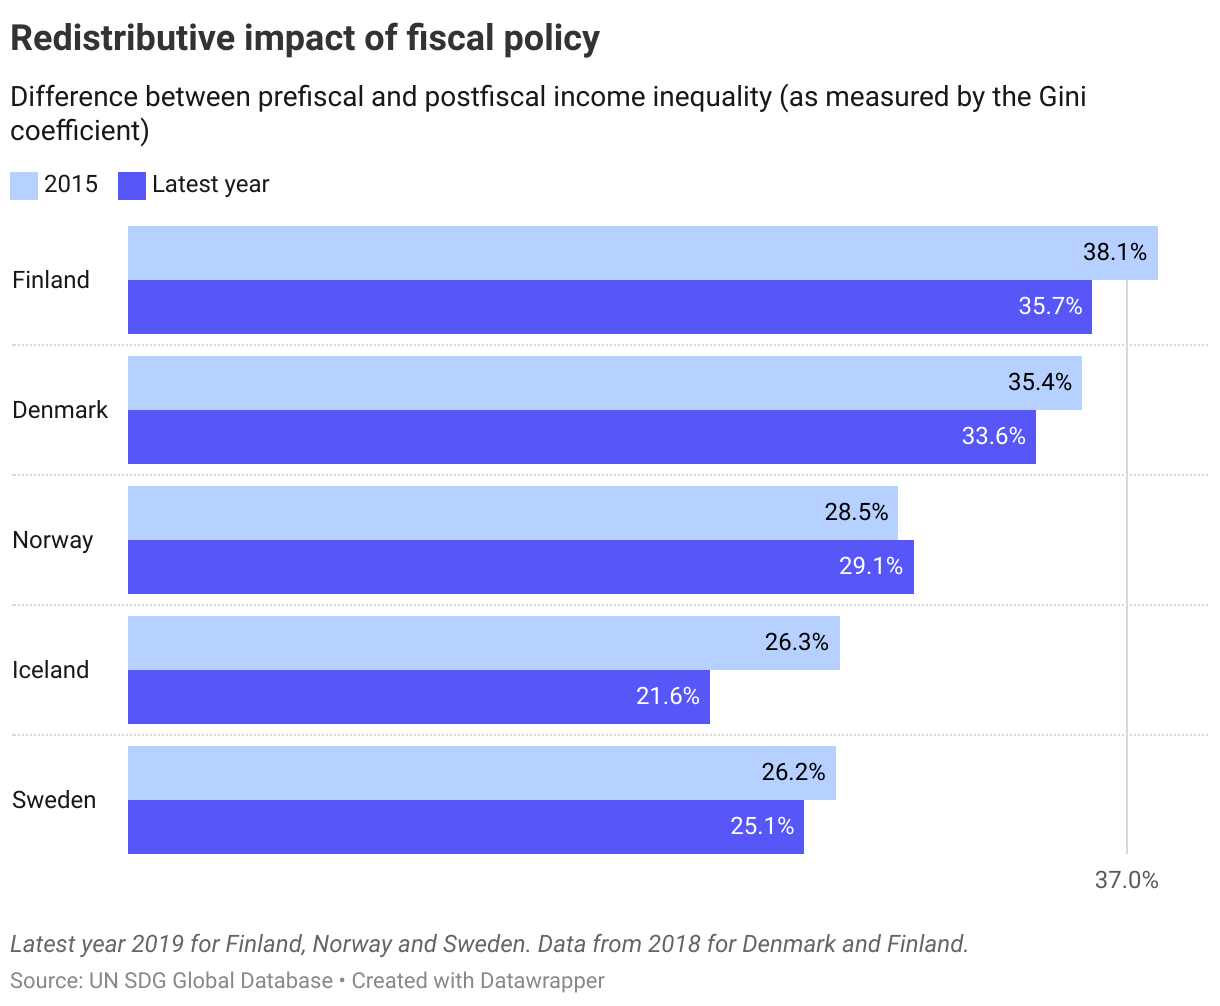
The second indicator redistributive impact of fiscal policy is measured by the Gini coefficient (a measure of inequality) before and after the effects of taxes and transfers. A higher relative difference would indicate that taxes and transfers have stronger redistributive effects. The target level has been set at a relative difference of 37% (the level of top OECD performers in 2015). In other words, that taxes and transfers reduce inequality as measured through the Gini coefficient by 37%.
The latest datashows that none of the Nordics is currently above the target level. Denmark and Finland are at a short distance, but trending away from the target.
A combined assessment of both indicators (labour share and fiscal redistribution) shows that Denmark is the only country at a short distance to the target, with Norway at a long distance but making progress. The remaining countries are at a long distance and not making progress.
Denmark
Short distance to target
Finland
Long distance to target, not progressing
Iceland
Long distance to target, not progressing
Norway
Long distance to target but progressing
Sweden
Long distance to target, not progressing
Target 10.5
Improve the regulation and monitoring of global financial markets and institutions and strengthen the implementation of such regulations
| 10.5.1 | Financial Soundness Indicators |
Global trends
No data is available at the global or regional level.
The Nordics
The basis for the measurement of progress on this target is the IMF’s Financial Soundness Indicators, which consists of seven indicators aimed at assessing the strengths and vulnerabilities of countries’ financial systems.
While no target level is set in the global indicator framework, the OECD has operationalised the 2030-target by benchmarking performance against the level achieved by top OECD performers in 2015.
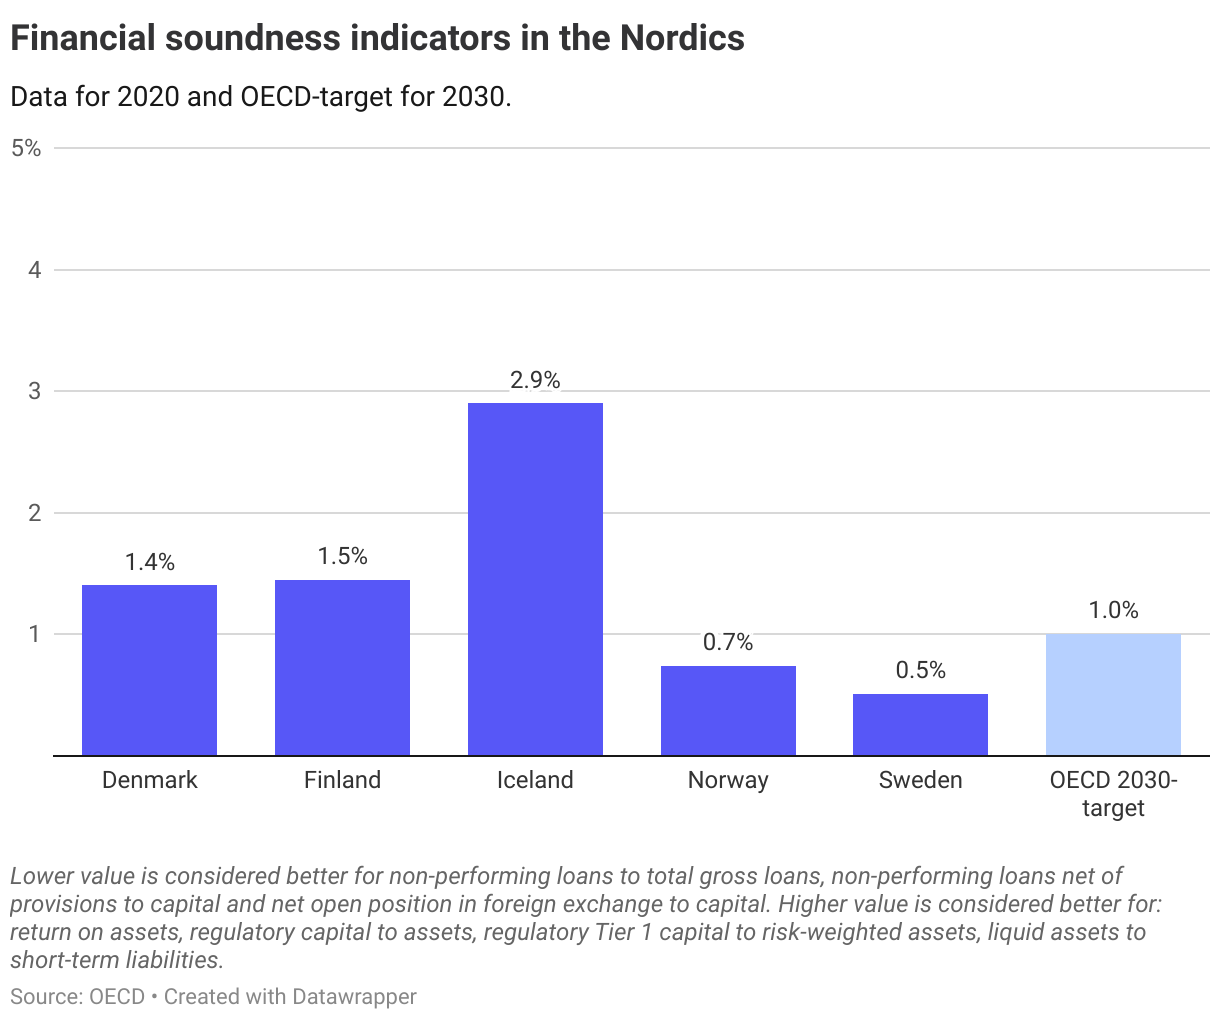
Overall, a combined assessment across all indicators is that Norway is the only country having met the target, with Finland and Sweden at a short distance.
Denmark
Long distance to target, not progressing
Finland
Short distance to target
Iceland
Long distance to target but progressing
Norway
Target is met
Sweden
Short distance to target
Target 10.6
Ensure enhanced representation and voice for developing countries in decision-making in global international economic and financial institutions in order to deliver more effective, credible, accountable and legitimate institutions
| 10.6.1 | Proportion of members and voting rights of developing countries in international organizations |
Global trends
The chart below shows the latest available data on developing countries’ share of voting rights and membership in different international organisations.
The largest discrepancies between membership share and voting rights are found in the International Bank for Reconstruction and Development (part of the World Bank), the International Monetary Fund (IMF) and the International Finance Cooperation (IFC).
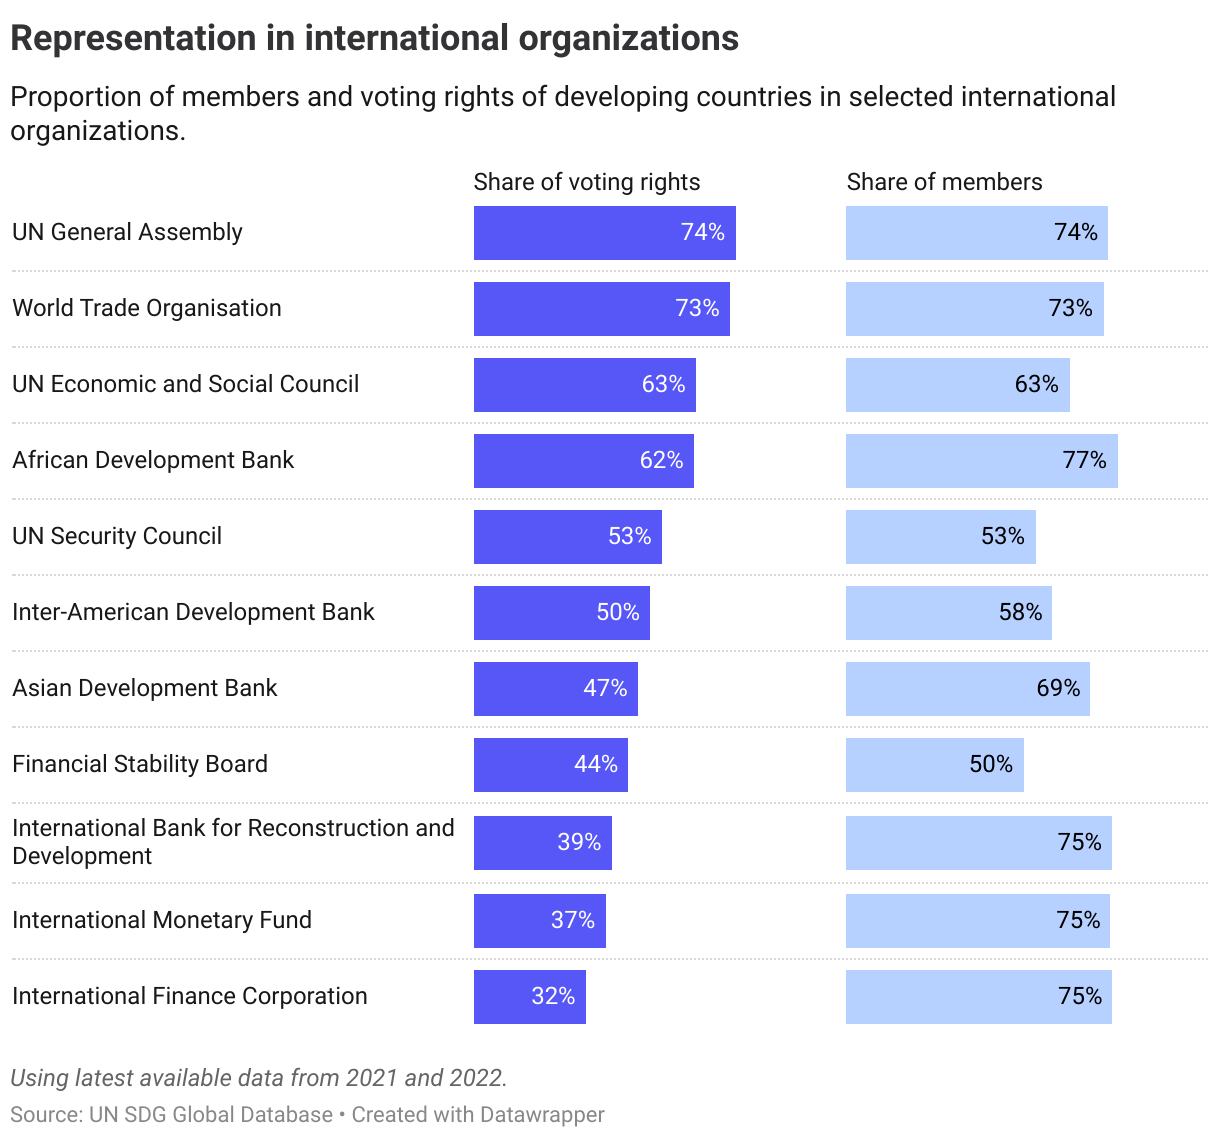
Over the past two decades, developing countries’ share of voting rights, as well as membership shares, have remained relatively stable. One notable exception is an increase in voting rights in the IMF from 31% in 2000 to 37% in 2022.
The Nordics
Target not applicable to measure for Nordic countries.
Target 10.7
Facilitate orderly, safe, regular and responsible migration and mobility of people, including through the implementation of planned and well-managed migration policies
| 10.7.1 | Recruitment cost borne by employee as a proportion of monthly income earned in country of destination |
| 10.7.2 | Number of countries with migration policies that facilitate orderly, safe, regular and responsible migration and mobility of people |
| 10.7.3 | Number of people who died or disappeared in the process of migration towards an international destination |
| 10.7.4 | Proportion of the population who are refugees, by country of origin |
Global trends
No data is available for the first indicator (10.7.1).
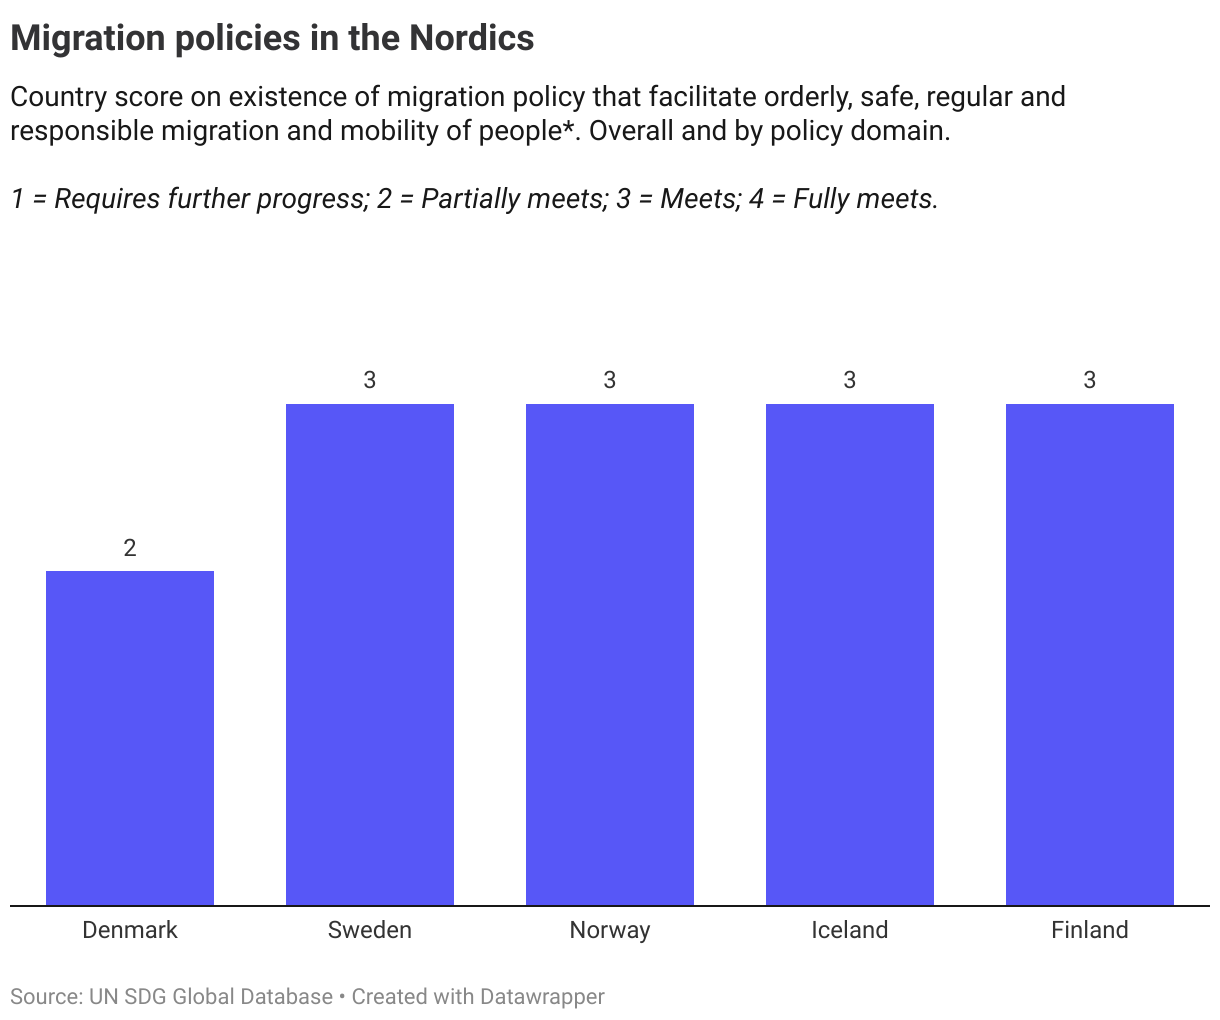
10.7.2. Migration policy
The second indicator of migration policies is assessed by the UN through looking at six policy domains at the country-level:
- Migrant rights
- Whole-of-government/Evidence-based policies
- Cooperation and partnerships
- Socioeconomic well-being
- Mobility dimensions of crises
- Safe, orderly and regular migration
The six policy domains cover a total of 30 indicators on migration policy. Countries are classified by a score from 1 to 4 on whether they have migration policy that facilitates orderly, safe, regular and responsible migration and mobility of people:
- Country requires further progress
- Country partially meets requirements
- Country meets requirements
- Country fully meets requirements
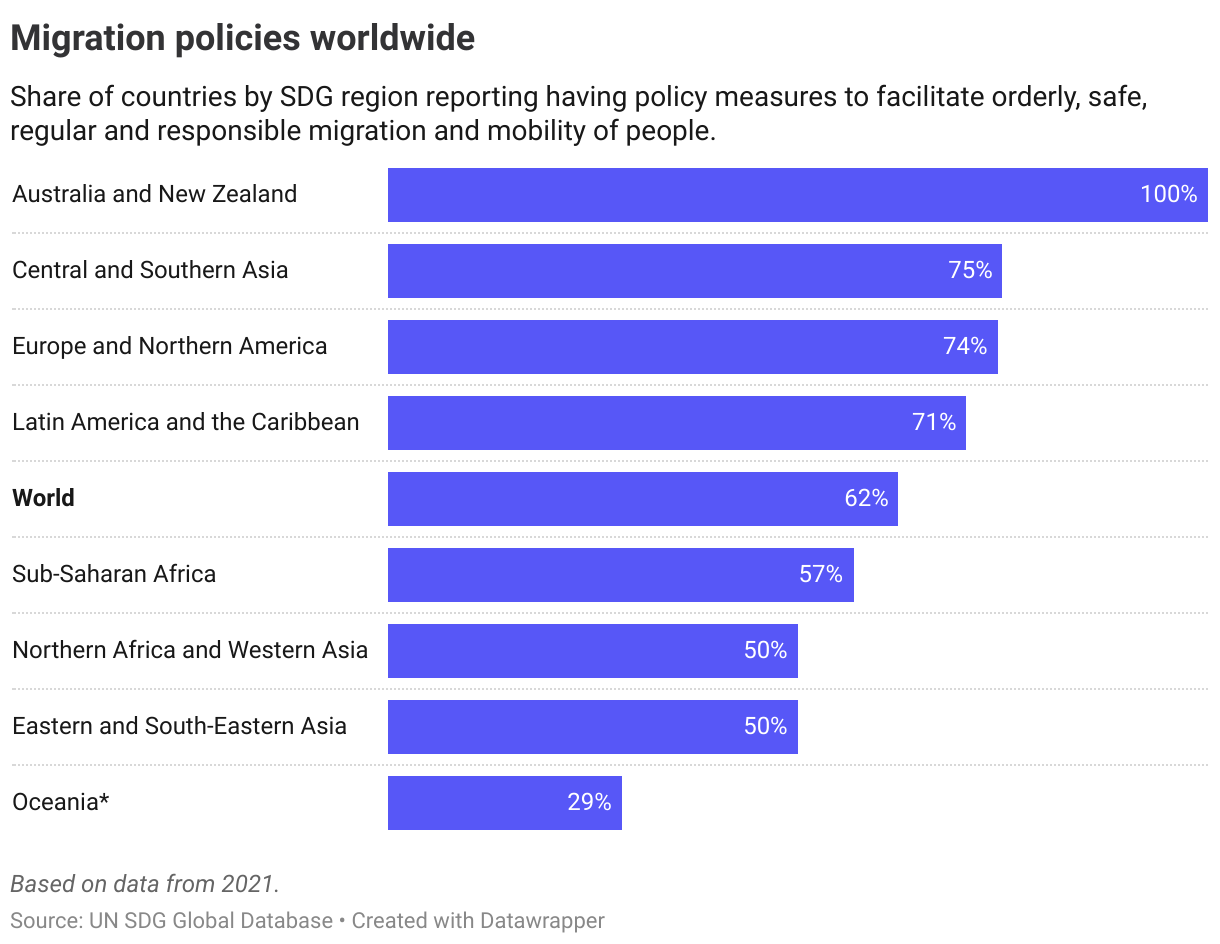
The chart below shows the share of countries reaching levels 3 and 4 (meets/fully meets), worldwide and by SDG region.
While data does not allow for assessing trends over time, data from 2021 shows that worldwide some 6 of 10 countries reach level 3 or above. The share of countries reaching levels 3 and 4 was lowest in Oceania and highest in Central and Southern Asia and Europe and Northern America.
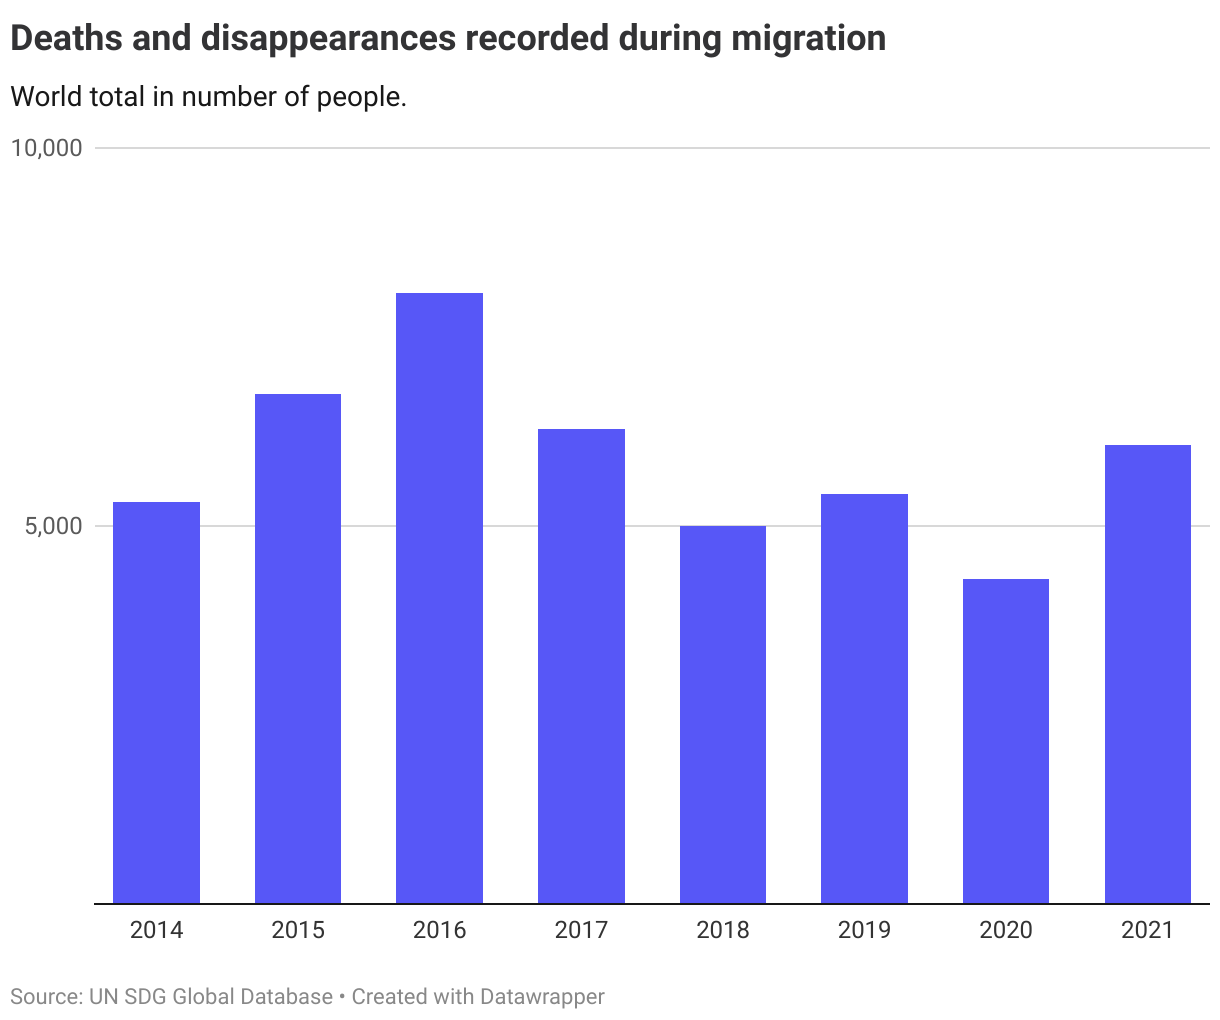
10.7.3. Deaths and disappearances
For the third indicator, the latest data from 2021 shows that the number of deaths and disappearances during migration reached its highest level since 2017, with the majority of fatalities (above 3,400) occurring on maritime and land routes to and through Europe. According to the UN, the pandemic was an important factor in the 2021 figures:
The widespread impact of the pandemic forced many people seeking safety, reunification with family, decent work and better opportunities to take risky migratory routes.
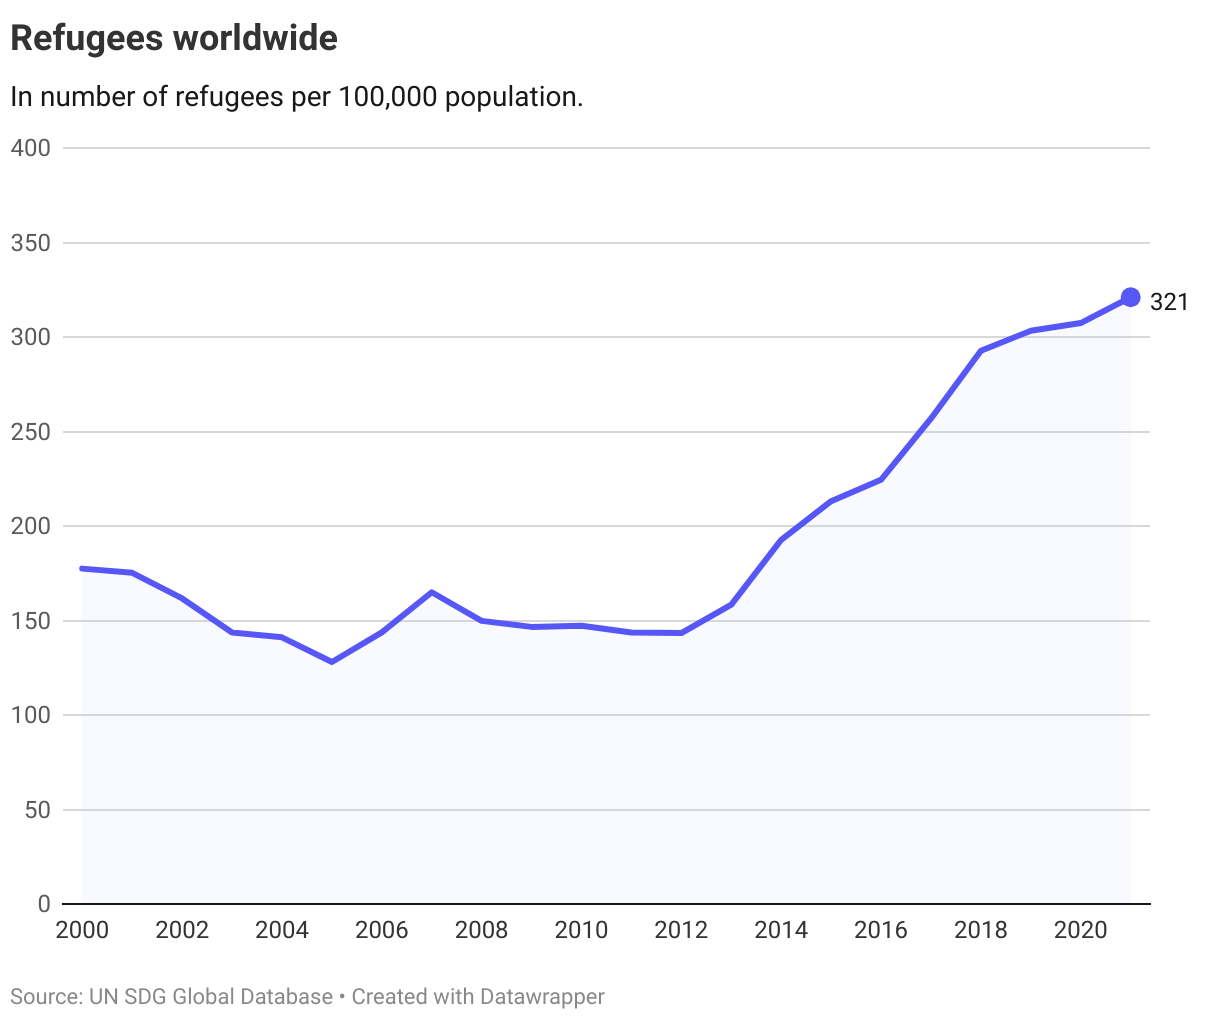
10.7.4. Proportion of population that are refugees
Data on the fourth indicator (10.7.4) shows that the number of refugees is on the rise worldwide. Measured as the number of refugees per 100,000 population, the number of refugees increased from 213 to 321 in 2021. Northern Africa and Western Asia is by far the region with the highest share of refugees, with over 8 million of the world’s 24 million refugees originating from this region.
The Nordics
No assessment of progress is given for this target, as data is only available for the second (10.7.2 migration policies) and fourth indicator (10.7.4 share of refugees). On the latter, there is no clear normative direction for which to assess the target (if the share should be high/low).
Scores on migration policies (10.7.2) show Denmark at level 2 (partially meets requirements) and the other Nordic countries at level 3 (meets requirements).
Target 10.a
Implement the principle of special and differential treatment for developing countries, in particular least developed countries, in accordance with World Trade Organization agreements
| 10.a.1 | Proportion of tariff lines applied to imports from least developed countries and developing countries with zero-tariff |
Global trends
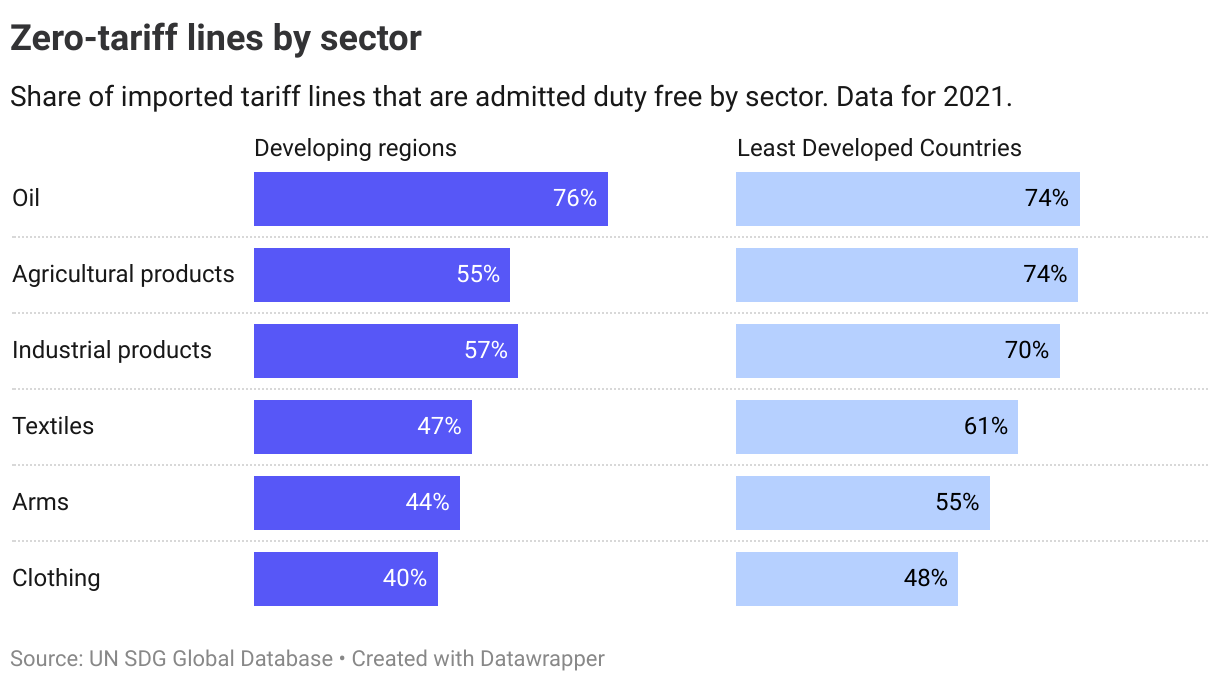
In 2021 just over half of the products produced in developing regions received duty-free treatment. For exports from least developed countries, the duty-free share stood slightly higher at 64%.
Since 2015, the duty-free share has remained stable for LDCs, while it has increased by 6 percentage points for developing regions, indicating improvements in special and differential treatment.
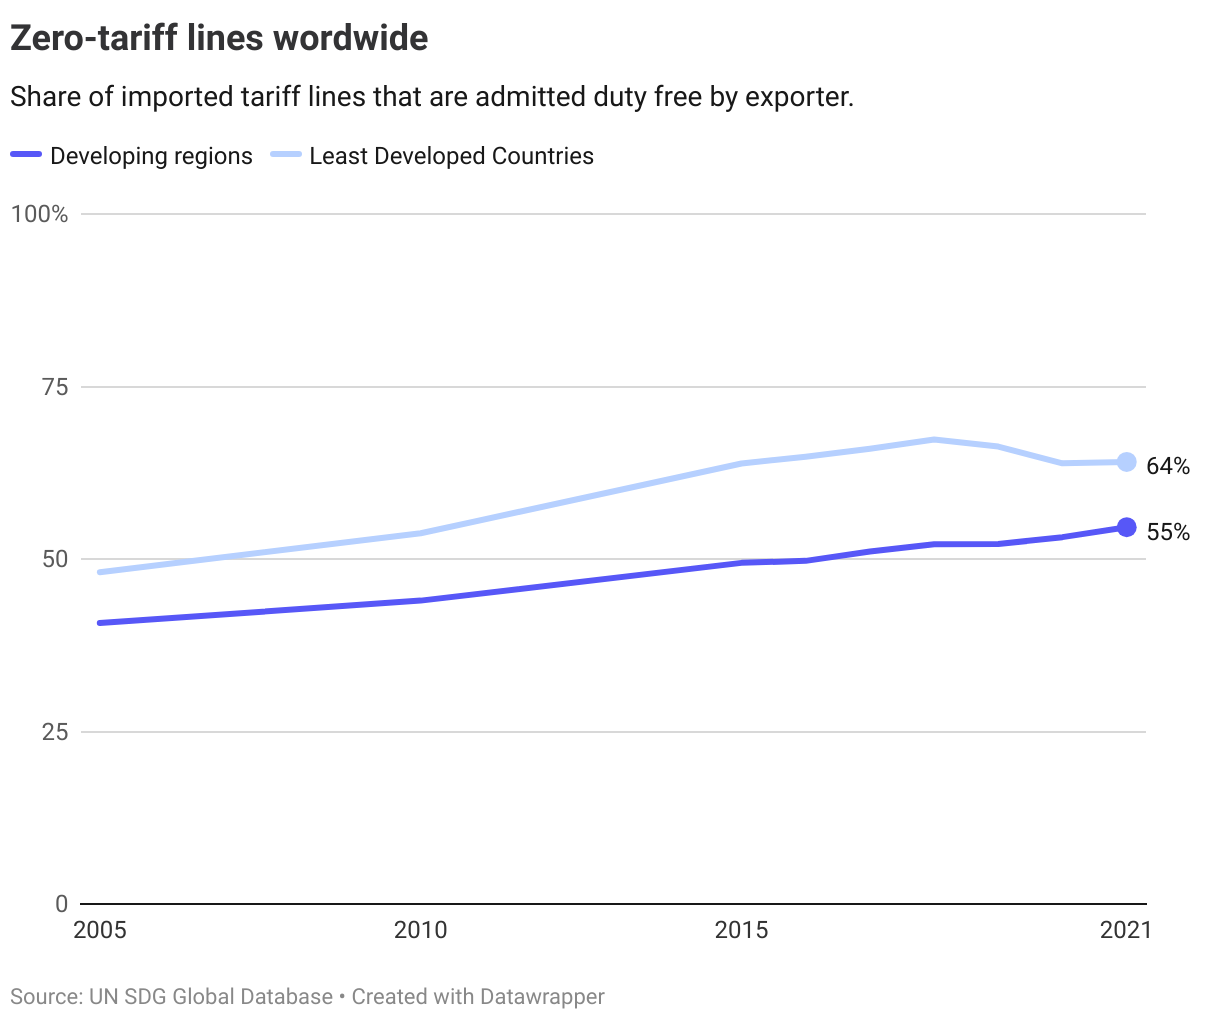
The share of duty-free lines varies significantly between sectors, with textile and clothing exports having the lowest shares of duty-free lines.
The Nordics
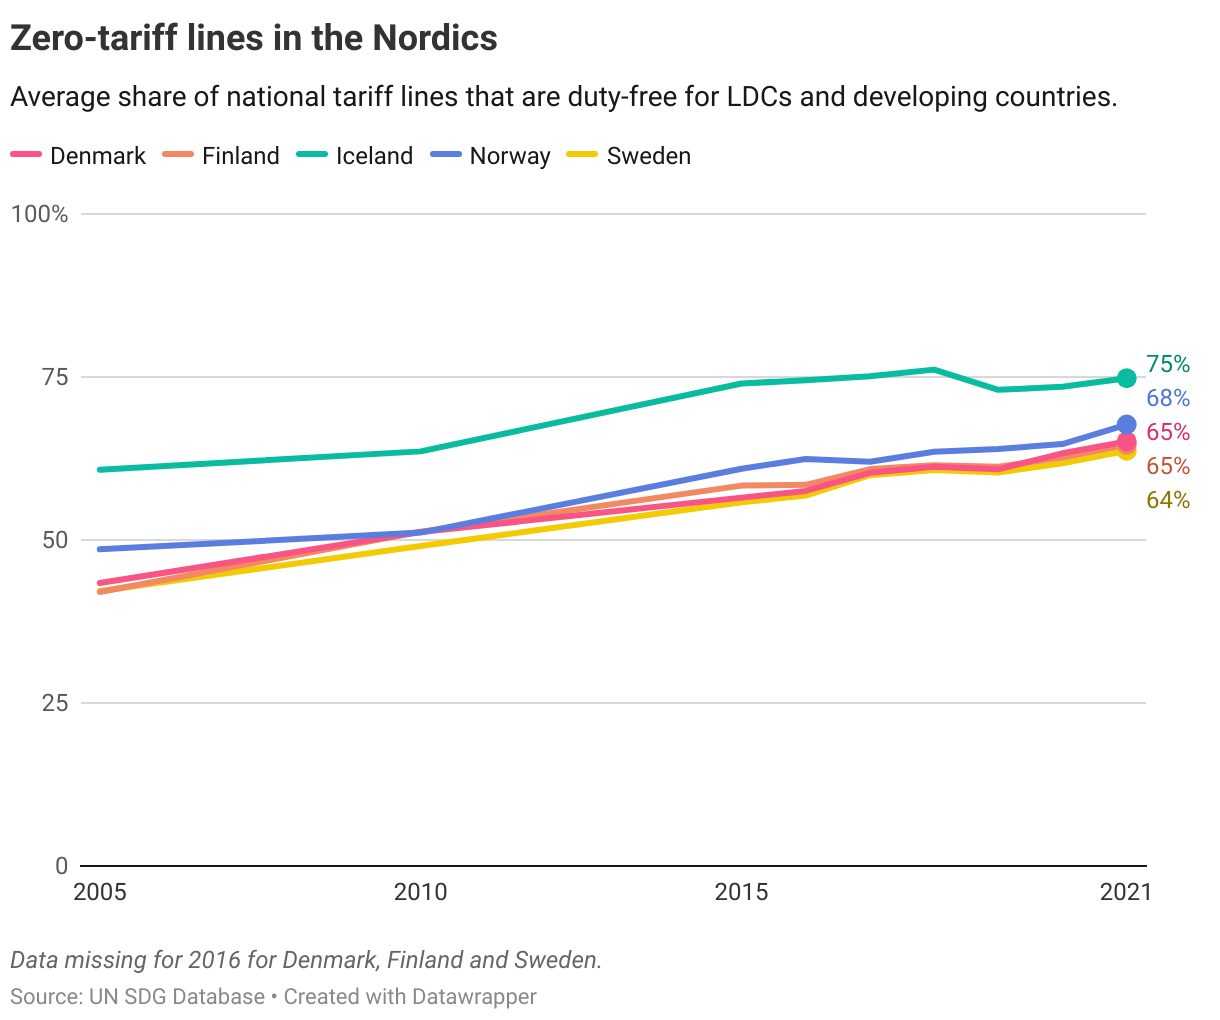
There is no set target for the share of duty-free tariff lines at the country level. As such, the OECD has operationalised this target for OECD countries at 69%, which is the level of the top OECD performers in 2015 (Iceland being one of them).
Iceland has kept its level above the target threshold, while all the other Nordics have made progress towards it and are on track to reach the target by 2030.
Denmark
Target is on track
Finland
Target is on track
Iceland
Target is met
Norway
Target is on track
Sweden
Target is on track
Target 10.b
Encourage official development assistance and financial flows, including foreign direct investment, to States where the need is greatest, in particular least developed countries, African countries, small island developing States and landlocked developing countries, in accordance with their national plans and programmes
| 10.b.1 | Total resource flows for development, by recipient and donor countries and type of flow (e.g. official development assistance, foreign direct investment and other flows) |
Global trends
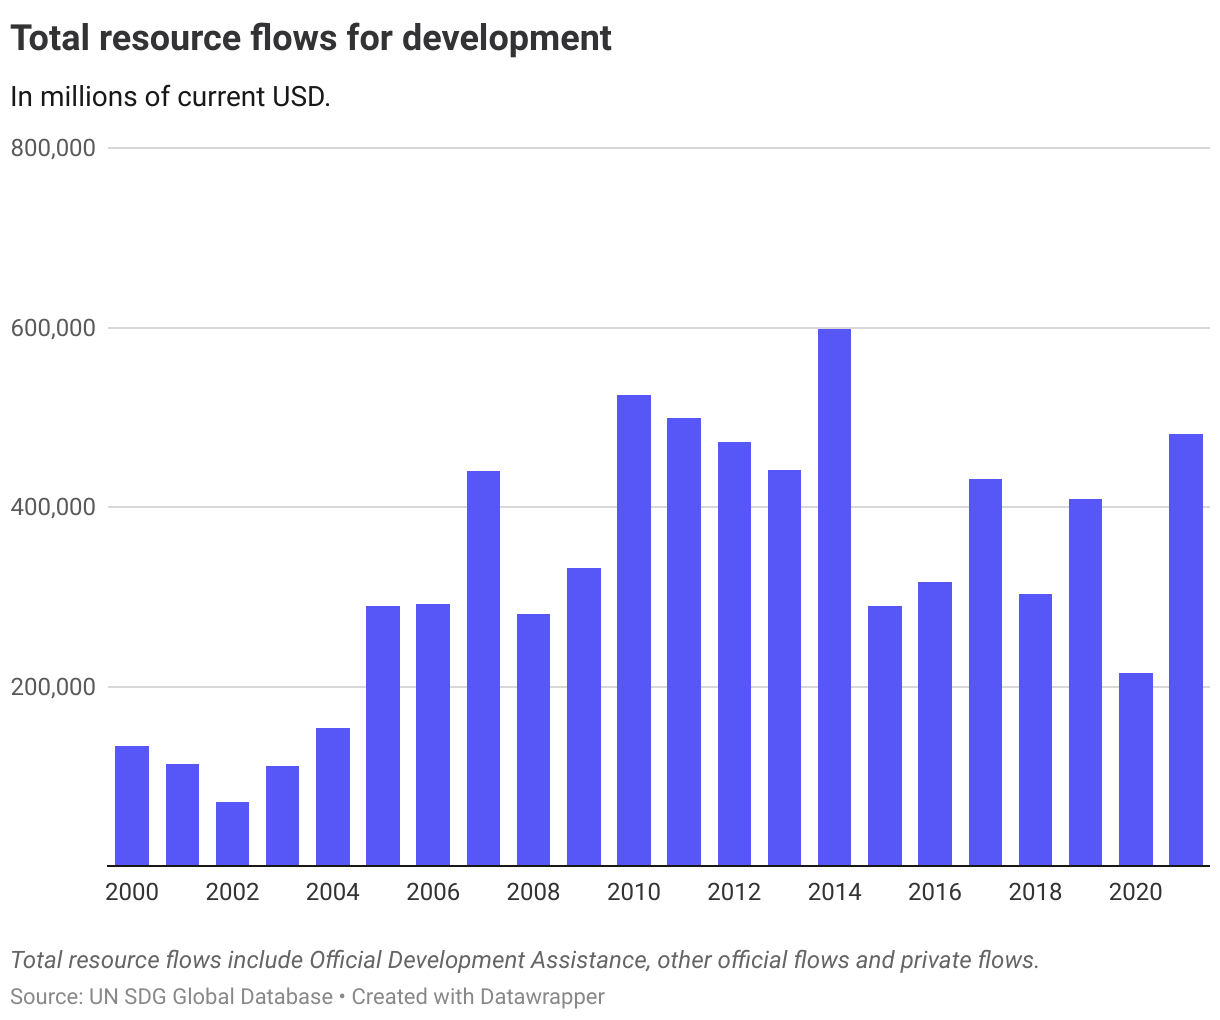
While the target sets out a commitment to encourage development assistance and investment, there is no set numerical target. Data from the OECD on total resource flows is shown below for informative purposes.
The Nordics
No assessment of progress is performed for the Nordic countries, as the distribution of international flows will depend on the national context.
Target 10.c
By 2030, reduce to less than 3 per cent the transaction costs of migrant remittances and eliminate remittance corridors with costs higher than 5 per cent
| 10.c.1 | Remittance costs as a proportion of the amount remitted |
Global trends
Despite progress in recent years, the world is still far from the target of reducing remittance costs to less than 3%.
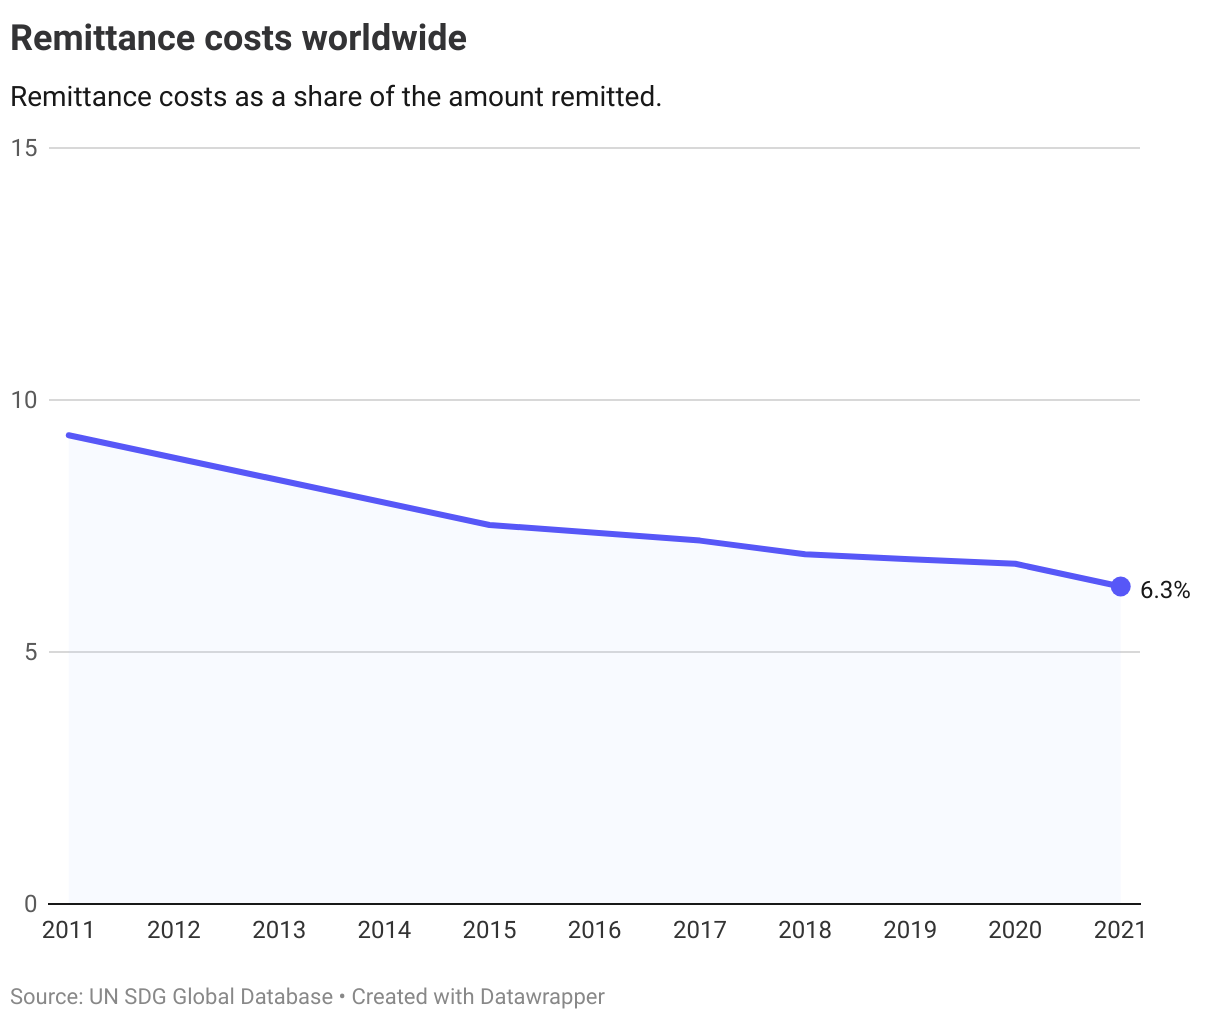
The highest remittance costs (by receiving region) is in Oceania and Sub-Saharan Africa, both above 8%.
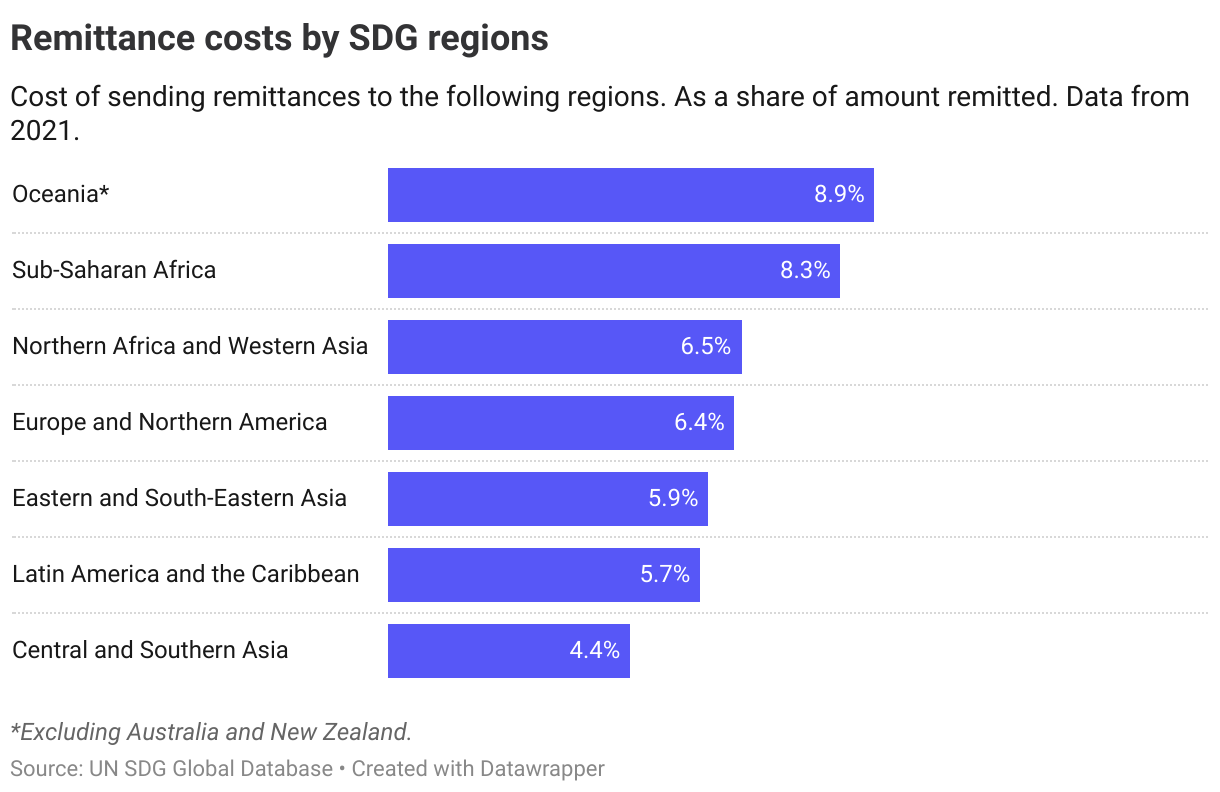
The UN notes in its 2022 SDG progress report that digital remittances had a global average cost of 5.0%, with non-digital remittances at 6.7%. With just 27% of remittances being made digitally, there is hope for reducing remittance costs by facilitating more use of digital transfers.
The Nordics
Not enough data avaliable to assess progress in the Nordic countries on the cost of sending remittances.