

Introduction
This data tracker analyses the Nordic countries’ progress towards achieving Sustainable Development Goal 1: End poverty in all its forms everywhere. The goal is comprised of 7 targets.
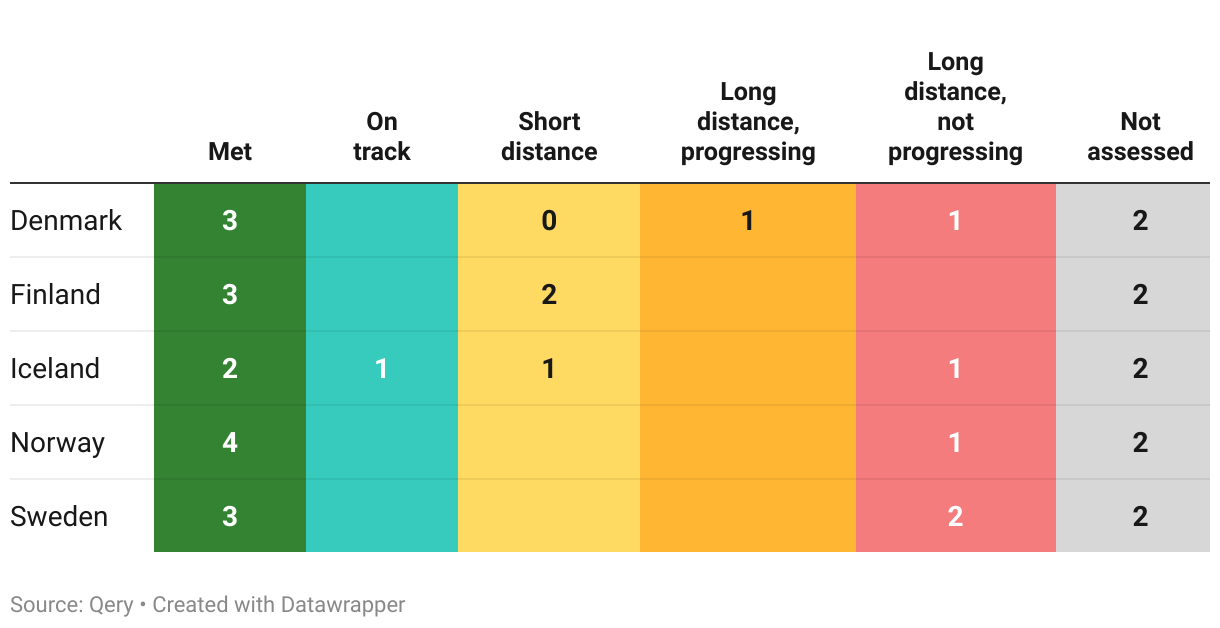
The Nordic countries – Denmark, Finland, Iceland, Norway and Sweden – are classified into one of five categories for each target:
Met: The country has already met the 2030 target.
On track: The country has not yet met the target but is on track to do so by 2030.
Short distance: The country has not met the target and is not projected to do so but is close to achieving it. This category also applies when the country currently meets the target but is projected to move away from it.
Long distance but progressing: The country is far from the target but is making progress towards it.
Long distance and not progressing: The country is far from the target and is not making progress towards reaching it.
Details on the methodology used, together with the overall assessment for all 17 goals, can be found on our overview page. Note that the analysis is currently work in progress.
Overall assessment of progress
As of mid-2023, our analysis of the Nordic countries shows the following results for the 7 targets part of SDG 1:
The Nordic countries’ performance on the different targets part of this goal can be explored further below. Each section follows the same structure:
- First, the official target text and related indicators is described and the latest global and regional trends are highlighted briefly.
- Second, where data is available, we then zoom in on the Nordic countries to describe how they are progressing, and assess their likelihood of achieving the target by the 2030 deadline.
- Note that both sections above strictly uses data from the UN SDG Global Database and/or the OECD.
Target 1.1
By 2030, eradicate extreme poverty for all people everywhere.
| 1.1.1 | Proportion of the population living below the international poverty line |
Global trends
Extreme poverty is defined as living below the international poverty line, currently set at $2.15 per person per day (in comparable international prices).
While the percentage of people living in extreme poverty has seen a decrease in the past decades, the progress has been slowing since 2015. According to the latest official UN data, approximately 8.5% of the global population—659 million people—lived in extreme poverty in 2019. This was a significant improvement from nearly 30% in 2000, meaning that over 1 billion people escaped extreme poverty since the start of the decade.
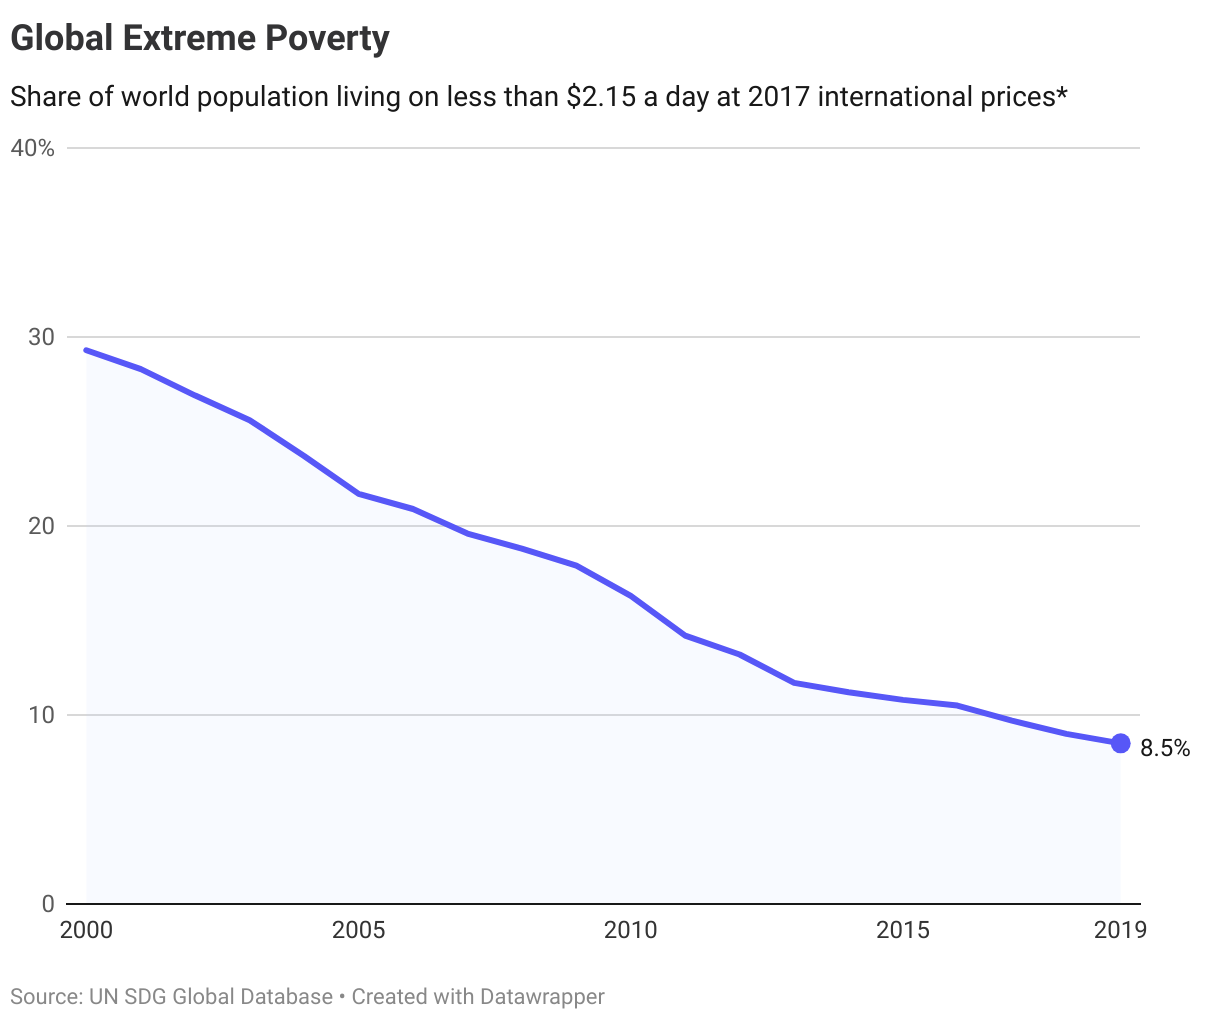
However, the COVID-19 pandemic has severely impacted this progress. In a striking reversal of three decades of improvement, it is estimated that extreme poverty increased for the first time in a generation in 2020 to approximately 9.3%. The latest estimates suggest that in 2022, 8.4% of the world population – as many as 670 million people – were living in extreme poverty.
Looking ahead to 2030, the World Bank projects that around 575 million people—7% of the global population—will live in extreme poverty, most of which will live in Sub-Saharan Africa. As such, the world will significantly missing the global target set in the Sustainable Development Goals of reducing the extreme poverty rate to below 3% (less than 255 million people).
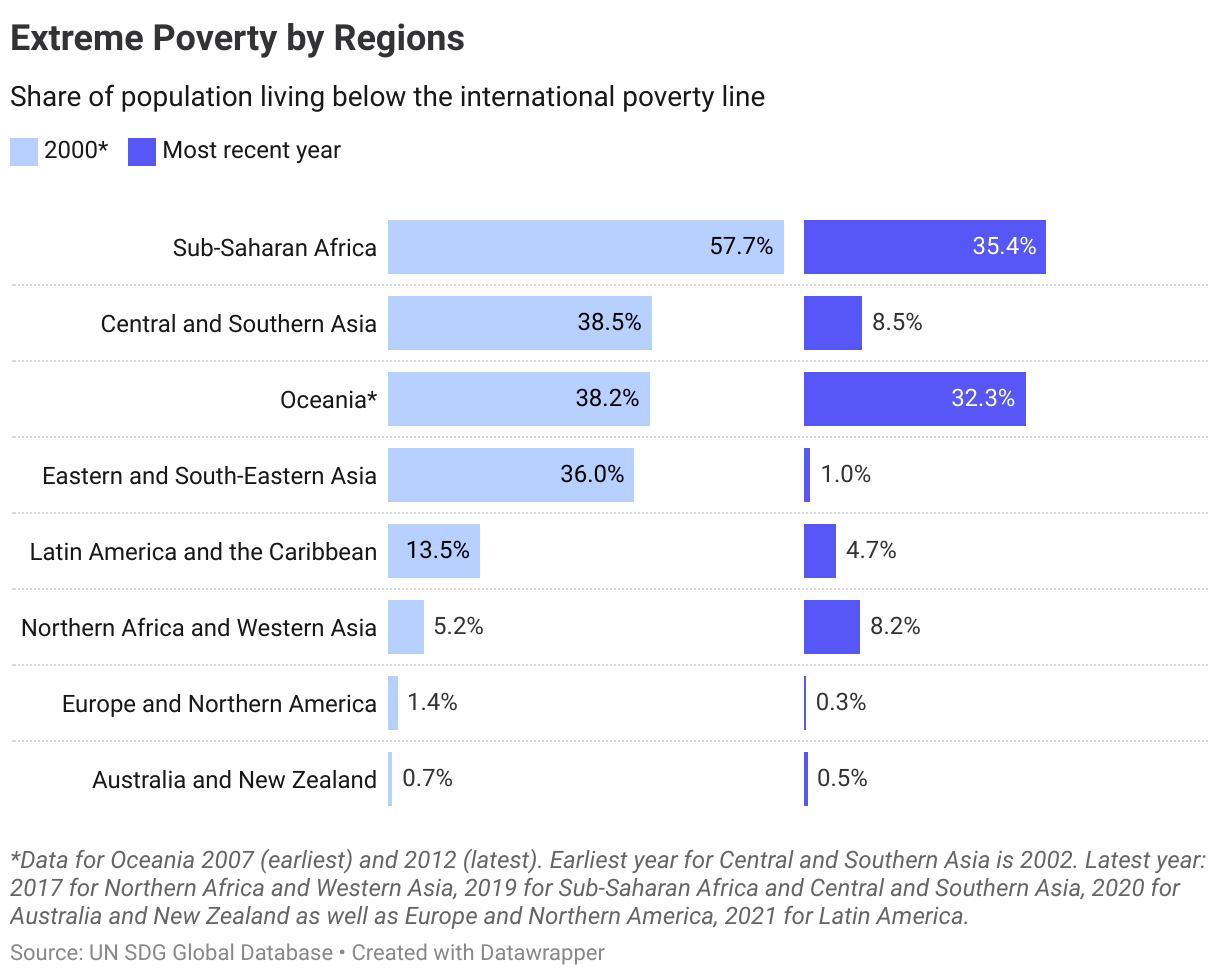
Many regions have made significant progress has been made towards reducing the share of people living in extreme poverty.
- Sub-Saharan Africa: Extreme poverty rates decreased from 58% in 2000 to 35% in 2019. Still, the region currently accounts 60% of the global population living in extreme poverty.
- Eastern and South-Eastern Asia: This region saw a significant decrease in extreme poverty, from 36% in 2000 to 1% in 2019.
- Central and Southern Asia: Extreme poverty rates dropped from 39% in 2002 to 9% in 2019.
- Latin America and the Caribbean: The rate of extreme poverty decreased from 14% in 2000 to 5% in 2021.
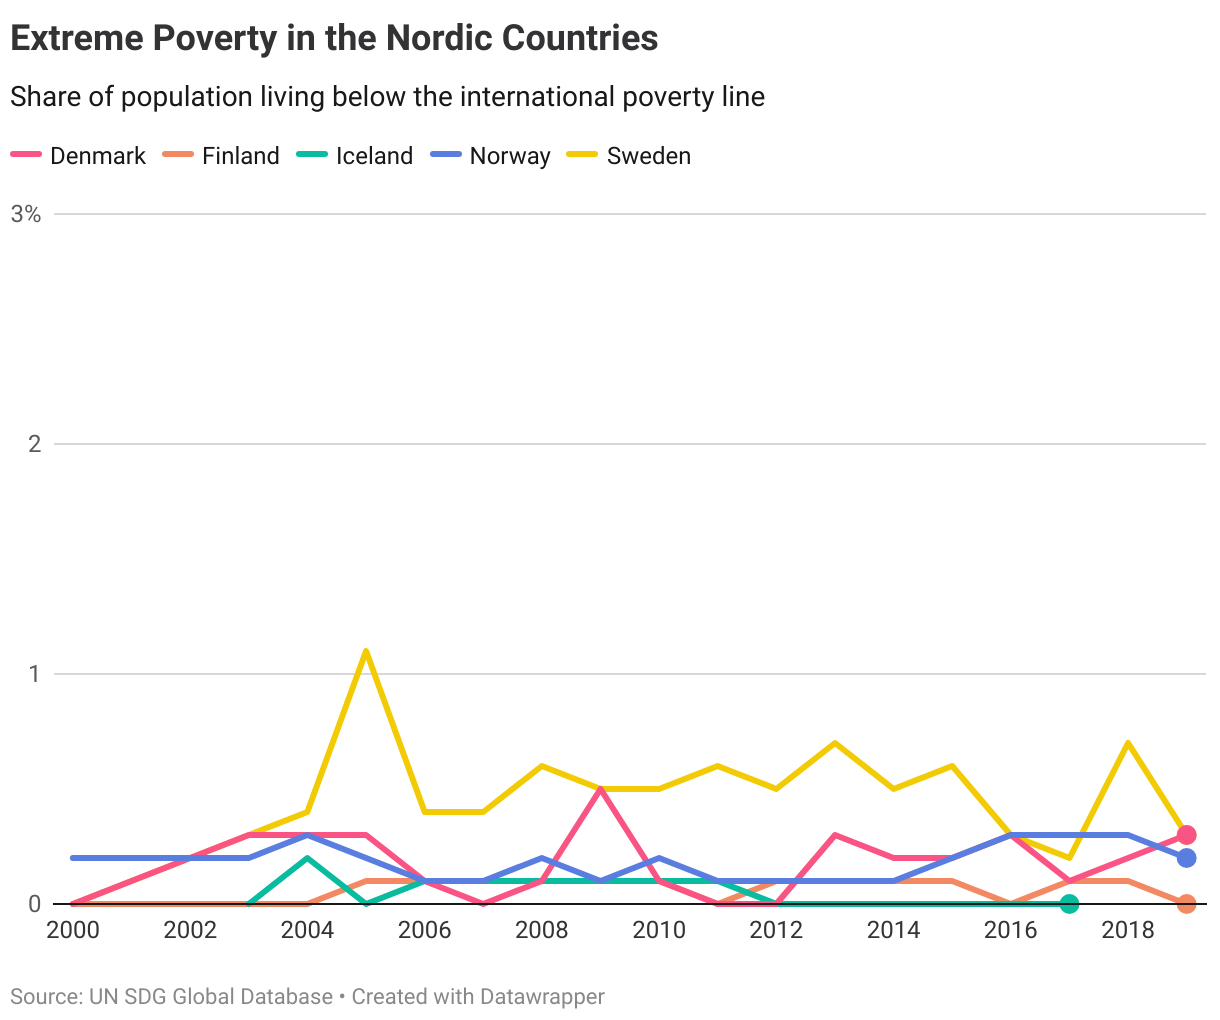
The Nordics
Extreme poverty is virtually non-existent in the Nordic countries, with all countries below the 3% target according to the latest UN data. All the Nordic countries have thus already met the target for 2030.
Denmark
Target is met
Finland
Target is met
Iceland
Target is met
Norway
Target is met
Sweden
Target is met
Target 1.2
By 2030, reduce at least by half the proportion of men, women and children of all ages living in poverty in all its dimensions according to national definitions
| 1.2.1 | Proportion of population living below the national poverty line |
| 1.2.2 | Proportion of men, women and children of all ages living in poverty in all its dimensions according to national definitions |
Global Trends
In contrast to target 1.1, which focuses on the absolute measure of poverty, target 1.2 is aimed at alleviating poverty as per nationally determined poverty thresholds. These thresholds vary from country to country in their definitions, hence global or regional trends are not examined in further detail here.
According to the latest UN data for 2020, only 27% of countries had achieved the target of halving the proportion of the population living below their nationally established poverty lines. In 52% of countries, poverty rates have declined by less than half, whereas they have increased in 22% of countries. The regions with the most progress are Central Asia and Southern Asia as well as Eastern Asia and South-eastern Asia. If current trends persist, the UN estimates that only 40% of countries will achieve the target of halving poverty by 2030.
Note that this data only covers 68 countries with set national poverty lines and available data.
The Nordics
The OECD uses two indicators to follow progress in OECD countries towards target 1.2:
- a measure of relative income poverty
- a measure of multidimensional poverty
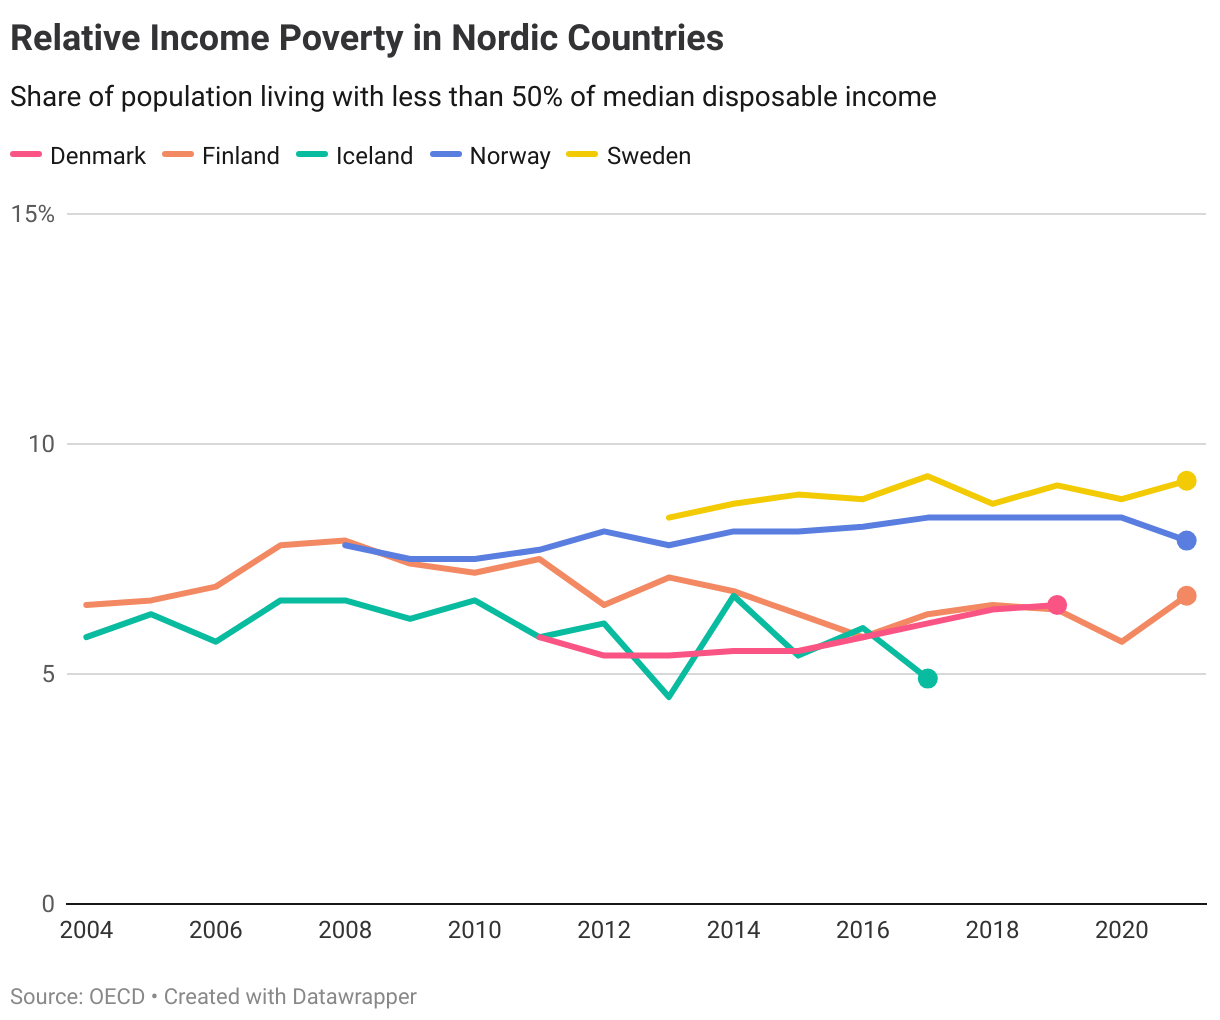
1.2.1. Relative income poverty
The relative income poverty rate is defined as the percentage of people whose income falls below a poverty line set at half the median household income of the total population. The median household income is the level that falls exactly in the middle of all household incomes.
OECD data reveals that no Nordic country has made significant progress in reducing the relative income poverty rate over the past decades. The latest data indicates that relative income poverty is most prevalent in Sweden and Norway, both at above 8%. Iceland has the lowest share, although the most recent data is from 2017. Nevertheless, relative income poverty is less prevalent in the Nordic countries compared to other industrialized nations, with an average of 1 in 10 people living in OECD countries considered poor according to this definition.
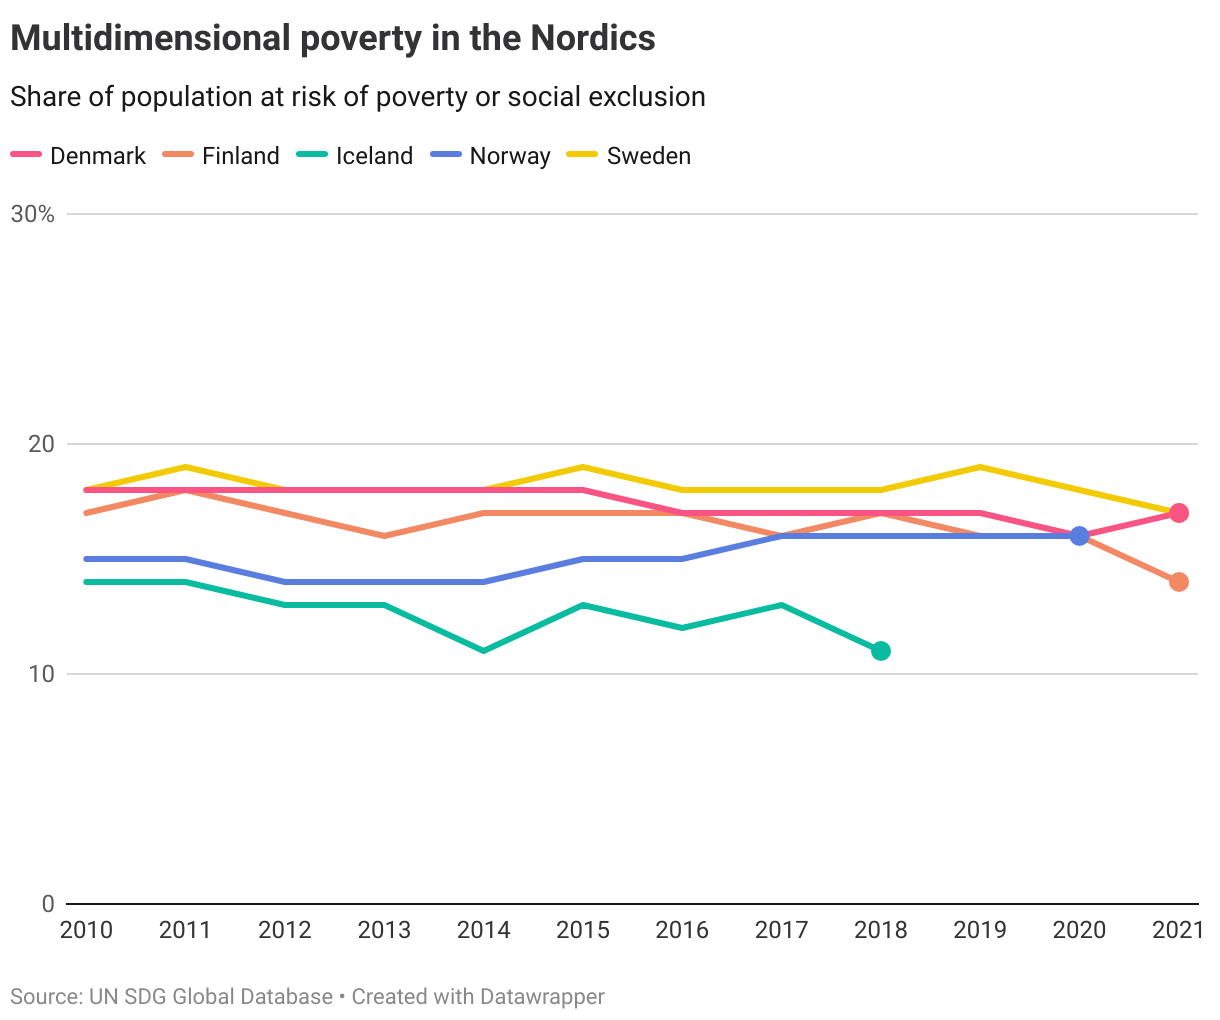
1.2.2. Multidimensional poverty
Measuring poverty based solely on a person’s or household’s income can risk overlooking other factors contributing to poverty. The European statistical agency, Eurostat, publishes data for a measure of multidimensional poverty that covers people who are:
- at risk of poverty
- severely materially deprived
- living in a household with a very low work intensity
Data for multidimensional poverty, as defined above, shows that multidimensional poverty rates in most Nordic countries have also remained relatively stable over the last decades.
Considering both indicators in target 1.2, relative income poverty and multidimensional poverty, the OECD has set the target level at half the median OECD rate in 2015. For relative income poverty that is a rate of 5.45% and for multidimensional poverty 10%.
Currently, Iceland is the only country that has already met the relative income poverty target, with no country currently achieving the target for multidimensional poverty. However, simulations based on historical trends show that Iceland is on track to achieve it.
When looking at both indicators for a combined assessment on target 1.2, Iceland is thus on track to achieve it. Finland are at a short distance away while Denmark is at a long distance but making progress towards it. Norway and Sweden are both at a long distance and not making progress.
Denmark
Long distance to target but progressing
Finland
Short distance to target
Iceland
Target is on track
Norway
Long distance to target, not progressing
Sweden
Long distance to target, not progressing
Target 1.3
Implement nationally appropriate social protection systems and measures for all, including floors, and by 2030 achieve substantial coverage of the poor and the vulnerable
| 1.3.1 | Proportion of population covered by social protection floors/systems |
Global trends
This target underscores the pivotal role of social protection systems in preventing and reducing poverty. Such systems comprise a variety of measures designed to secure people’s employment, health, and income.
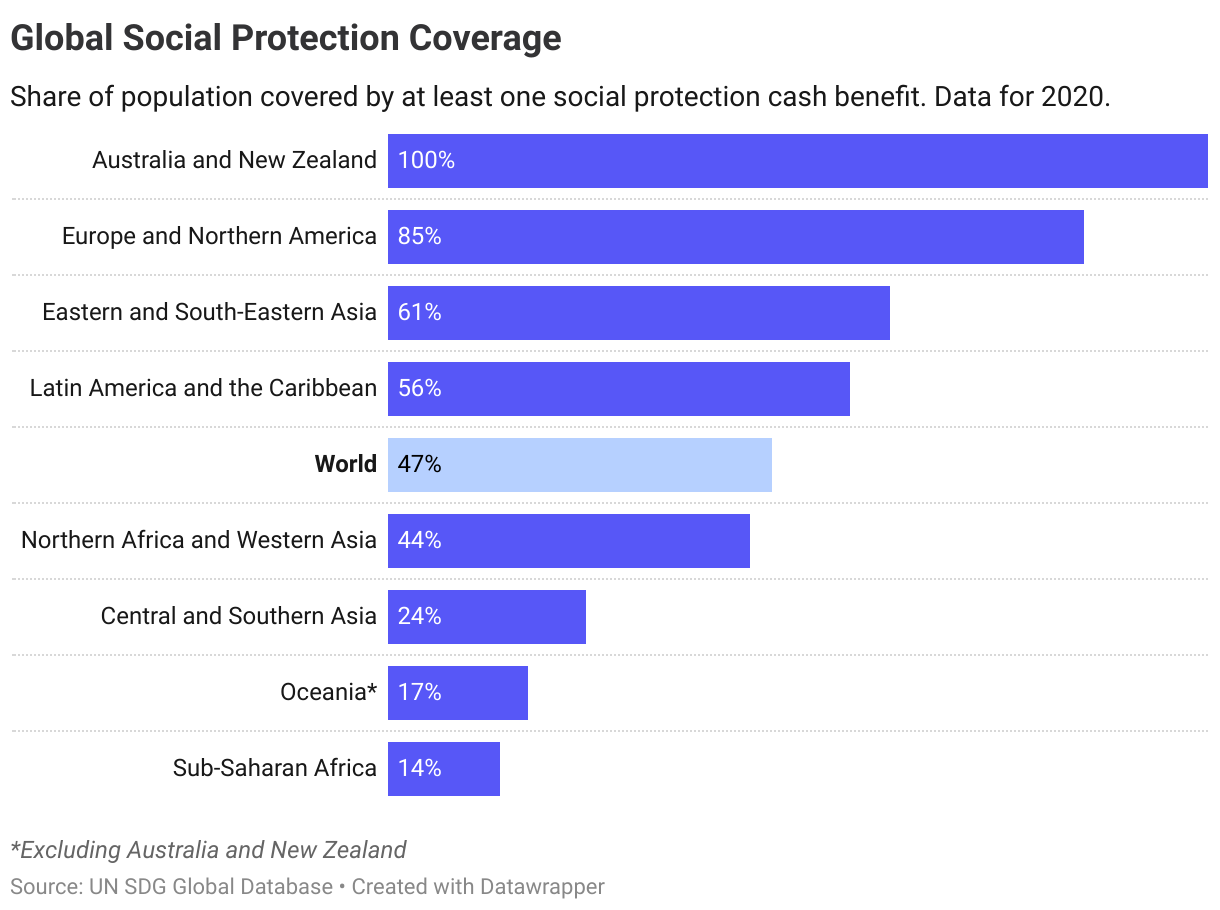
By 2020, 47% of the global population was effectively covered by at least one social protection cash benefit, a slight improvement from 45% in 2015. However, this still means that around 4 billion people across the world are without any form of protection or income security from social protection systems.
There are significant disparities in social protection coverage across different regions. For instance, in Sub-Saharan Africa, where poverty is most prevalent, only 14% of the population is covered. In contrast, over 80% of the population in most high-income countries benefit from social protection systems.
The Nordics
National-level measurements of social protection coverage measured by the UN include the following indicators:
- Proportion of population covered by at least one social protection cash benefit
- Proportion of children covered by social protection benefits
- Proportion of women giving birth covered by maternity benefits
- Proportion of persons with disabilities receiving benefits
- Proportion of unemployed receiving benefits
- Proportion of workers covered in case of employment injury
- Proportion of older persons receiving a pension
- Proportion of vulnerable persons receiving benefits
- Proportion of poor population receiving social assistance cash benefit
Compared to other countries, the Nordic countries have high levels of social protection coverage. For most groups, coverage rates reach 100%. However, there are notable exceptions, particularly concerning unemployment benefits and social assistance cash benefits for vulnerable groups.
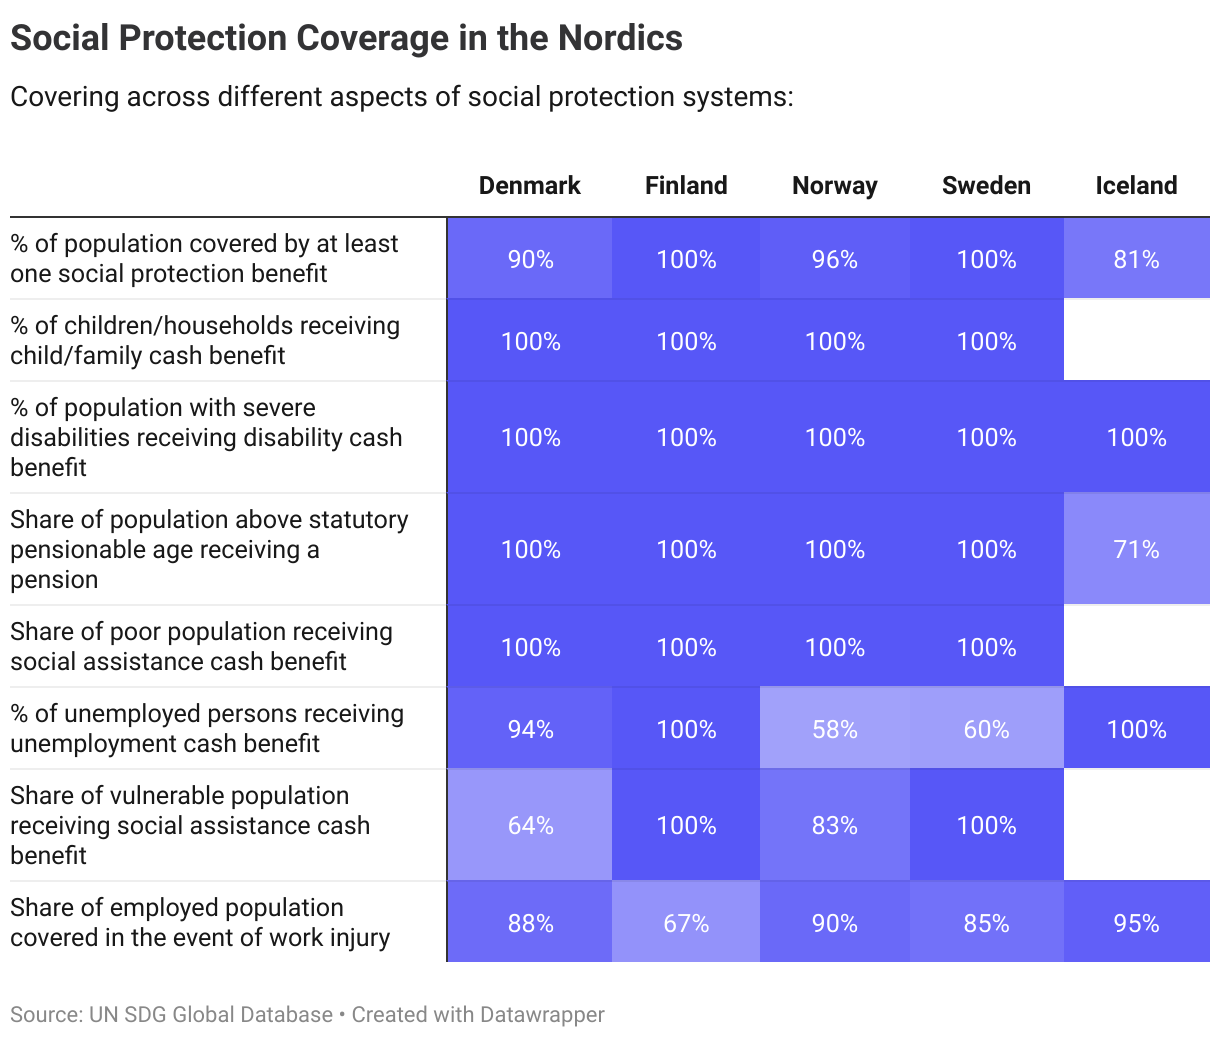
For 2030, the OECD has operationalised this target at 97% coverage rates (to allow for measurement errors) in OECD-countries. While some coverage gaps remain, the majority of indicators are already met (above 97%) for Denmark, Finland, Norway and Sweden. For Iceland, the majority of indicators where data is avaliable is within a short distance of the target level.
Denmark
Target is met
Finland
Target is met
Iceland
Short distance to target
Norway
Target is met
Sweden
Target is met
Target 1.4
By 2030, ensure that all men and women, in particular the poor and the vulnerable, have equal rights to economic resources, as well as access to basic services, ownership and control over land and other forms of property, inheritance, natural resources, appropriate new technology and financial services, including microfinance
| 1.4.1 | Proportion of population living in households with access to basic services |
| 1.4.2 | Proportion of total adult population with secure tenure rights to land, (a) with legally recognized documentation, and (b) who perceive their rights to land as secure, by sex and type of tenure |
Global trends
Access to basic services plays an indispensable role in efforts to alleviate poverty. For indicator 1.4.1, data is available at a global and regional level for the share of population with access to basic drinking water and sanitation services.
Over the past decades, there has been a notable global progression in expanding access to these vital services. Nevertheless, as of 2022, approximately 700 million individuals were without basic access to water services. Furthermore, 1.5 billion people lacked access to basic sanitation. To achieve universal access to safely managed sanitation by 2030, the current rates of progress would need to increase by three to six times according to the UN.
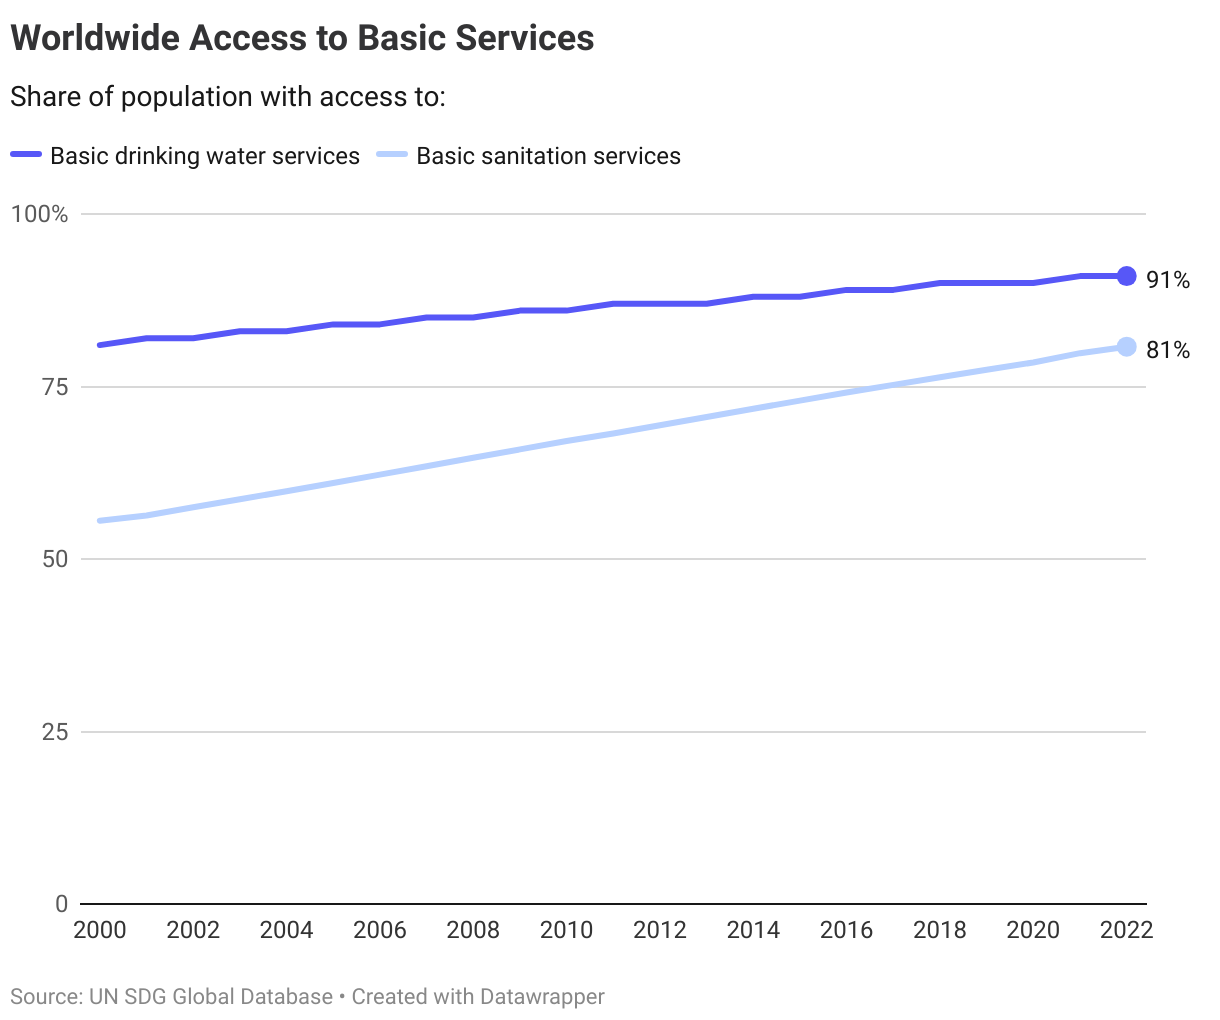
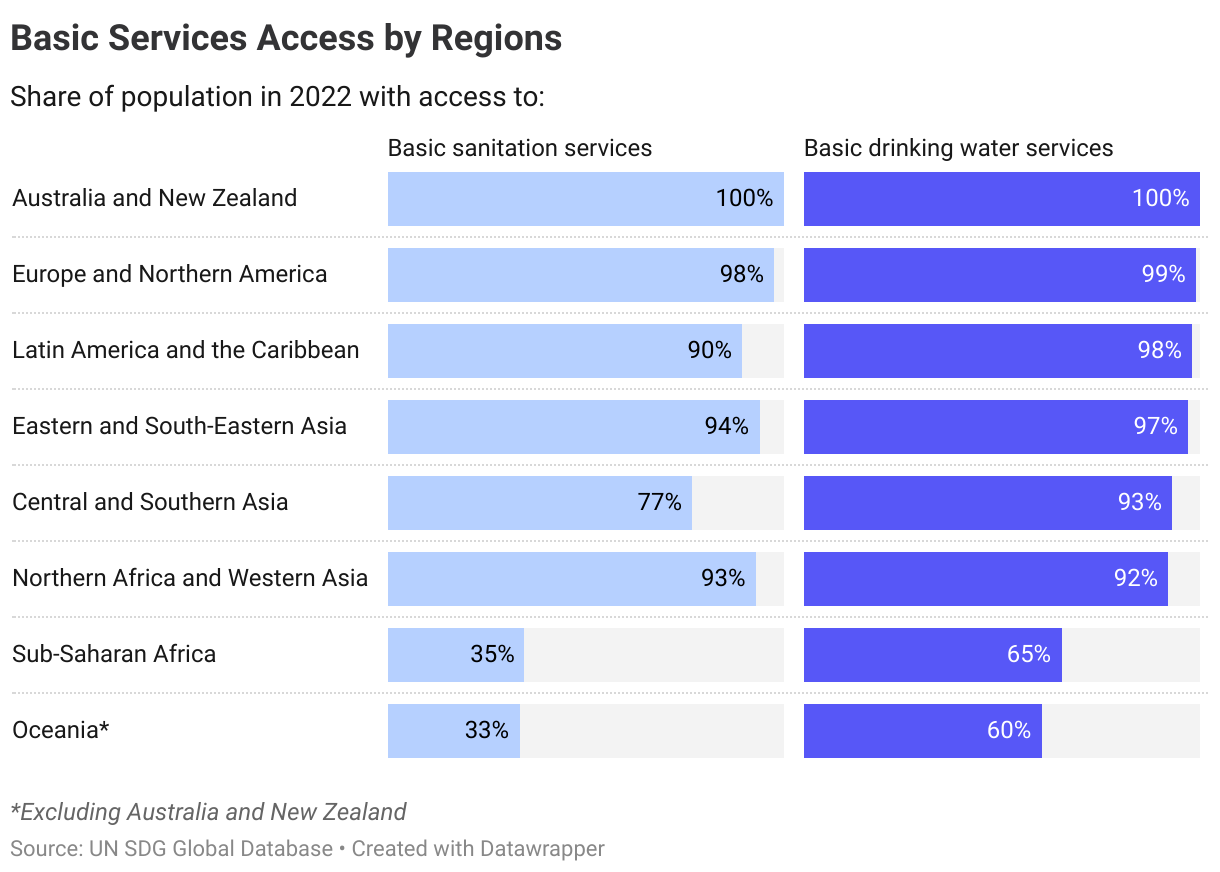
The majority of the population without access to basic services reside in Sub-Saharan Africa. In 2022, only 35% of the population in the region had access to basic sanitation services and 65% had access to basic water services.
In addition to water and sanitation, access to basic services also includes secure land and property rights for people (indicator 1.4.2). This is measured by the percentage of the adult population with secure land tenure rights, with legally recognized documentation, and who perceive their rights as secure, considering the gender and type of tenure. As of 2023, few countries had reported data on this measure, with more comprehensive data collection planned.
The Nordics
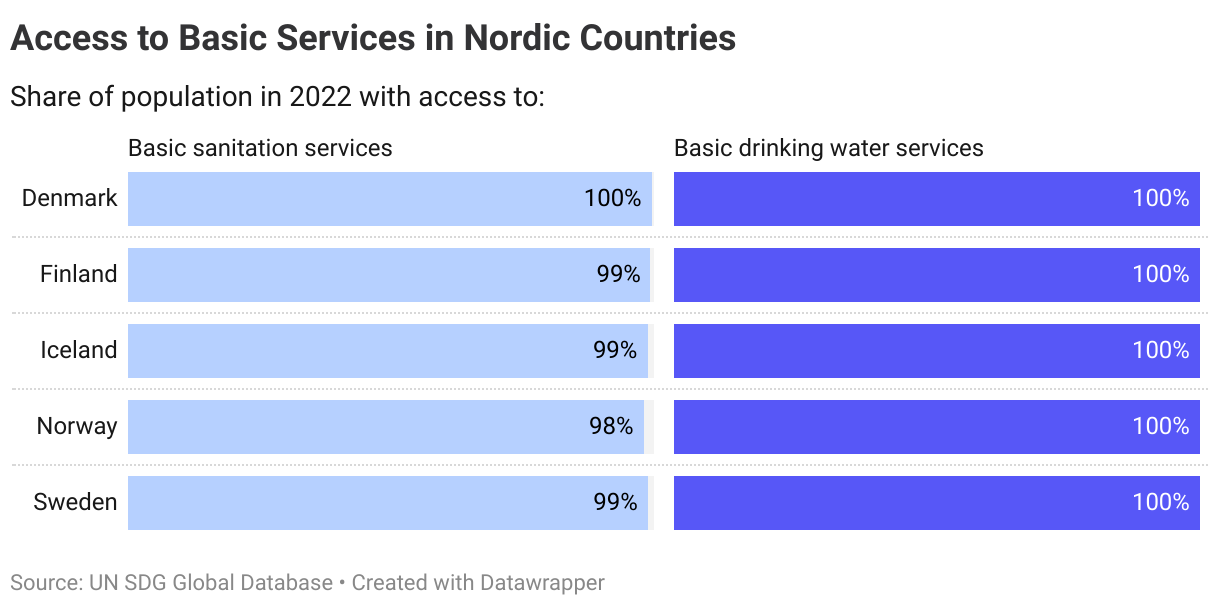
In the Nordic countries, as in other high-income nations, access to basic services is well-established and nearly universal. Consequently, the combined assessment for this indicator is that all Nordic countries have already met the target for 2030.
Denmark
Target is met
Finland
Target is met
Iceland
Target is met
Norway
Target is met
Sweden
Target is met
Target 1.5
By 2030, build the resilience of the poor and those in vulnerable situations and reduce their exposure and vulnerability to climate-related extreme events and other economic, social and environmental shocks and disasters
| 1.5.1 | Number of deaths, missing persons and directly affected persons attributed to disasters per 100,000 population |
| 1.5.2 | Direct economic loss attributed to disasters in relation to global gross domestic product (GDP) |
| 1.5.3 | Number of countries that adopt and implement national disaster risk reduction strategies in line with the Sendai Framework for Disaster Risk Reduction 2015–2030 |
| 1.5.4 | Proportion of local governments that adopt and implement local disaster risk reduction strategies in line with national disaster risk reduction strategies |
Global trends
Building resilience to disasters and shocks remains a key priority, particularly for the poor and vulnerable. The UN 2023 report highlights that globally, disaster-related mortality (indicator 1.5.1) has decreased from an average of 1.64 deaths or missing persons per 100,000 population in the 2005-2015 period to 0.86 during 2012-2021. However, Least Developed Countries (LDCs), Small Island Developing States (SIDS), and Land-locked Developing Countries (LLDCs) continue to bear a disproportionate brunt, with higher mortality rates of 1.24, 2.80, and 1.85 respectively. This trend in reduced mortality, unfortunately, doesn’t mirror the trend for those affected by disasters. The number of individuals directly affected from disasters rose from 1,198 per 100,000 during 2005-2015 to 2,113 during 2012-2021.
Importantly, as a biological hazard, COVID-19 related deaths are not included in the above numbers. As the UN said, the pandemic “is by far the single most global shock affecting disaster mortality during the SDG period”, causing an estimated 5.45 million deaths through the end of 2021.
Data is not available at a global or regional level for indicator 1.5.2 on economic losses due to disasters.
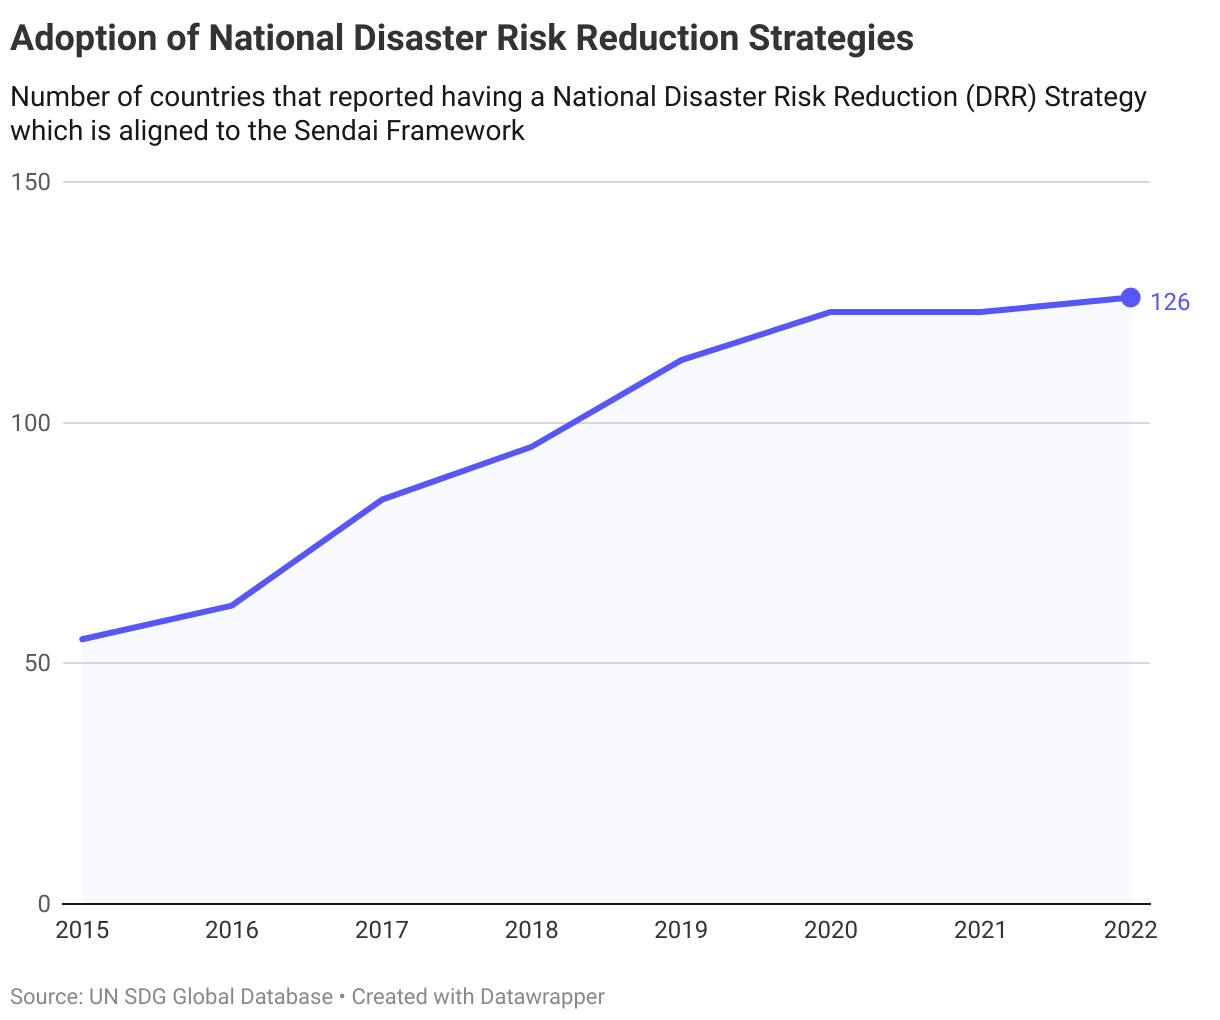
In the face of these challenges, it becomes increasingly crucial to adopt and implement national and local disaster risk reduction strategies to build resilience and reduce vulnerability (indicators 1.5.3 and 1.5.4). As of the end of 2022, 126 countries had implemented national disaster risk reduction strategies in accordance to the Sendai Framework for Disaster Risk Reduction. This is an increase from 55 countries in 2015. Out of the 126 countries adopting national-level strategies, 102 had also done so at local government levels.
The Nordics
For this target, we focus our assessment based on the implementation of risk reduction strategies (indicators 1.5.3 and 1.5.4), as the two other indicators are difficult to assess against a target level.
The latest data shows that only Finland and Norway have implemented risk reduction strategies in accordance with the Sendai Framework. Norway has a score of 0.98 for its level of implementation, measured on a scale from 0 to 1, with 1 being the highest. By comparison, Finland has a score of 0.75. In Finland, 100% of all local governments have implemented local strategies in line with the national strategy, while 98% of all local governments in Norway have done so.
The overall assessment on this target is therefore that Norway has met the target while Finland is at a short distance. The other countries, given that they have not reported any degree of implementation of risk reduction strategies, are classified as long distance to target and not progressing.
Denmark
Long distance to target, not progressing
Finland
Short distance to target
Iceland
Long distance to target, not progressing
Norway
Target is met
Sweden
Long distance to target, not progressing
Target 1.a
Ensure significant mobilization of resources from a variety of sources, including through enhanced development cooperation, in order to provide adequate and predictable means for developing countries, in particular least developed countries, to implement programmes and policies to end poverty in all its dimensions
| 1.a.1 | Total official development assistance grants from all donors that focus on poverty reduction as a share of the recipient country’s gross national income |
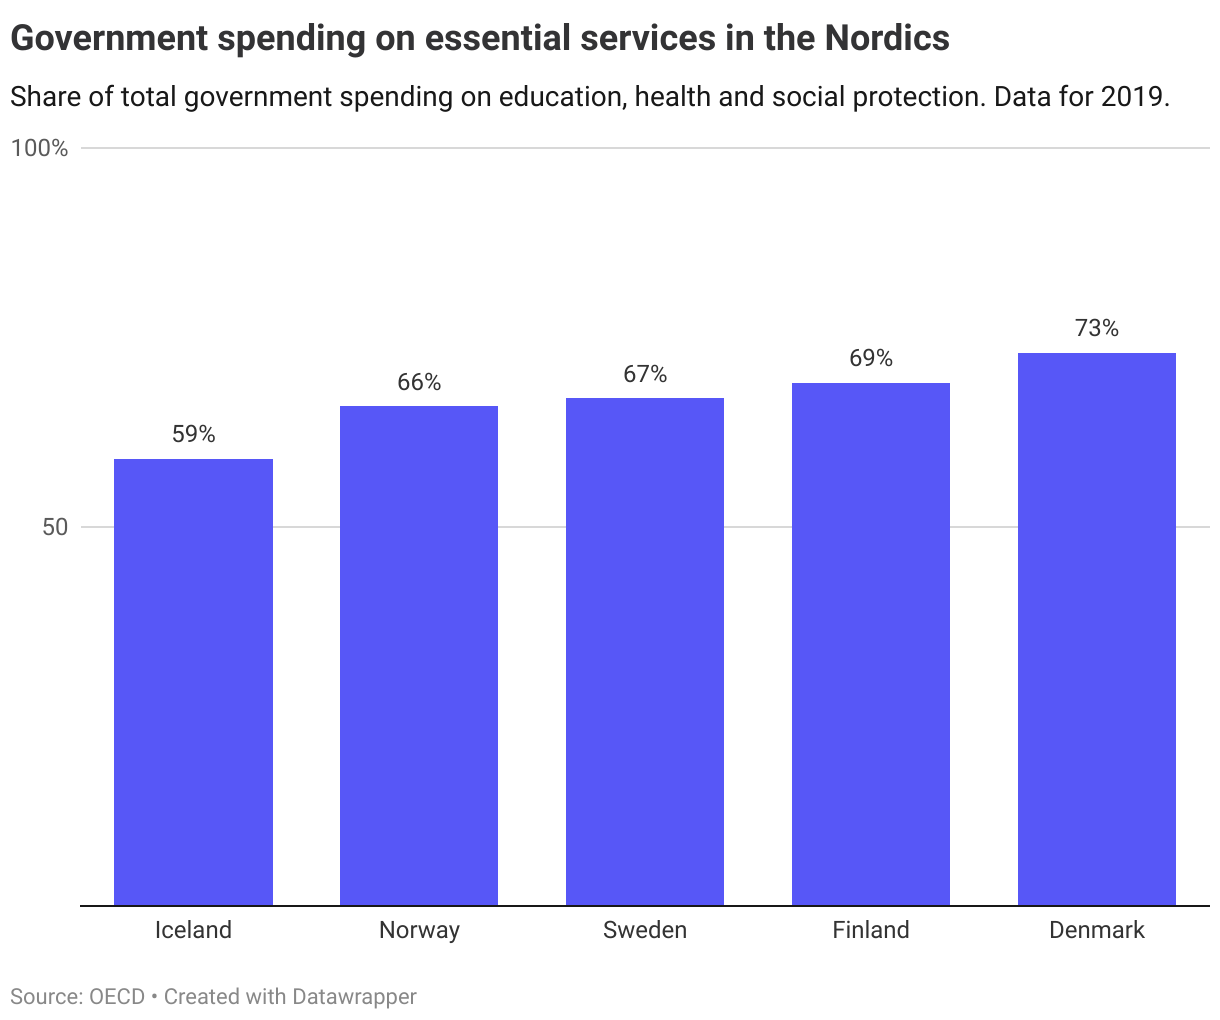
| 1.a.2 | Proportion of total government spending on essential services (education, health and social protection) |
Global trends
This target has both national and international components. Nationally, it examines the proportion of total government spending allocated to essential services, including education, health, and social protection. Internationally, it considers the share of development assistance focused on poverty reduction as a portion of the recipient country’s gross national income. It is challenging to measure progress globally for both aspects, and no specific benchmarks have been set for 2030.
The Nordics
Data on Nordic countries’ development assistance is available, but it is measured against the donor country’s gross national income (GNI) rather than the recipient’s. This data can still provide insight into the proportion of a donor country’s contribution to poverty reduction in comparison to their overall contribution to development assistance in other countries.
However, the data does not offer a clear picture of trends over time for the Nordics. The latest data from 2021 reveals that Norway had the highest contributions to poverty reduction among the Nordics, with poverty reduction assistance comprising 0.14% of Norway’s gross national income—an increase from 0.03% in 2000. All Nordic countries, except Finland, had a higher share of grants for poverty reduction than the global average of 0.02%.
Regarding the domestic component of government spending on essential services, such spending accounts for around two-thirds of all government spending in the Nordics. This is more or less in line with the OECD average (64% in 2019).
In line with the OECDs approach to the SDG targets on government spending and development assistance, we do not consider these suitable for assessment of progress against a set target, as these will depend on national circumstances and priorities. Note however, that while not captured in the SDG framework, the international community have set targets for levels of official development assistance.
Target 1.b
Create sound policy frameworks at the national, regional and international levels, based on pro-poor and gender-sensitive development strategies, to support accelerated investment in poverty eradication actions
| 1.b.1 | Pro-poor public social spending |
This target is currently planned for further development by UNICEF. Consequently, no assessment of global trends or progress in the Nordic countries is provided at this point in time.