

The purpose of this data tracker is to look at how the Nordic countries – Denmark, Finland, Iceland, Norway and Sweden – are progressing towards achieving the 17 Sustainable Development Goals by 2030.
Using the latest official data for the different targets, the tracker first explores global trends and then zoom in on the Nordic countries to assess their current distance from the target based on recent data and their likelihood of achieving it by 2030. Note that the analysis is currently work in progress as of early 2024.
The assessment of progress follows the methodology developed by the Organisation for Economic Co-operation and Development (OECD) for monitoring country level progress towards the SDGs. Note that while we adhere to the OECD methodology, the OECD is not affiliated with the analysis and calculations presented here.
Classification of progress
The Nordic countries are classified into one of five categories for each target:
Met: The country has already met the 2030 target.
On track: The country has not yet met the target but is on track to do so by 2030.
Short distance: The country has not met the target and is not projected to do so but is close to achieving it. This category also applies when the country currently meets the target but is projected to move away from it.
Long distance but progressing: The country is far from the target but is making progress towards it.
Long distance and not progressing: The country is far from the target and is not making progress towards reaching it.
Target levels in 2030
If the UN’s SDG framework does not explicitly set target levels for 2030, the analysis follows the target end-values chosen by the OECD as relevant for OECD countries, following either the level achieved by the best performing countries in the OECD or with reference to international agreements.
Distance to target
A country’s distance from target is measured as the standardised difference between the current level and the target level. The standardised measurement unit, following the OECD’s methodology, is the standard deviation observed in 2015 (or the closest year to 2015) across OECD-countries with available data. A short distance is defined as less than 0.5 OECD-standardised units away, and a long distance is more than 0.5 units away.
Trend assessment
Historical data for a country is analyzed to check for a clear increasing or decreasing trend. This is done by calculating the Spearman rank correlation coefficient between observed data and time. A coefficient greater than +0.2 and significant at the 10% level indicates a clear increasing trend, while a coefficient less than -0.2 and significant at the 10% level indicates a clear decreasing trend. No assessment is made unless a minimum of three years of data within a five-year period is available for a country on a specific indicator. Identification of a clear increasing or clear decreasing (depending on the target) trend is necessary for a country to be categorised as “On track” or “Long distance by progressing”.
Likelihood of reaching target in 2030
A country’s likelihood of reaching a target level in 2030 is modelled using Monte Carlo simulations. This approach entails taking into account past historical trends to generate a distribution of future trajectories using random variations of yearly growth rates. For each target we model 10,000 simulated projections for each country. If over 75% of these projections reach the target level in 2030, a country is classified as having a high likelihood of reaching the target level. If less than 75% of these projections reach the target level in 2030, a country is classified as having a low likelihood of reaching the target level.
Analysis under development
Please note that this analysis is continually evolving. We monitor for new data daily from the UN and OECD databases, and when new data is released for a target we update the country assessment accordingly. We are also continually working to improve the methodology. As a result, the text and visualisations may change at any time. Consult the changelog at the end of the page for details on revisions and updates.
Overall assessment of progress
Our latest analysis, updated in October 2023, show that Norway currently has the most targets met, followed by Denmark, Finland, Sweden and Iceland. If we include targets that are “on track” – not yet reached but likely to be so by 2030 – the ranking stays the same. Still, the overall picture is that the Nordics, in particular Norway, Denmark, Finland and Sweden, are close in their current performance.
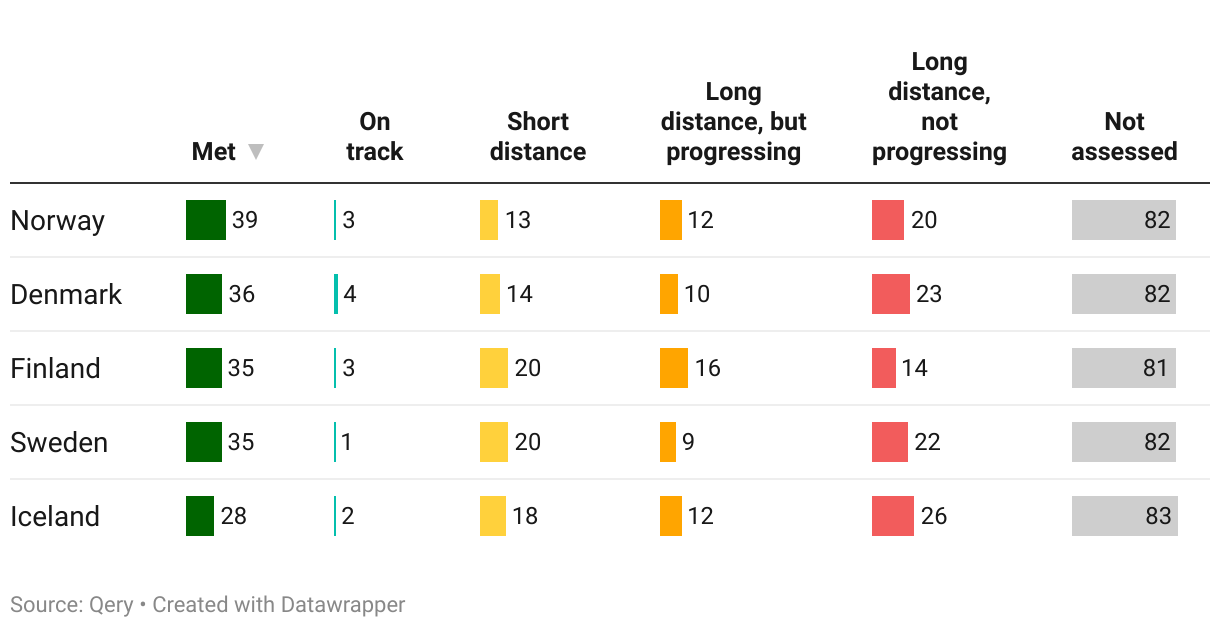
As can be seen from the table above, a significant share of the 169 targets across the 17 goals cannot be assessed, either due to data availability or lack of a set target to gauge progress against. This is a challenge the Nordics share with other countries across the world, however in recent years data availability on the SDGs has increased significantly, as highlighted by the UN in the 2023 SDG progress report.
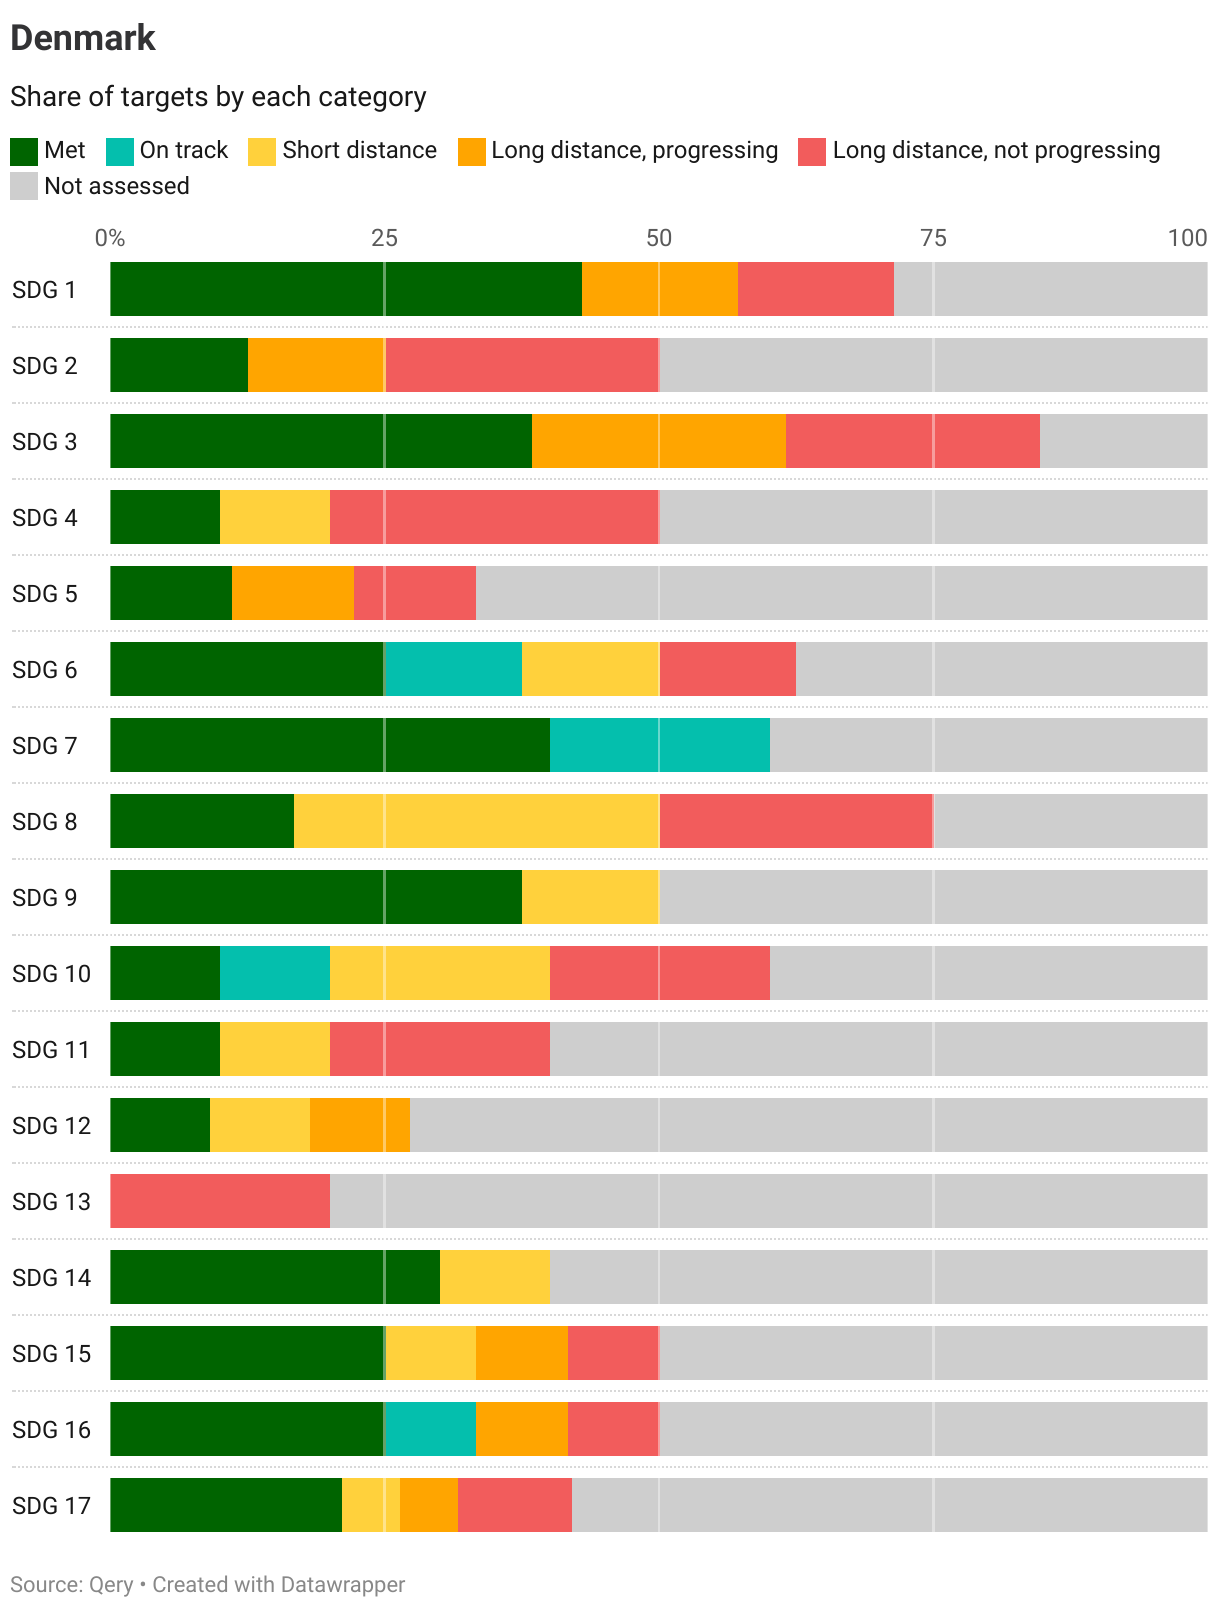
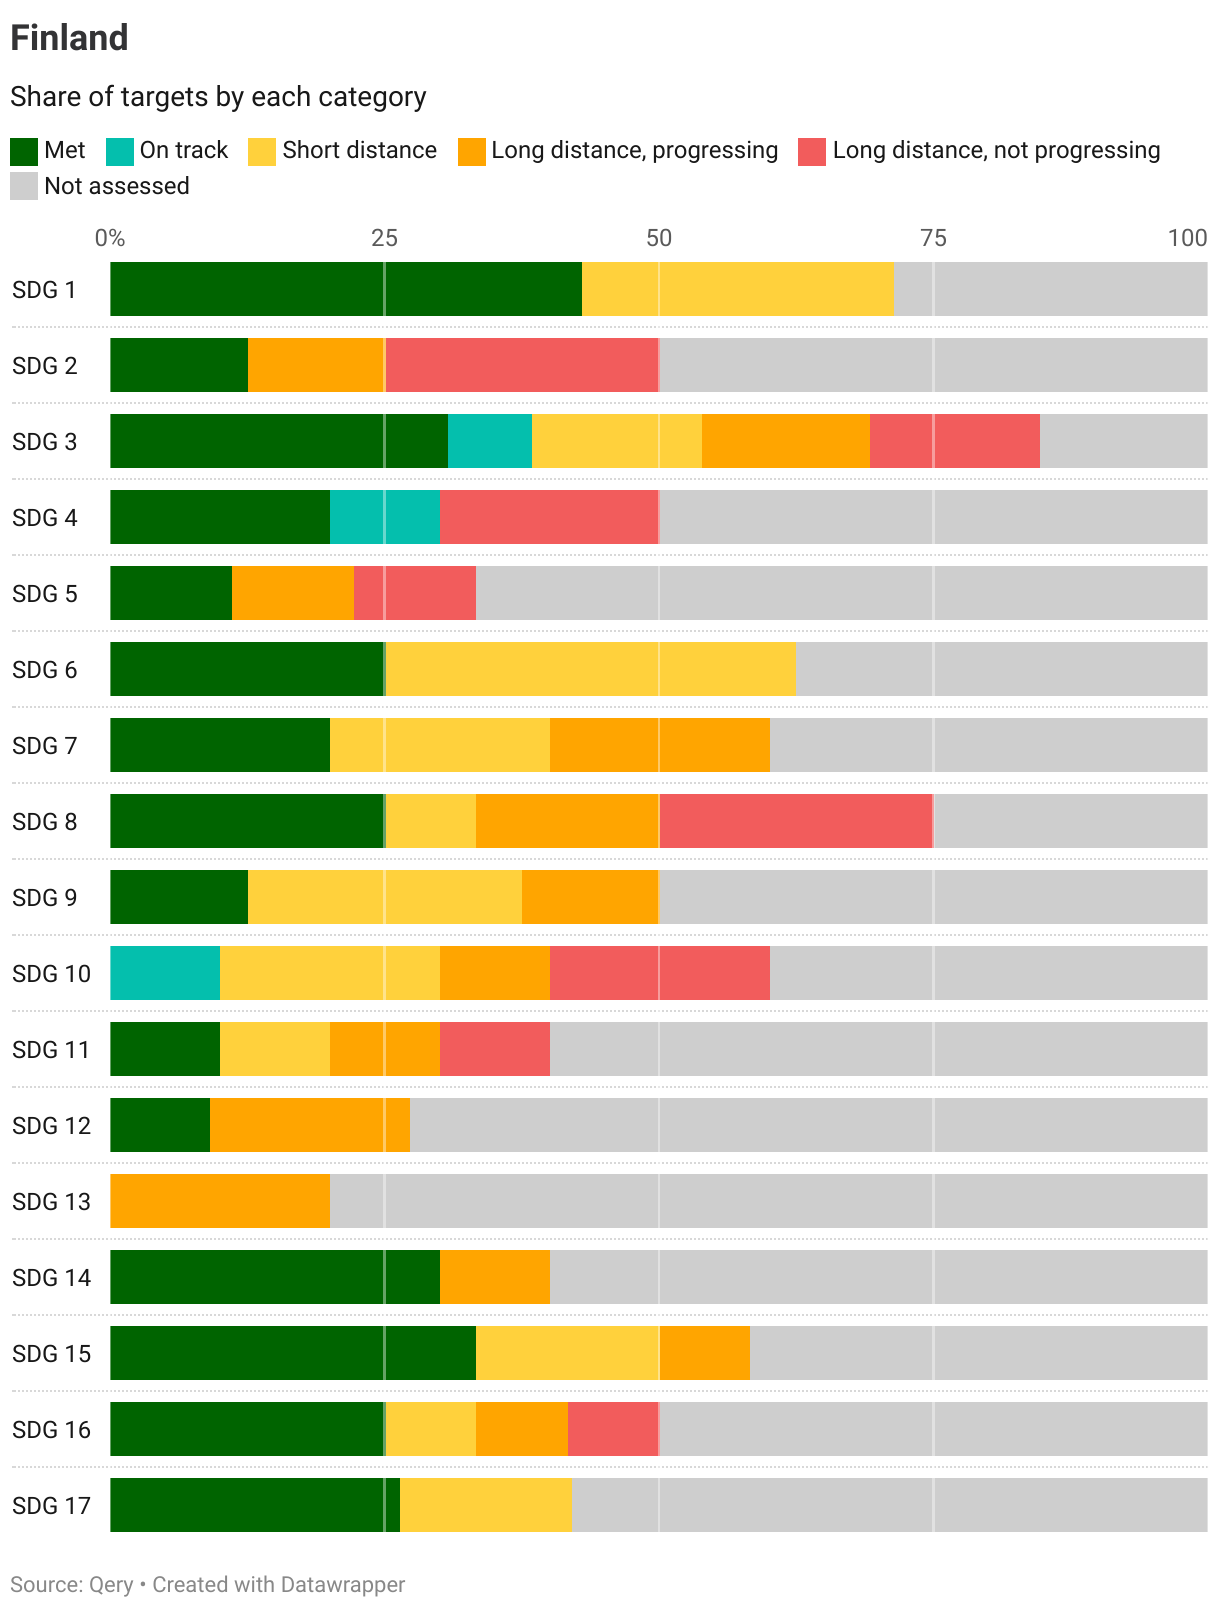
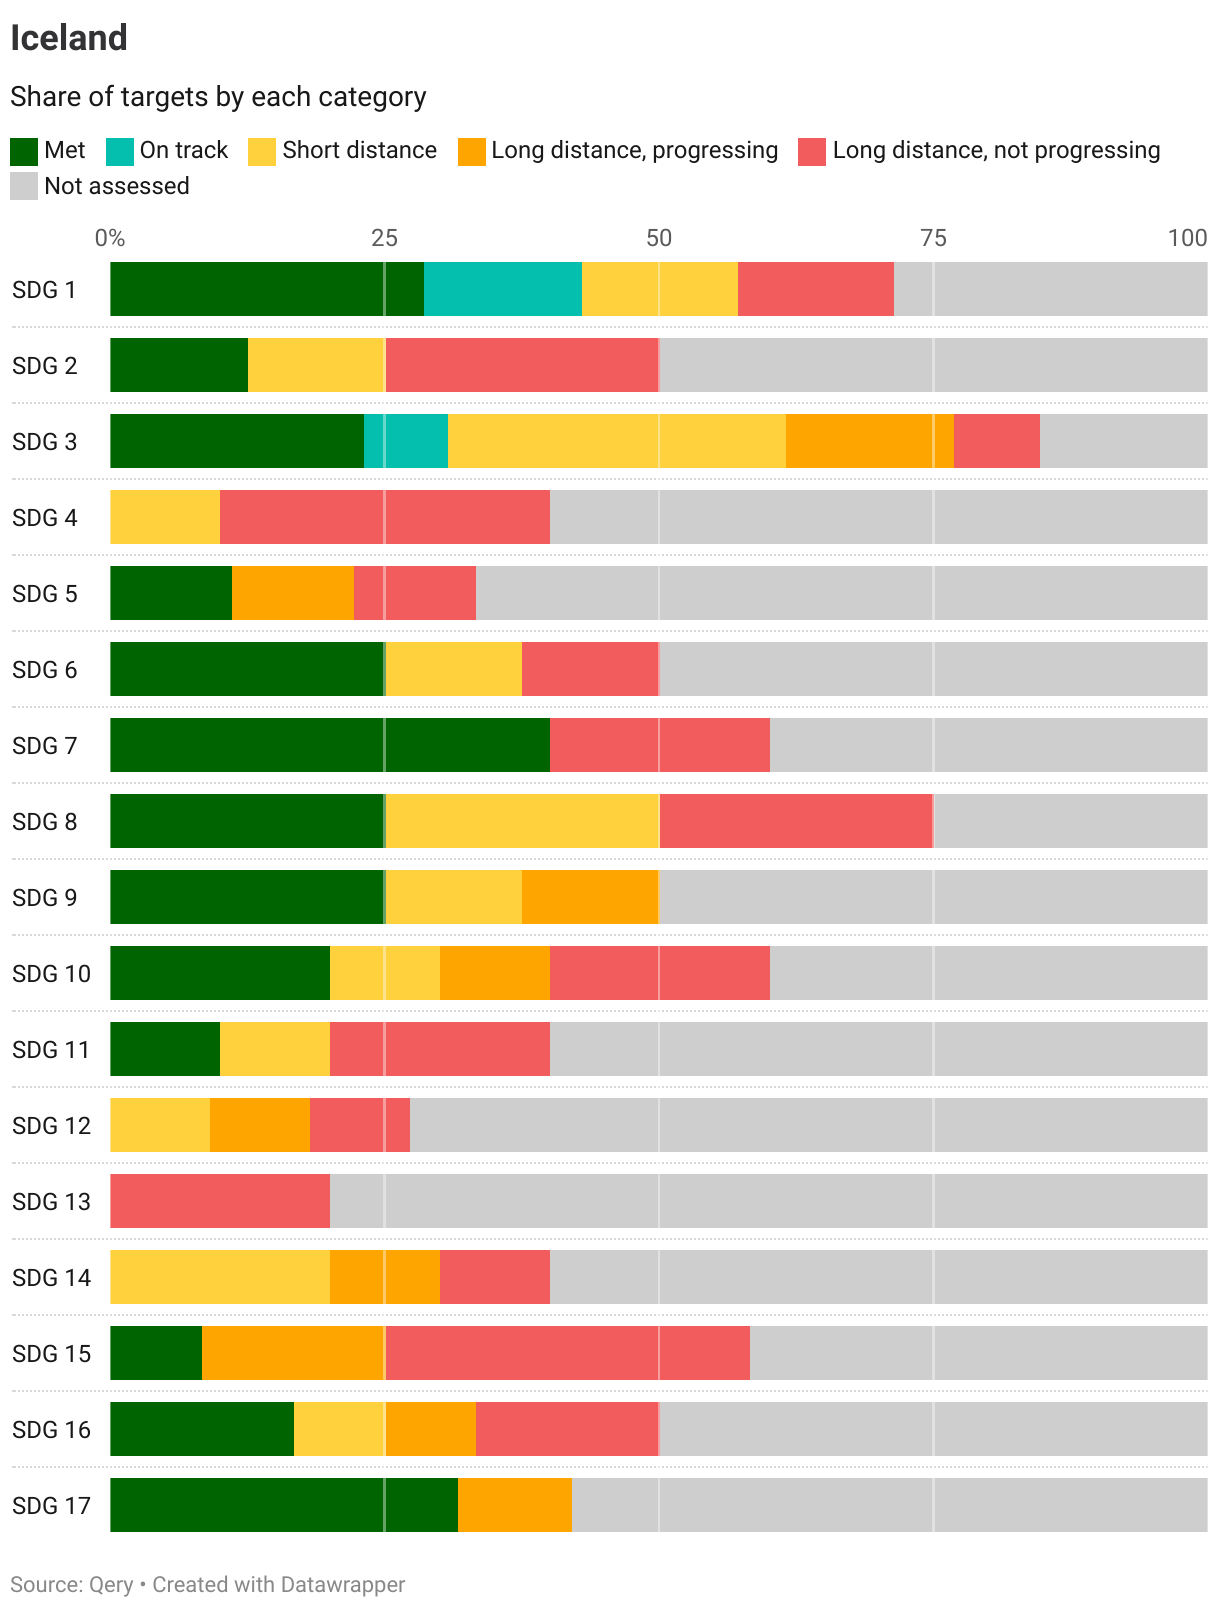
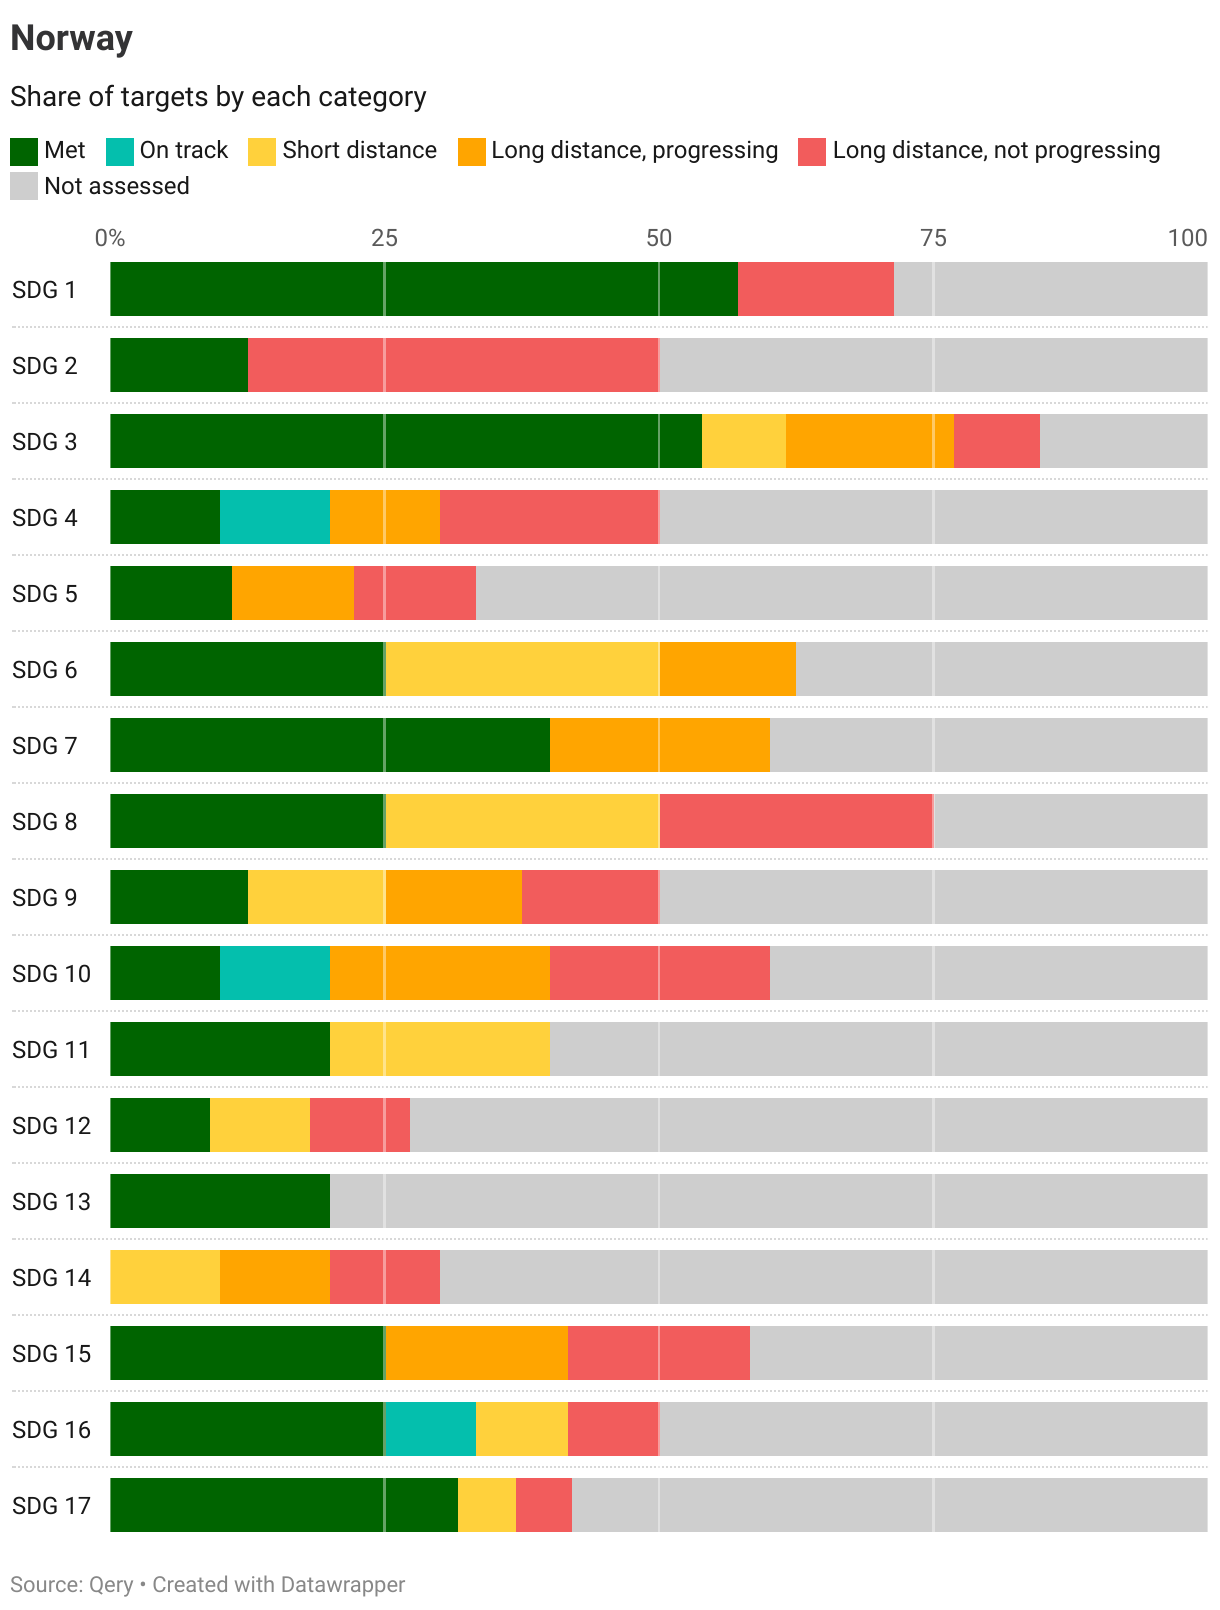
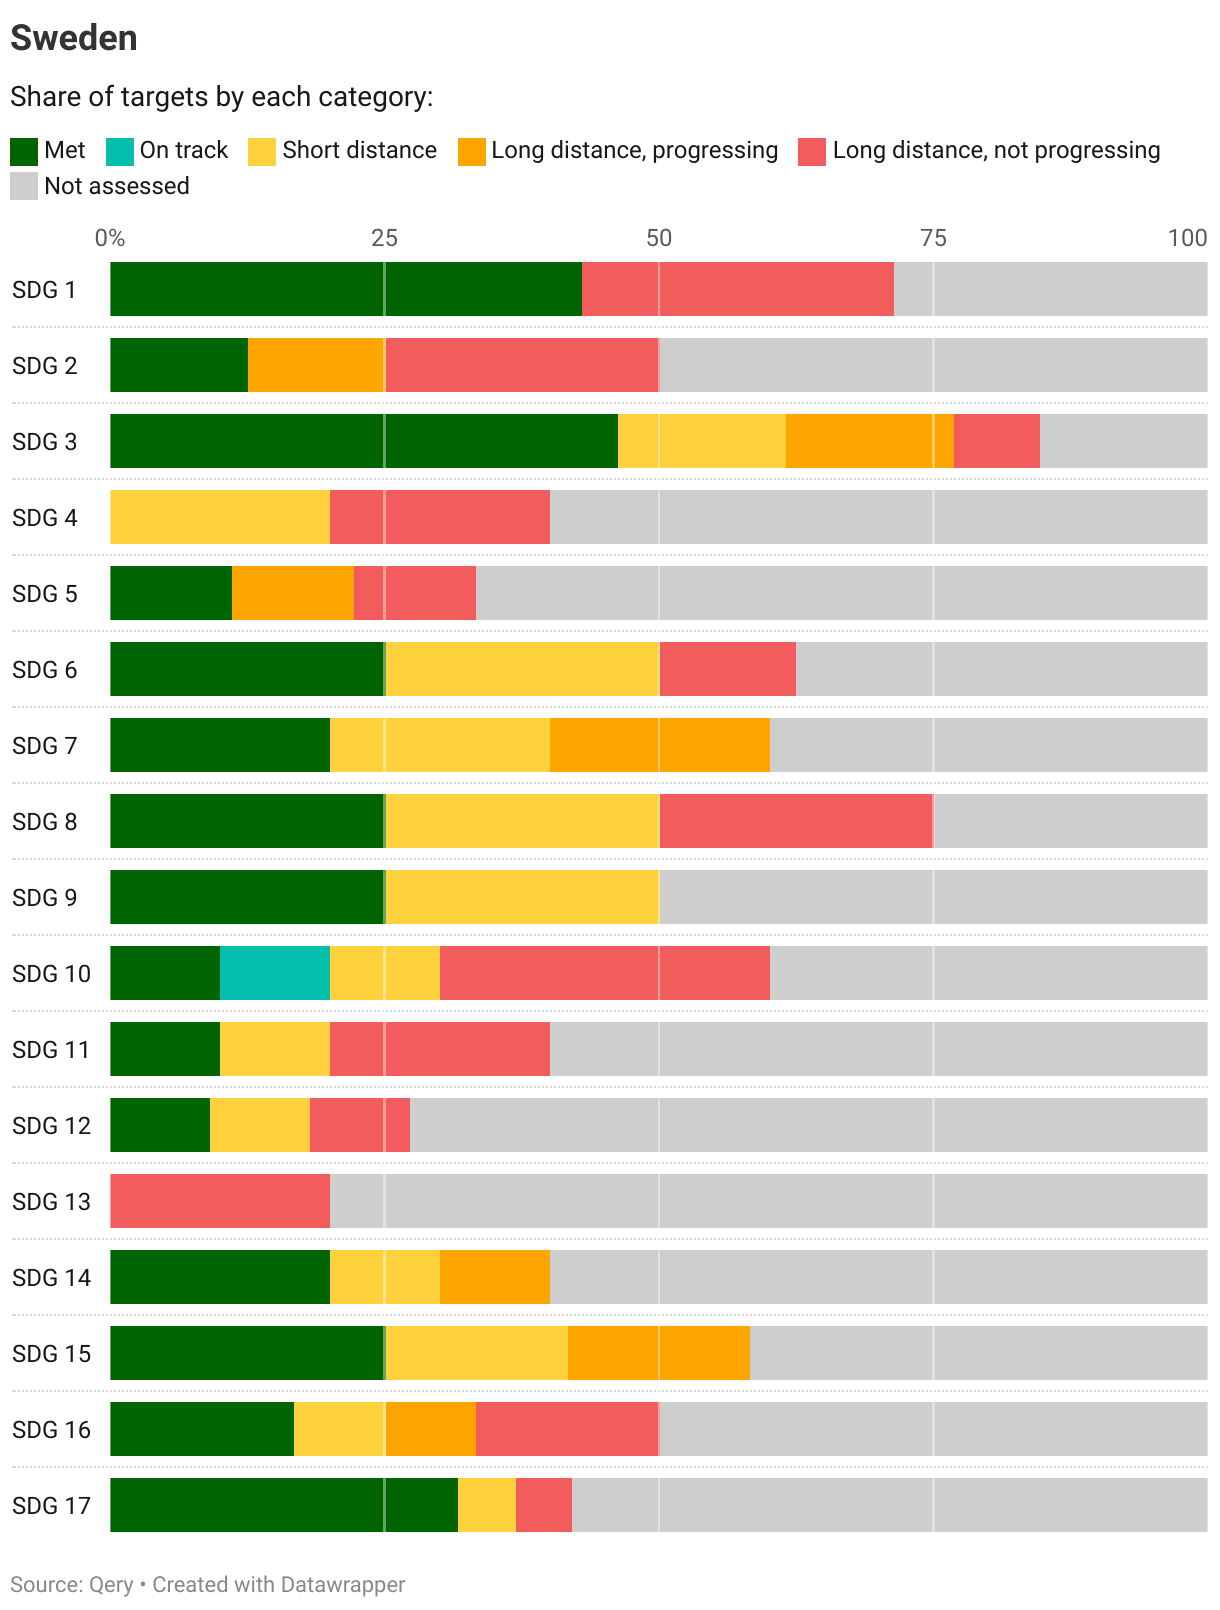
As can be seen from the detailed breakdown below showing the share of targets by each category, there are unassessed targets in each goal. Among those with most assessed targets are SDG 1,2,3,4,6,7,8,10,15 and 16.
On average across the Nordics, SDG 1 (Poverty) and SDG 3 (Health) are the ones with the highest share of targets that are met.
Explore the 17 goals
To explore the analysis further, each of the 17 goals has a dedicated page with detailed assessments for the individual targets. These can be accessed via the links below:
About the data
The data presented on global, regional, and national trends are from the UN SDG Global Database and the OECD unless otherwise stated.
Terms of use
Qery supports the Sustainable Development Goals.