

Global Overview
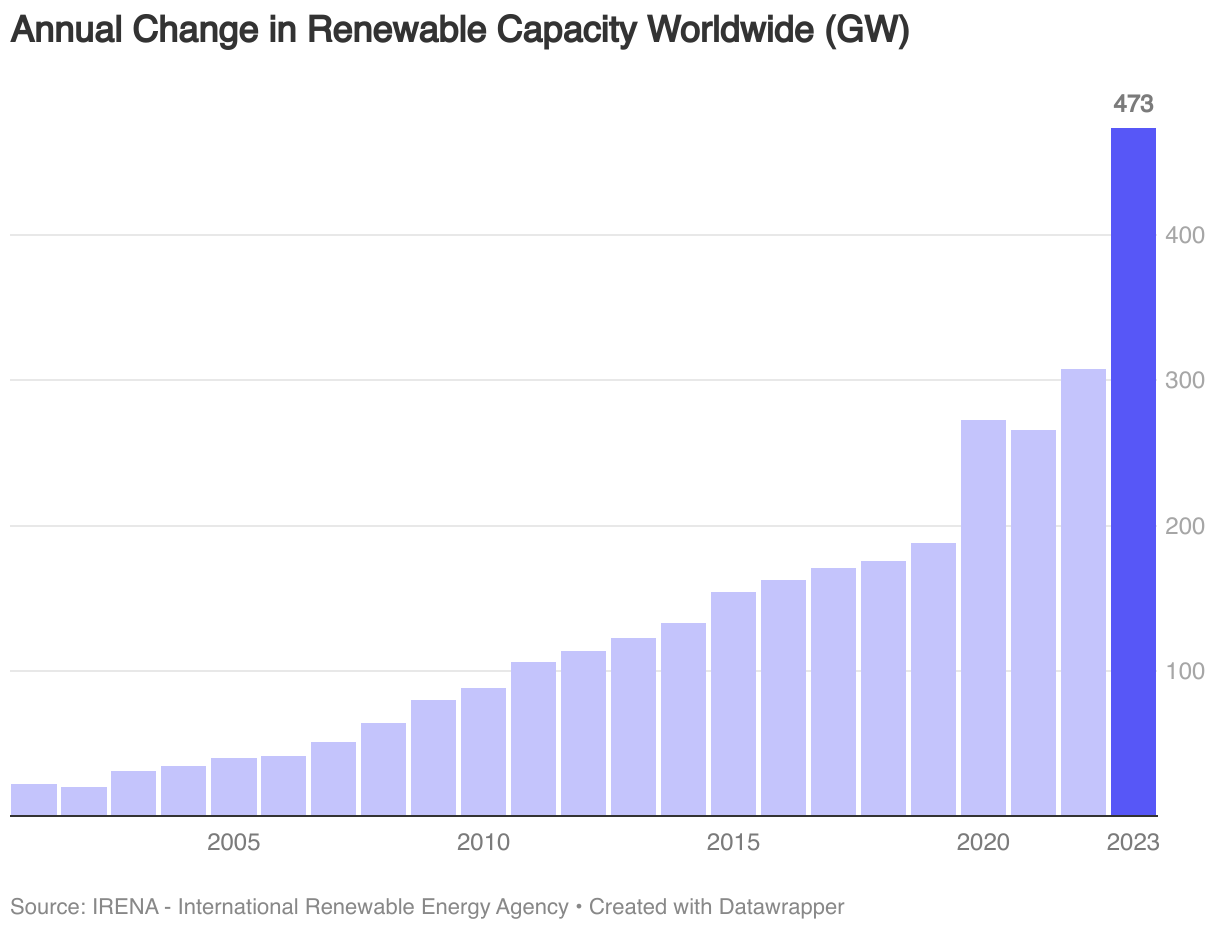
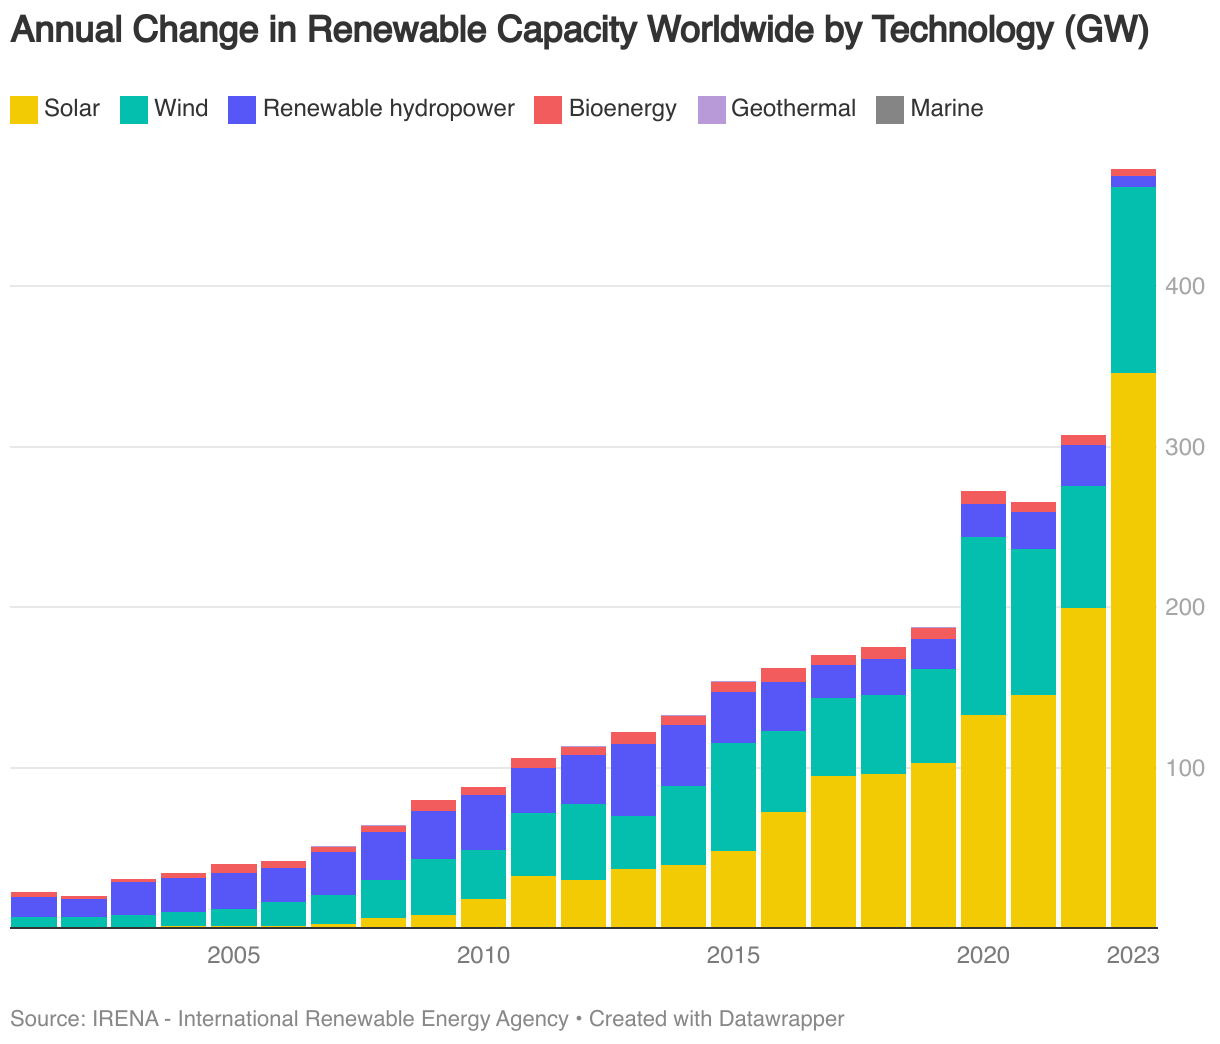
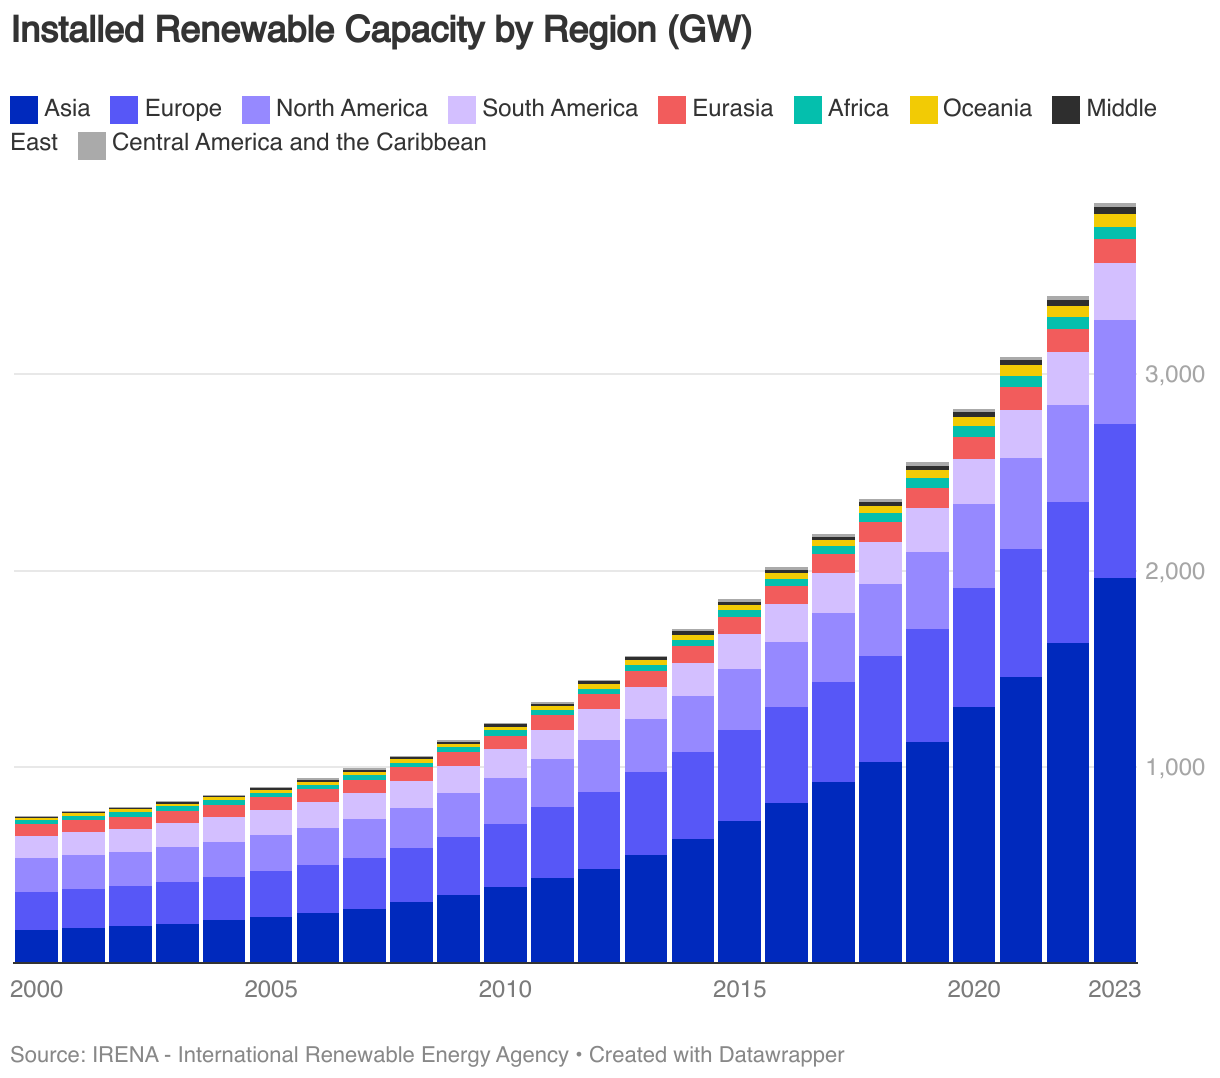
Data from the International Renewable Energy Agency (IRENA) shows that in 2023, global renewable energy capacity reached an all-time high of 3870 gigawatts (GW). This is an increase of 473 GW from 2022, marking the largest yearly growth on record.
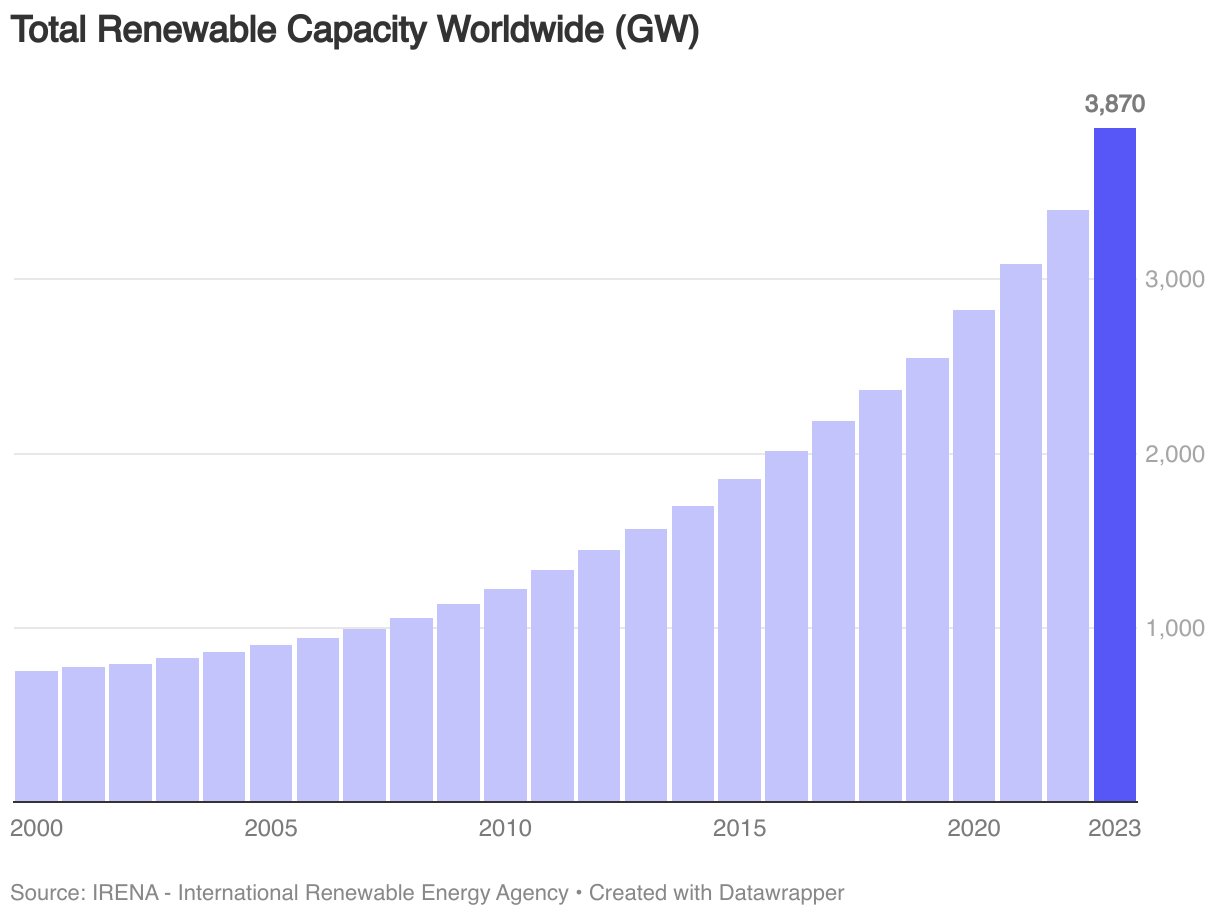
The marked growth highlights the global pivot towards more sustainable energy resources. In 2023, renewable energy contributed to over 43% of the global electric capacity, up from 40% in 2022.
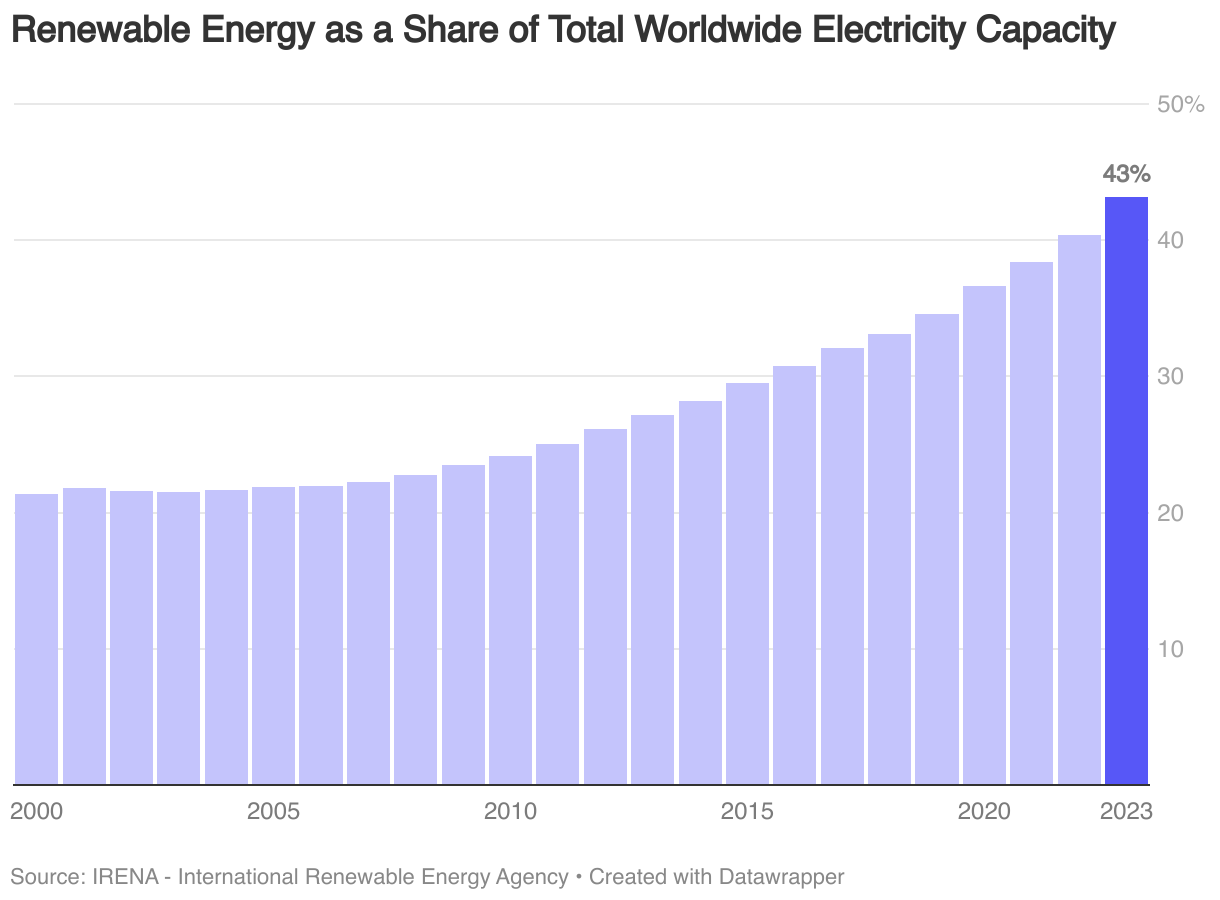
IRENA reports that renewable sources accounted for 86% of all newly added power capacity globally in 2023.
Main Technologies
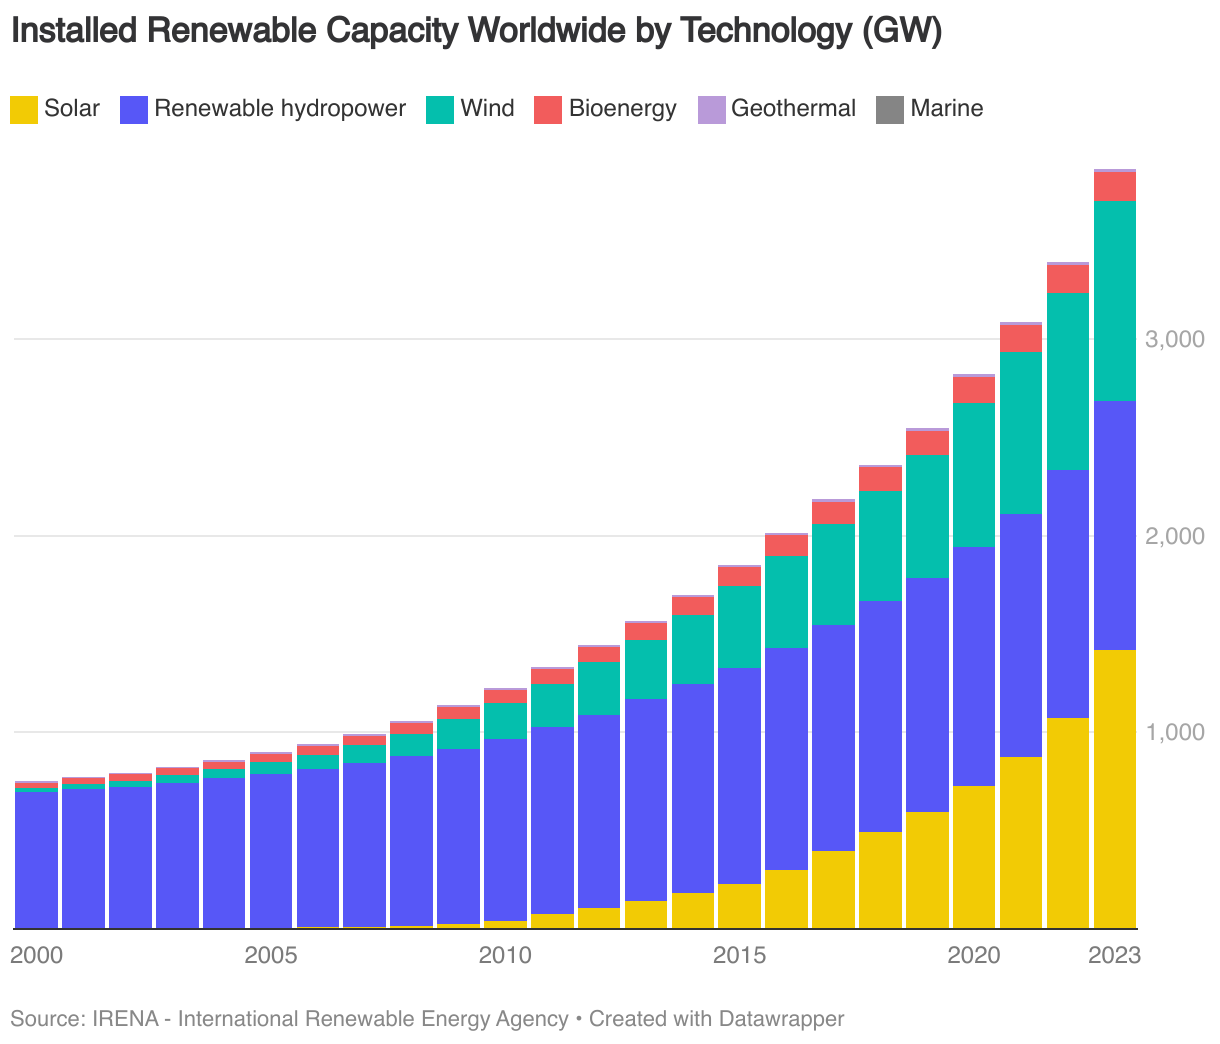
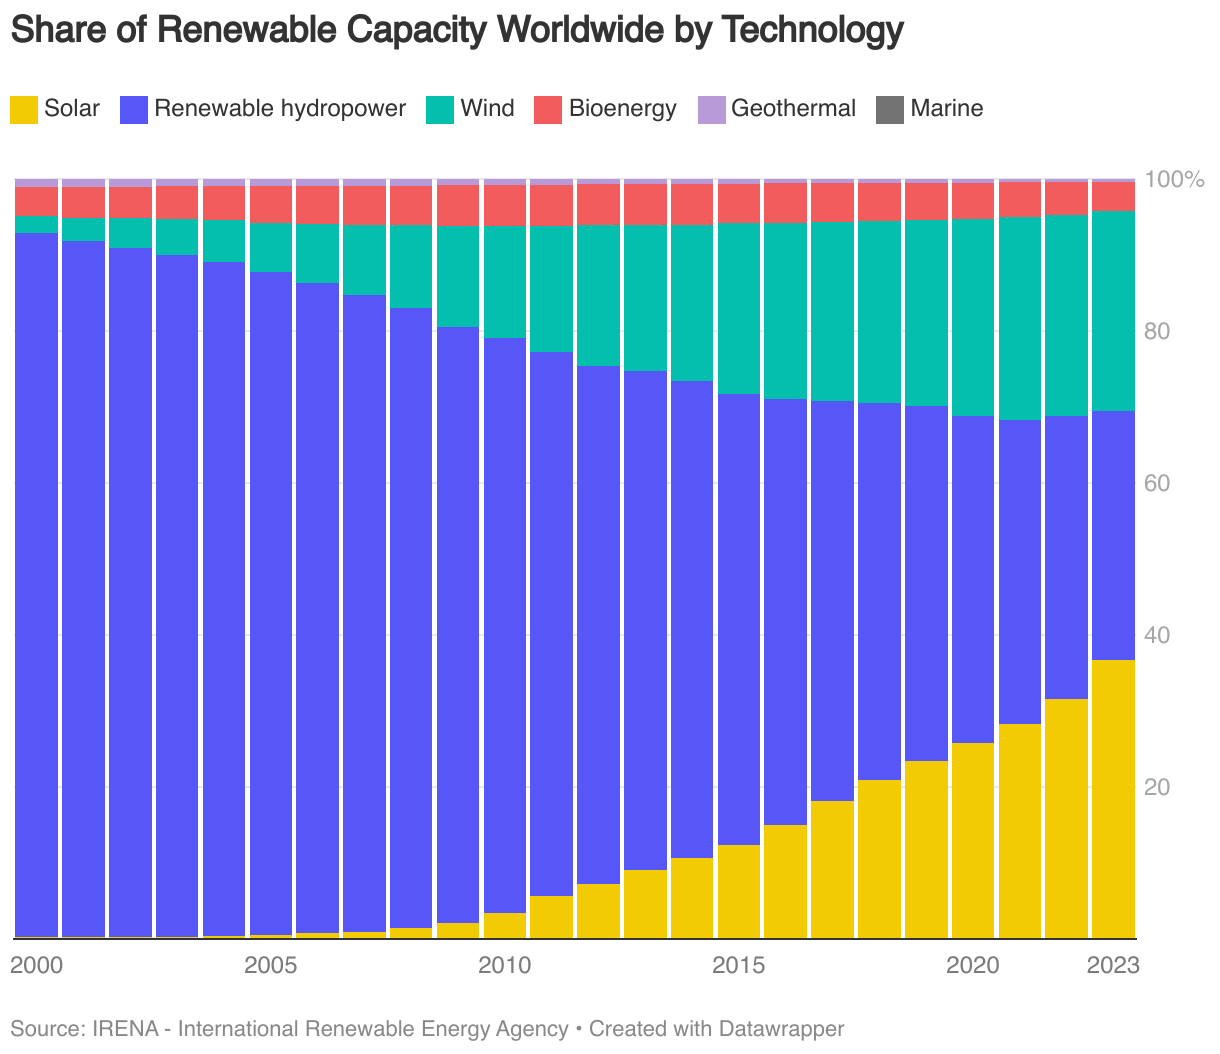
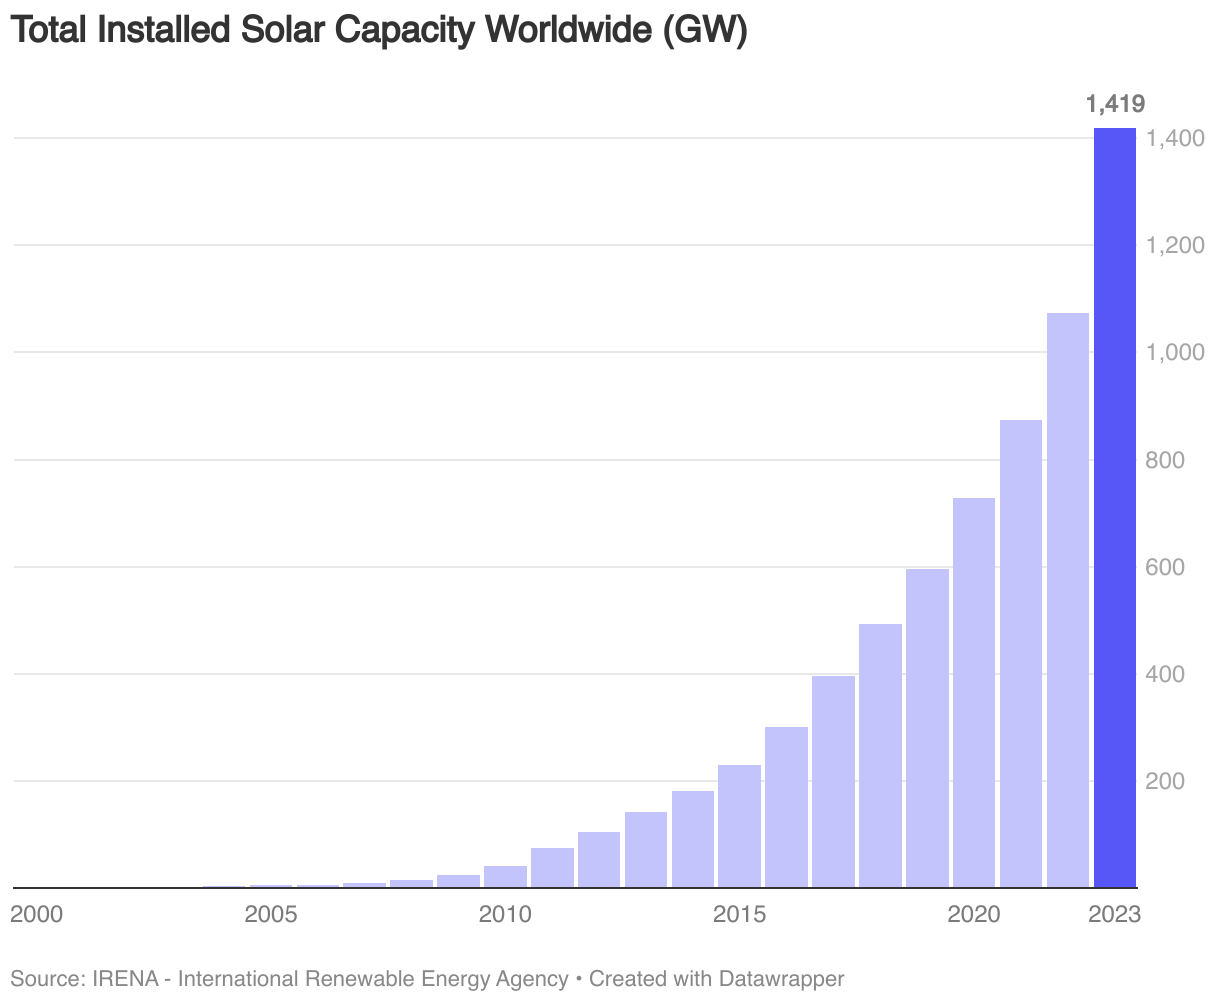
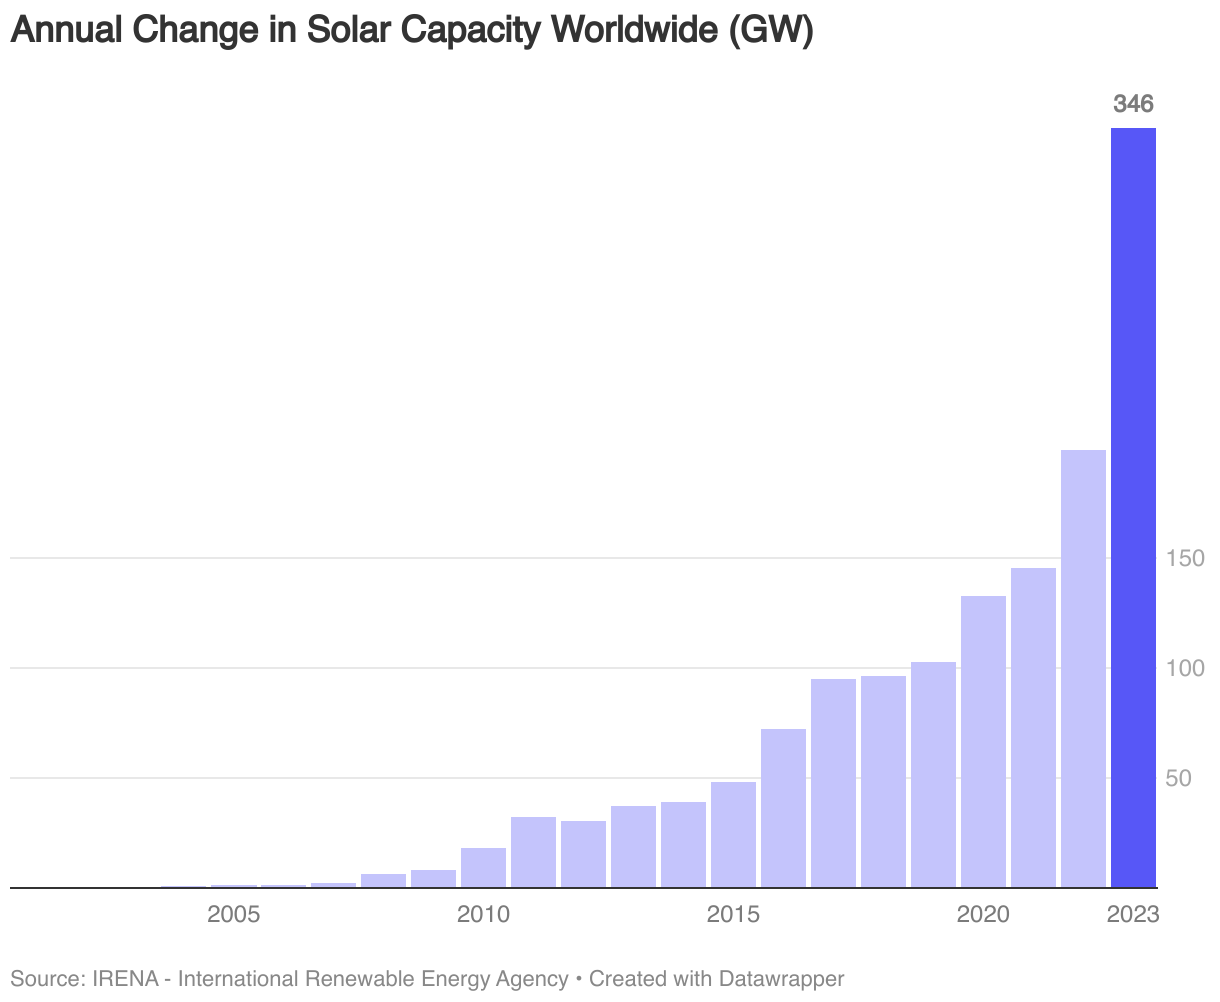
In 2023, solar overtook renewable hydropower as the largest source of renewable energy capacity globally (1419 GW). In 2000, renewable hydropower represented 93% of worldwide renewable capacity. By 2023, its share decreased to 33%, primarily due to the accelerated growth of solar and wind technologies. In the past few years, solar has been the fastest growing renewable technology in terms of annual capacity added. 2023 was another record year for solar, adding 346 GW to global capacity, standing for over 70% of all new renewable capacity added that year.
Key Nations and Regions
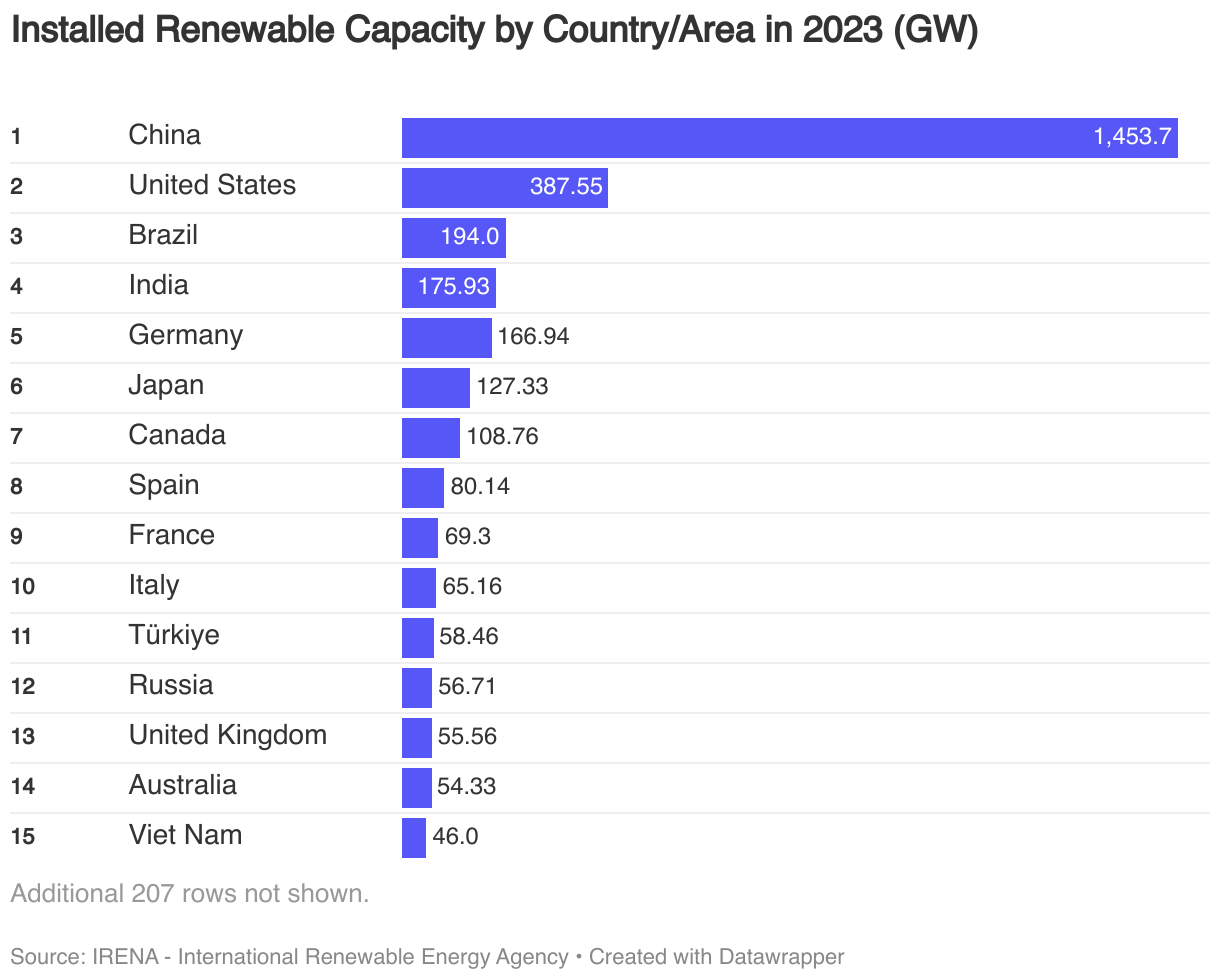
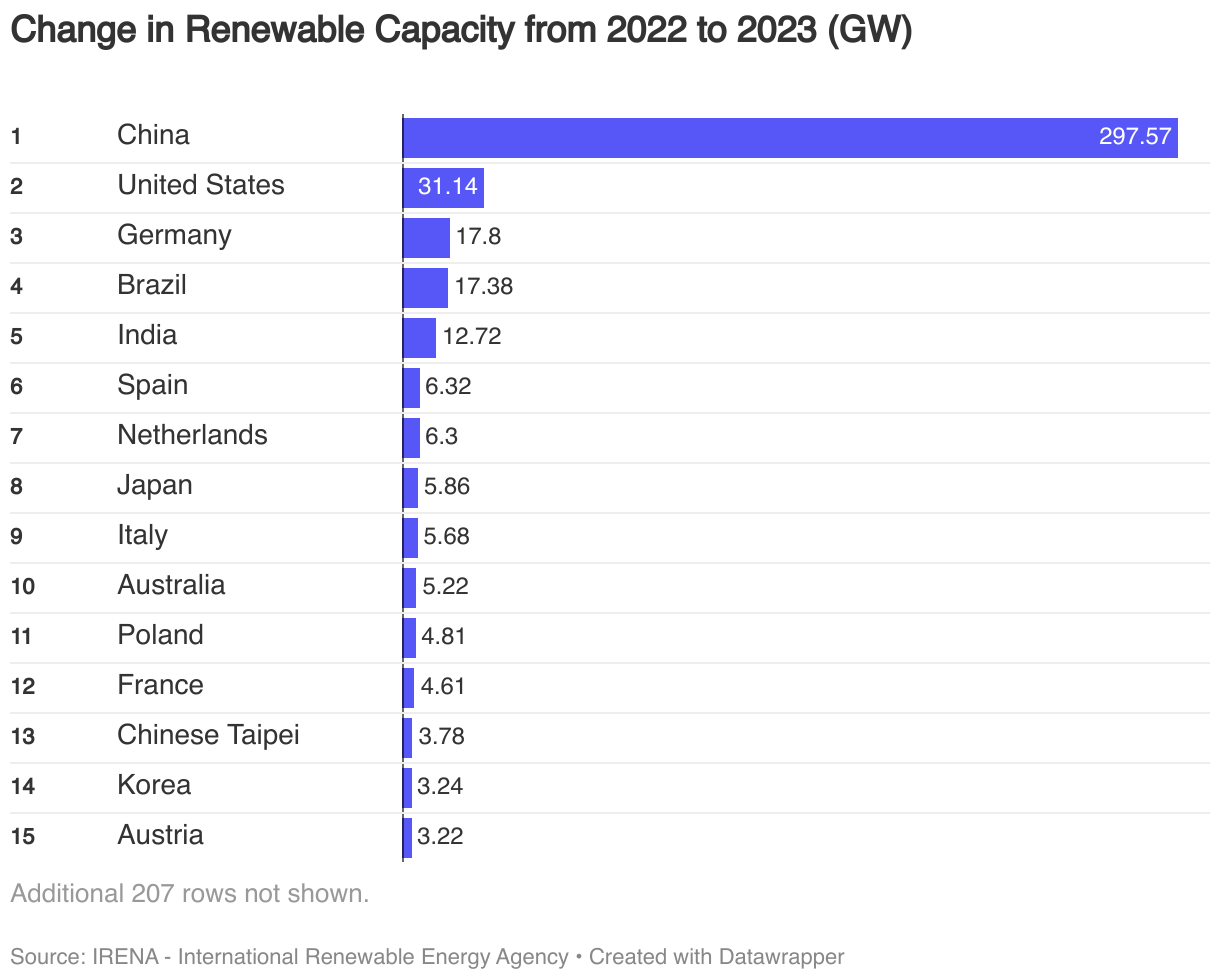
In 2023 China had the largest renewable capacity installed at 1454 GW, significantly ahead of other countries. China also led in terms of new capacity added in 2023. Its addition of 298 GW constituted over 60% of the total global added capacity for that year, and almost ten times more than the United States which added 31 GW during 2023.
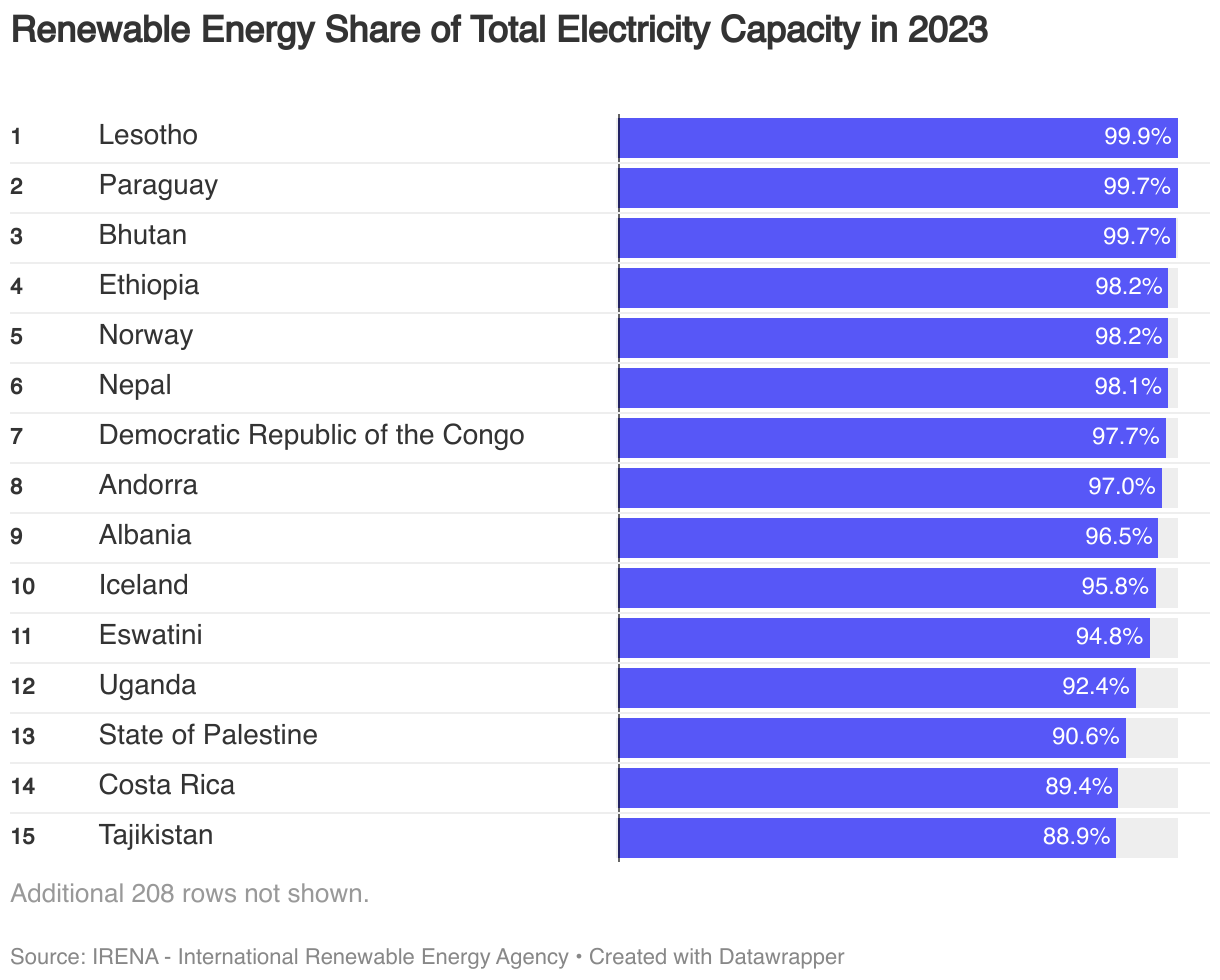
Despite China’s dominance in absolute renewable capacity, only 50% of its overall electric capacity are from renewable sources in 2023. Lesotho, Paraguay and Bhutan have more than 99% of their total electricity capacity coming from renewables.
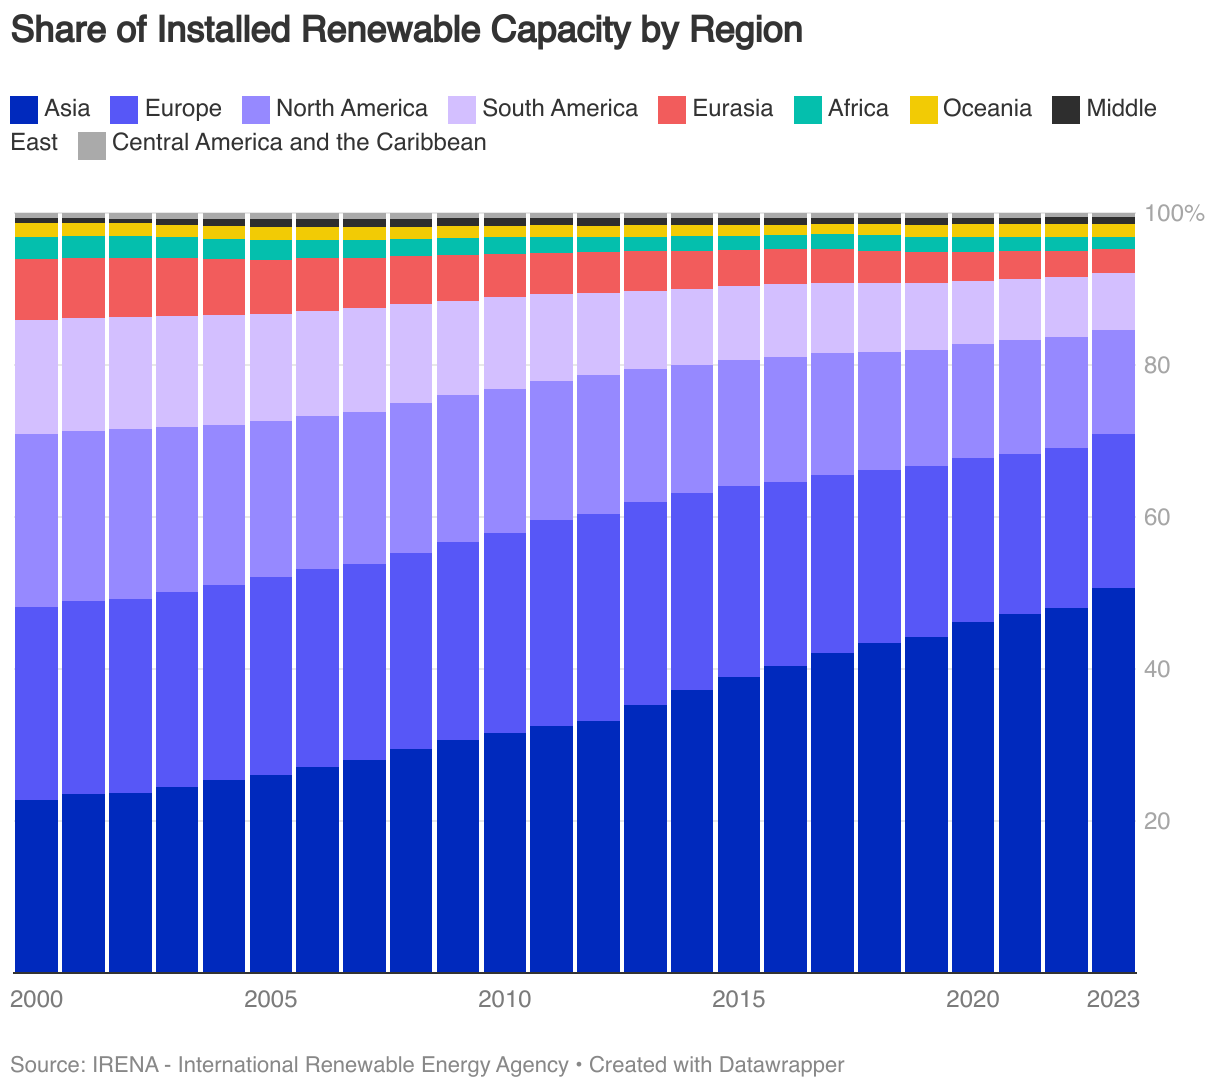
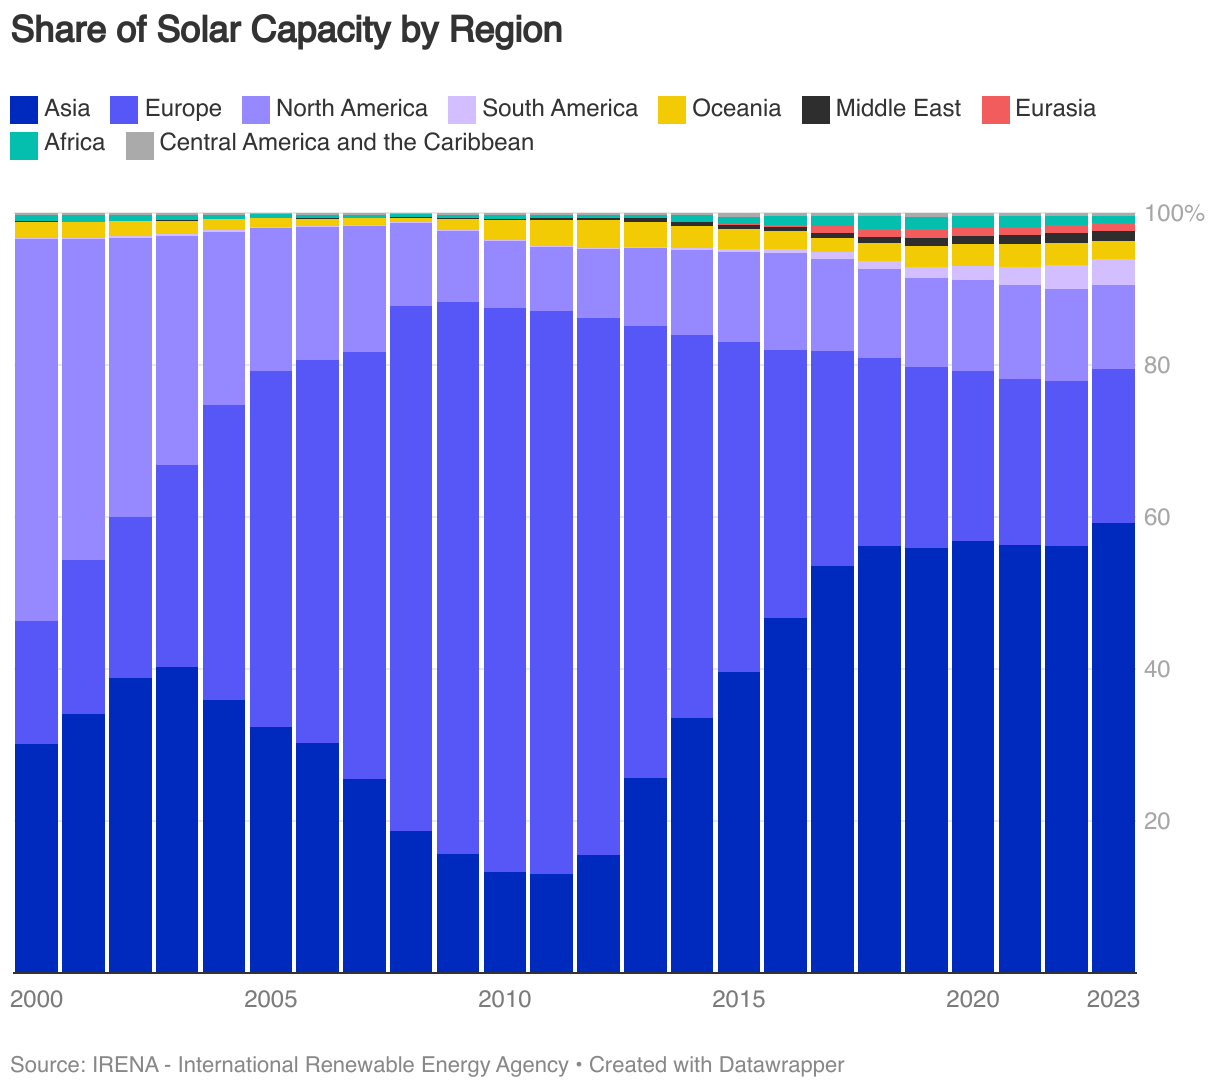
Asia accounted for nearly half of the world’s total renewable capacity (1961 GW) in 2023, followed by Europe and North America. Asia’s share of global capacity has been increasing over the past two decades from 23% in 2000 to 51% in 2023.
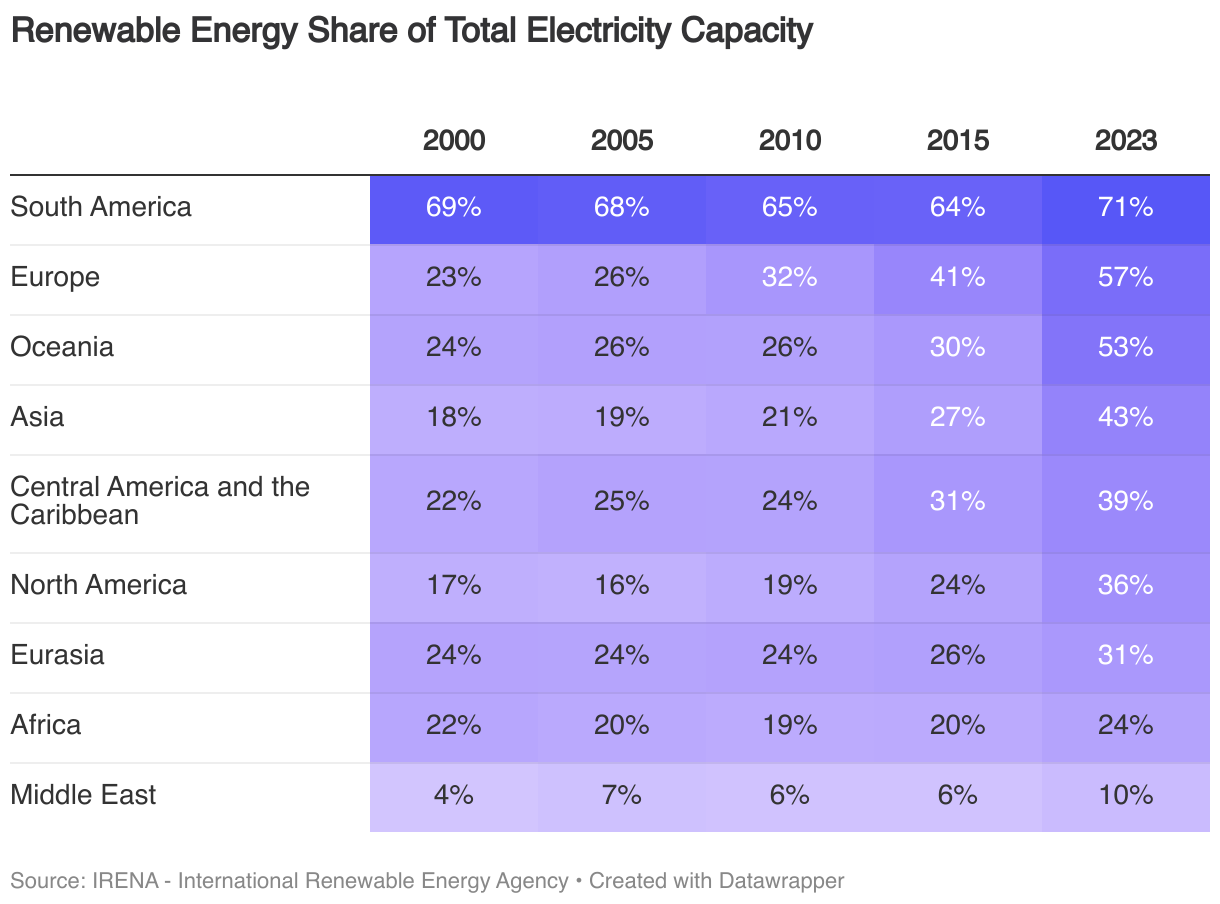
When looking at the share of electrical capacity coming from renewables, South America is on top with over 71% followed by Europe and Oceania. Most regions have seen significant gains in their renewable shares over the past two decades.
Solar Energy
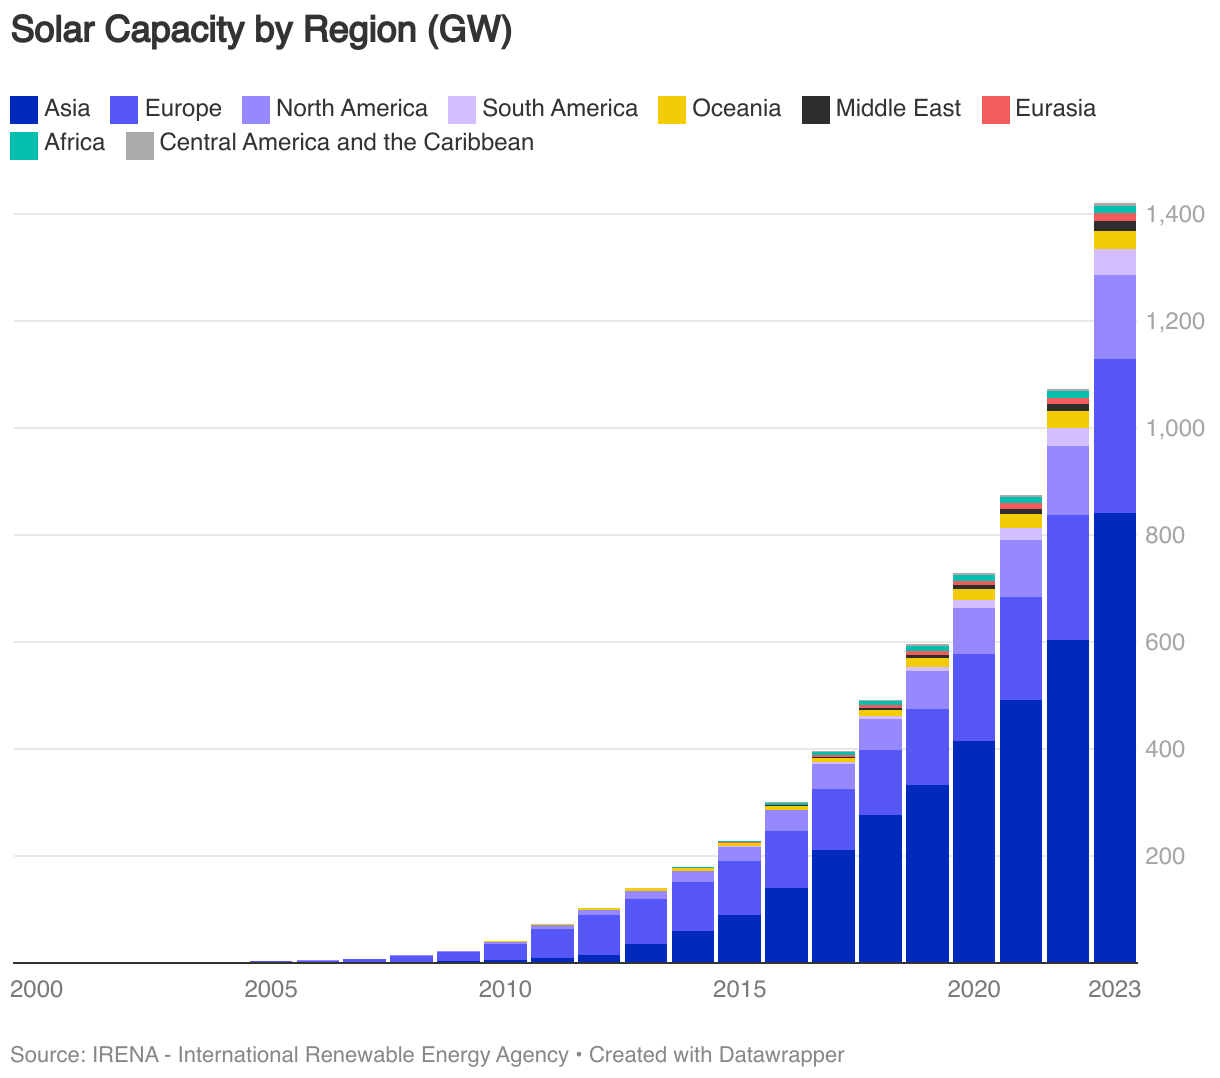
By the end of 2023, the world’s solar energy capacity reached 1419 GW. This places solar as the largest renewable energy source by capacity, having overtaken renewable hydropower in 2023. Solar energy now accounts for 37% of the world’s renewable energy capacity, compared to just 3% in 2010. In 2023, 346 GW of new solar energy capacity was added, making solar the main contributor to the renewable capacity expansion of 473 GW for that year.
Key Nations and Regions
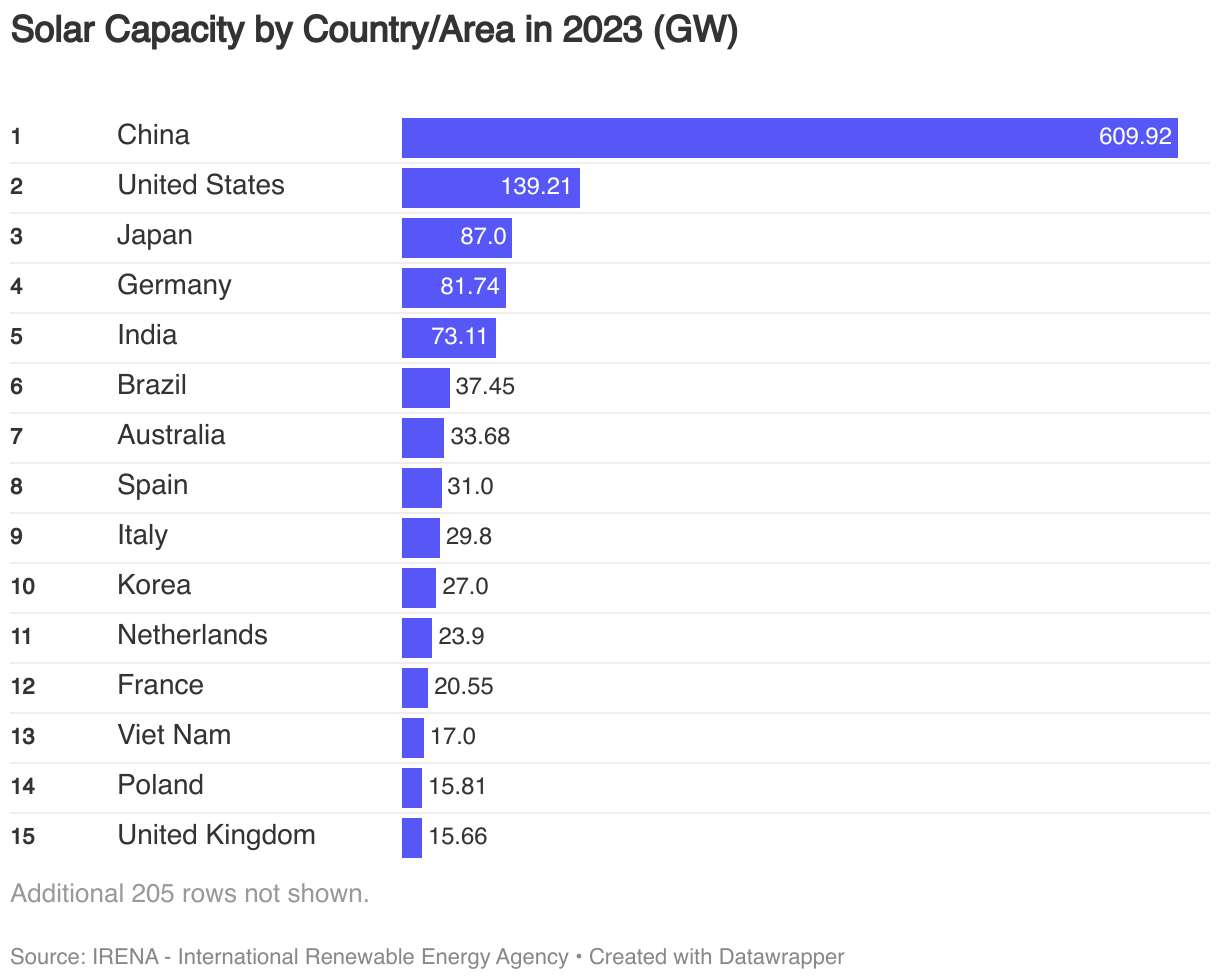
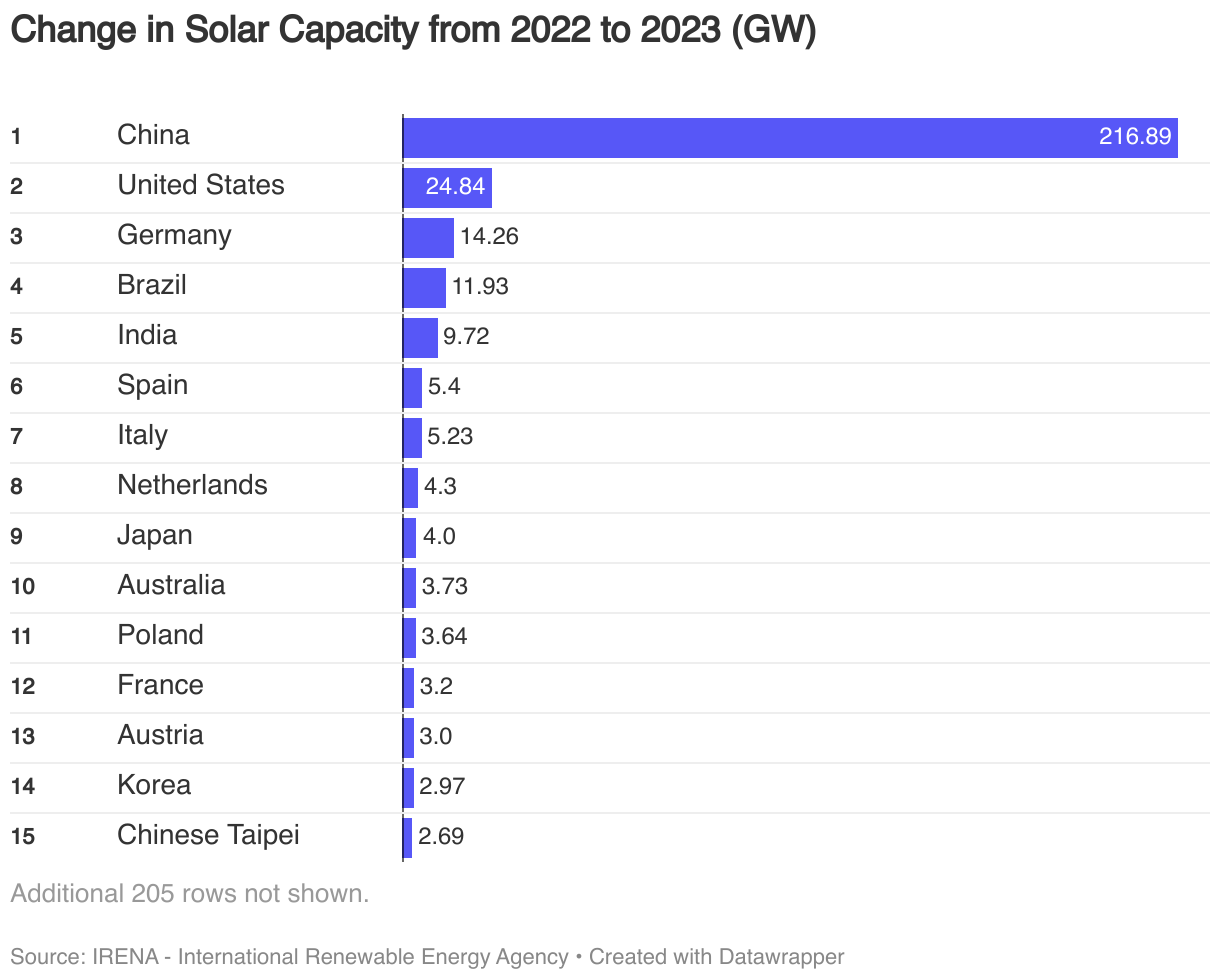
China is by far the largest capacity provider, with over 610 GW of the total 1419 GW solar capacity worldwide, followed by the United States (139 GW) and Japan (87 GW). In 2023 alone China added 217 GW.
In 2022, Asia made up just above 841 GW of the total 1419 GW (59%) of global capacity, making it the by far most dominant region in solar power.
Renewable Hydropower
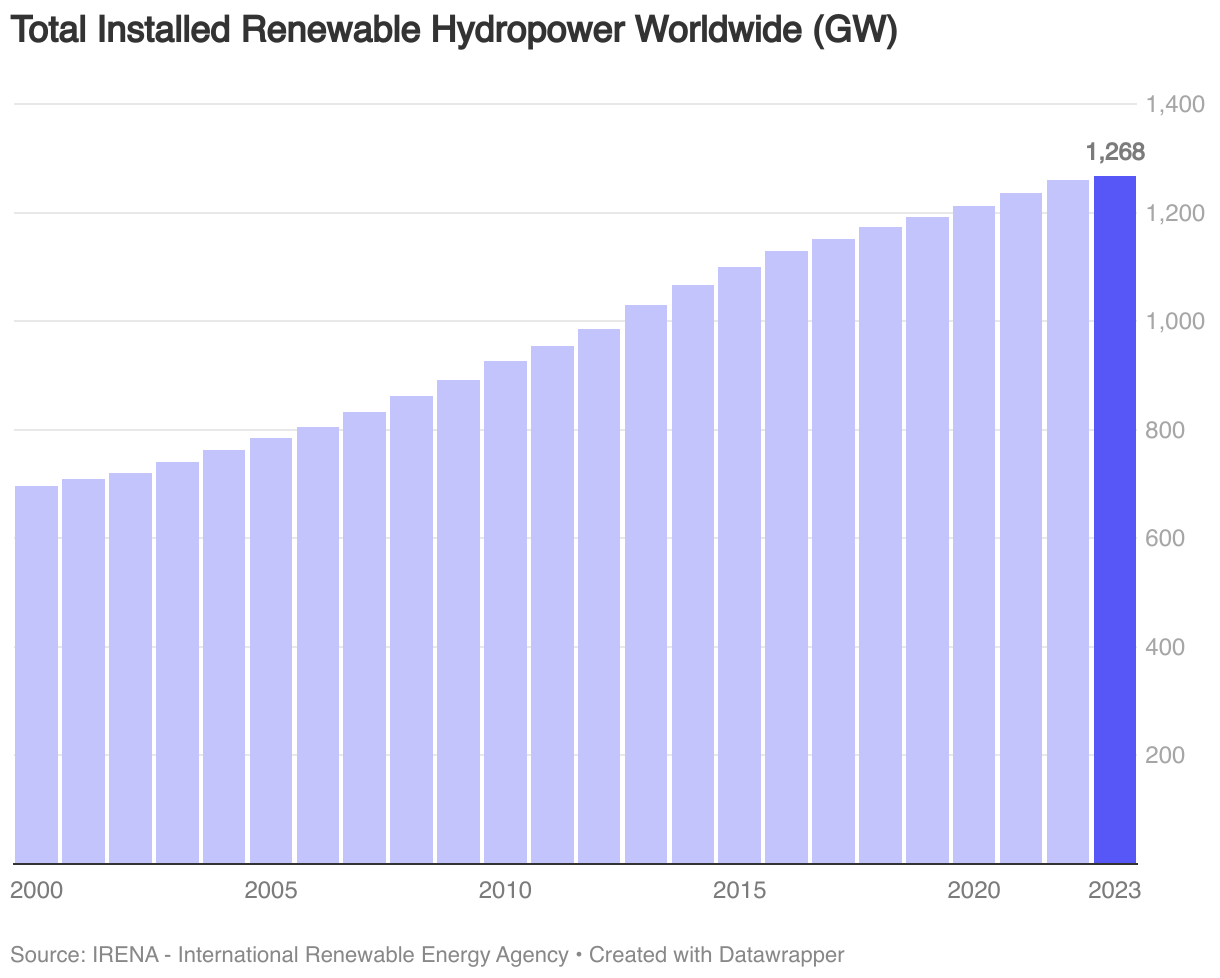
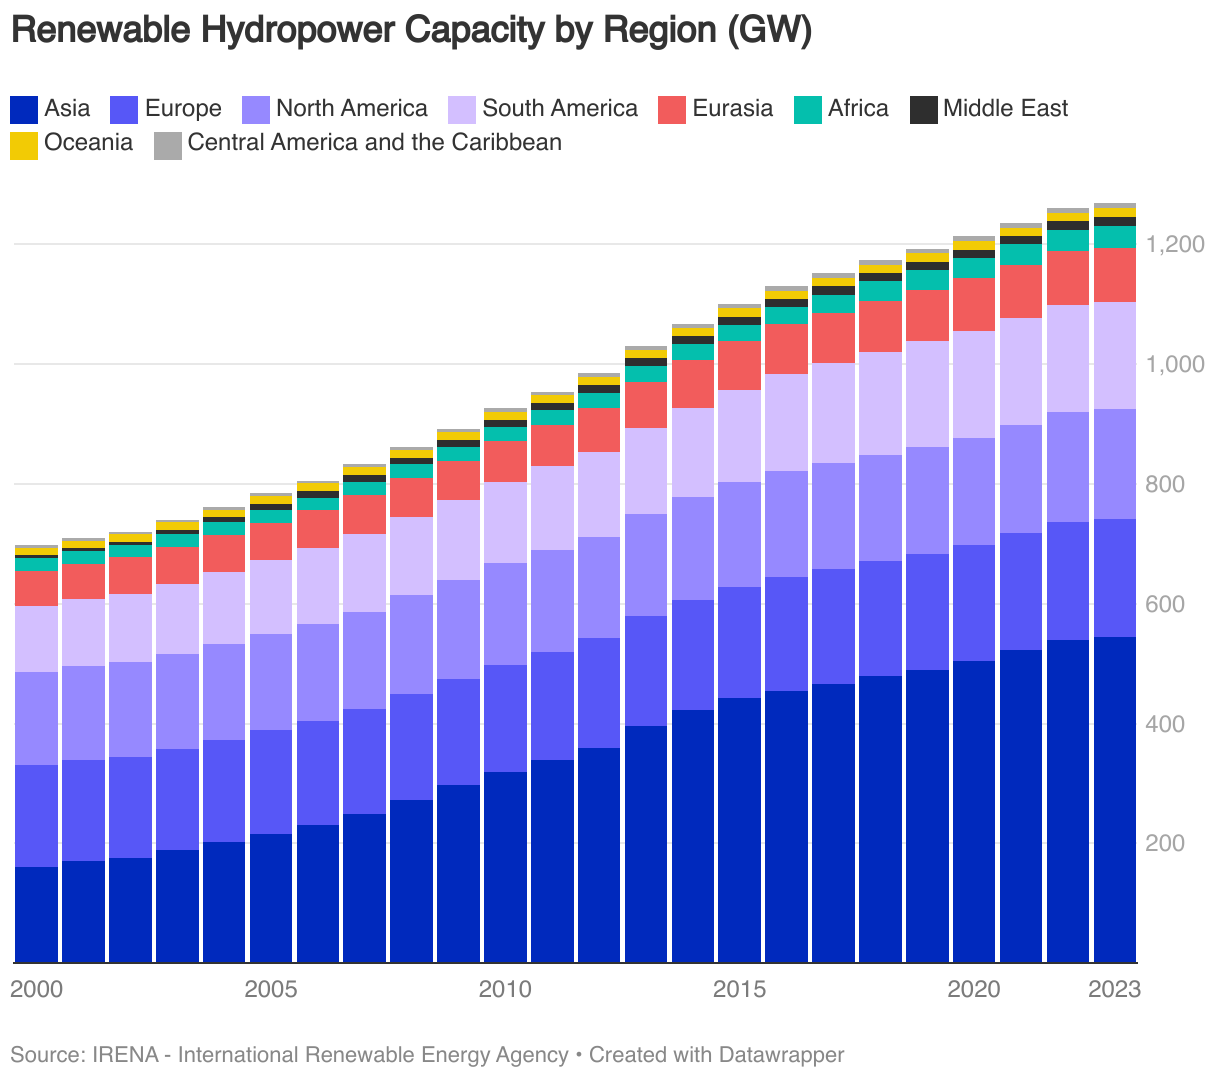
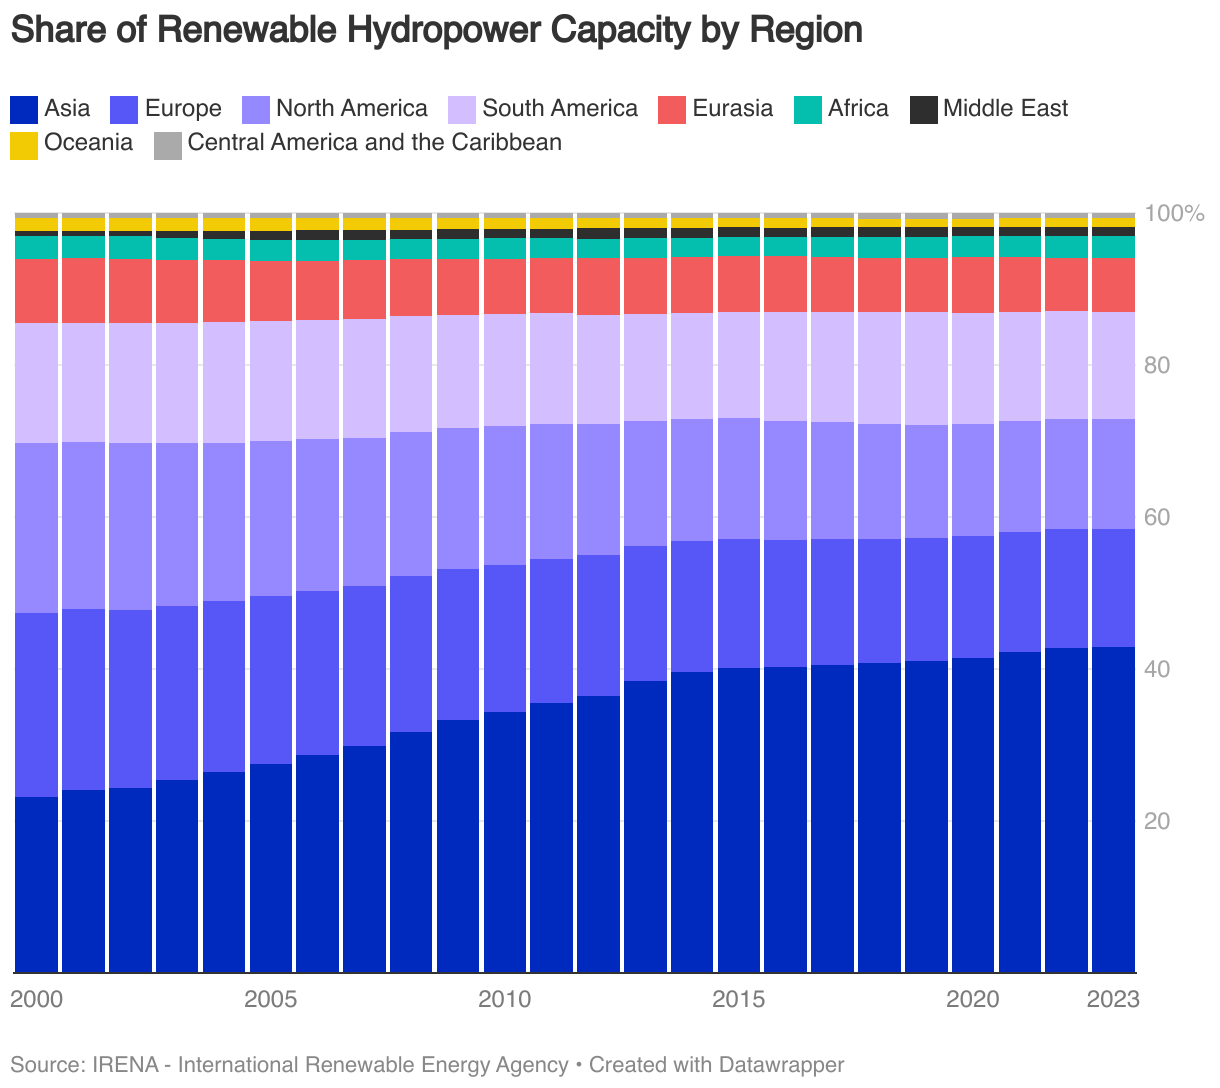
Renewable hydropower has long been the largest renewable technology by capacity, however in 2023 it was overtaken by solar. In 2023, the total renewable hydropower capacity worldwide stood at 1268 GW, accounting for 33% of the total renewable capacity. This is a decrease from its share of 93% in 2000 and 76% in 2010.
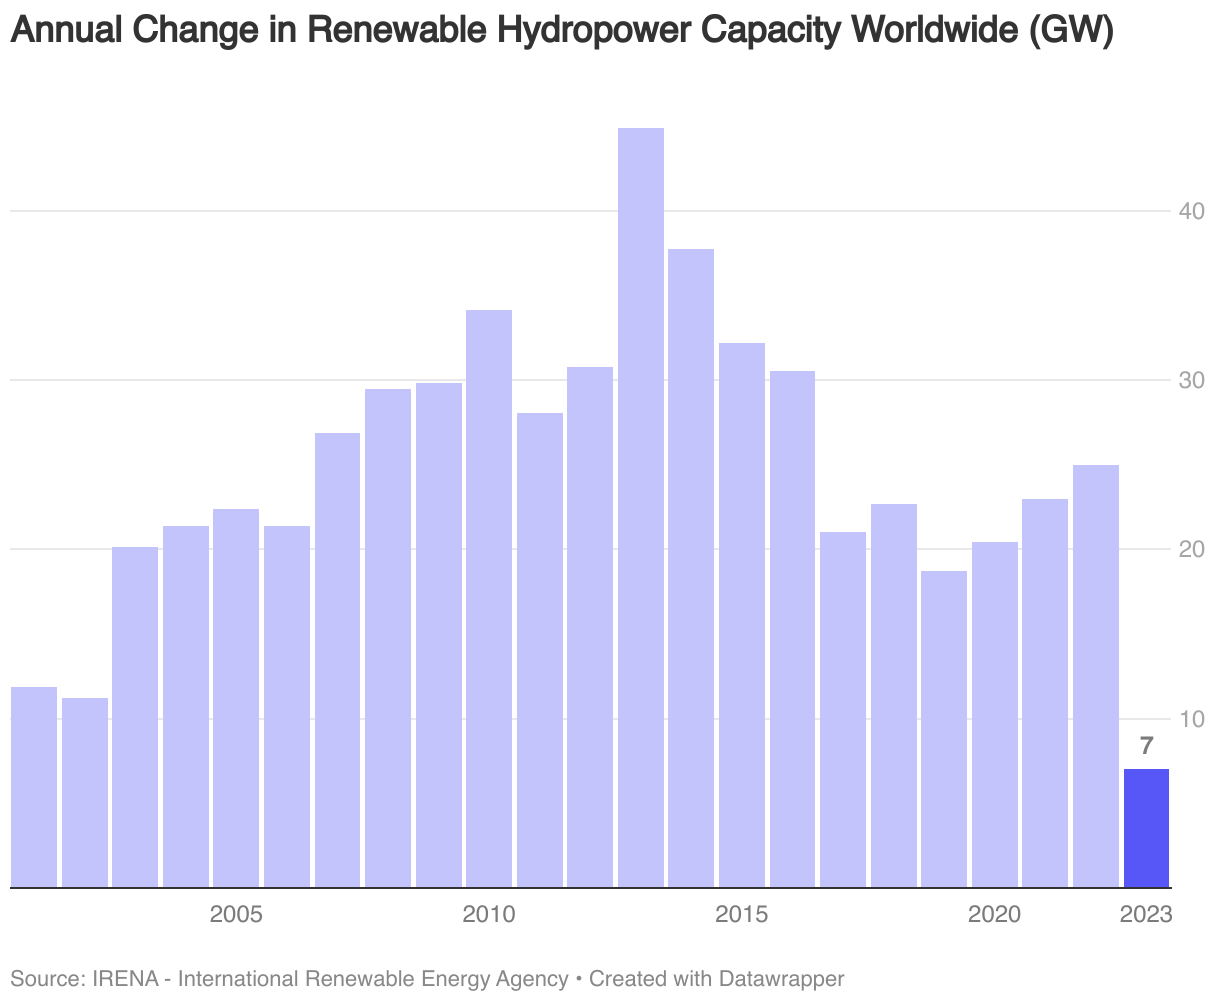
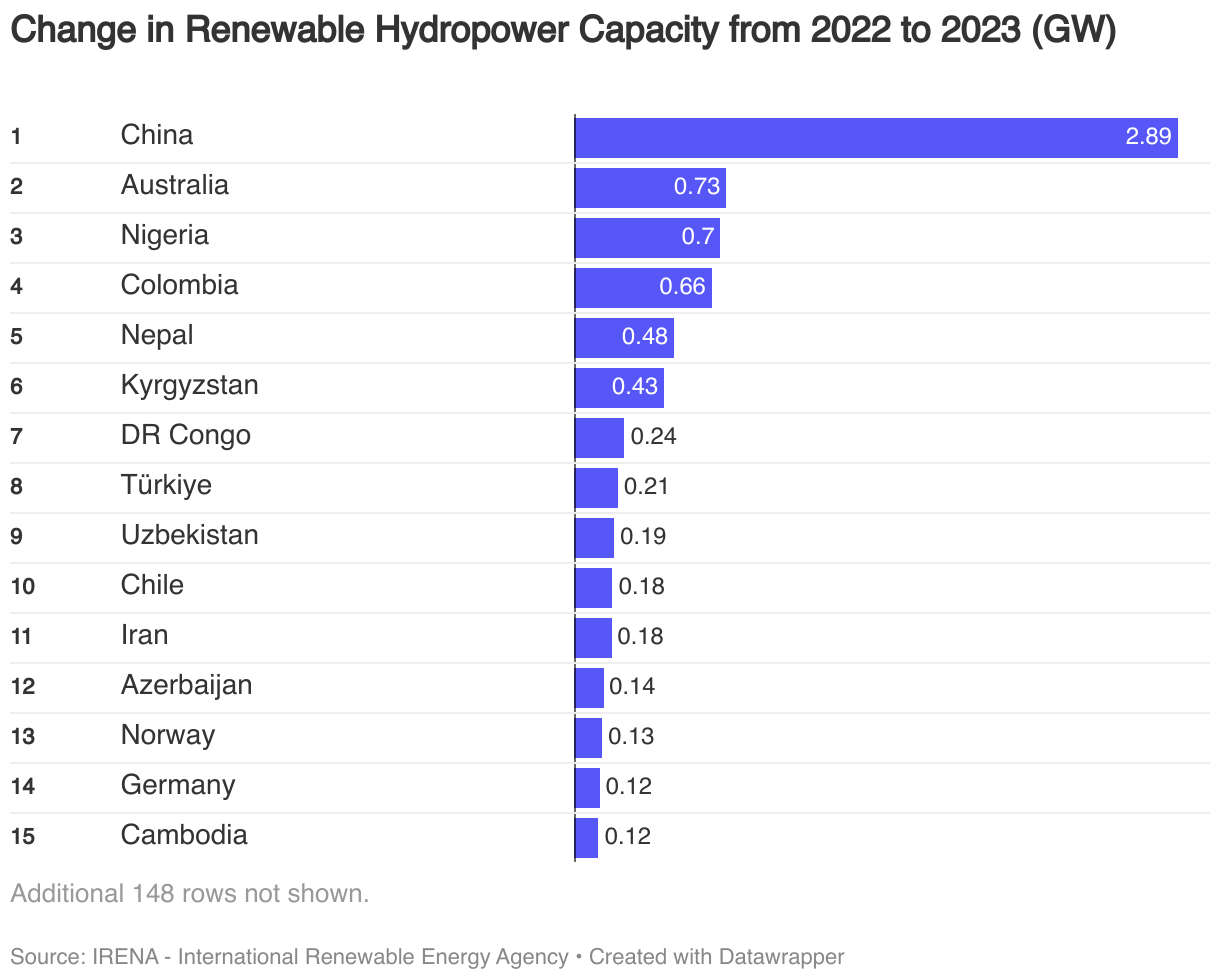
Over the past decade, the net addition of renewable hydropower capacity has slowed, dropping from a high of 45 GW in 2013 to 7 GW in 2023. As a result, it constituted just 1.5% of the total 473 GW of added renewable capacity worldwide in 2023.
Key Nations and Regions
As with wind and solar, China is the leading nation also when it comes to renewable hydropower, followed by Brazil, Canada, United States and Russia. Data for net additions shows that in 2023, China, Australia and Nigeria saw the largest additions for renewable hydropower capacity.
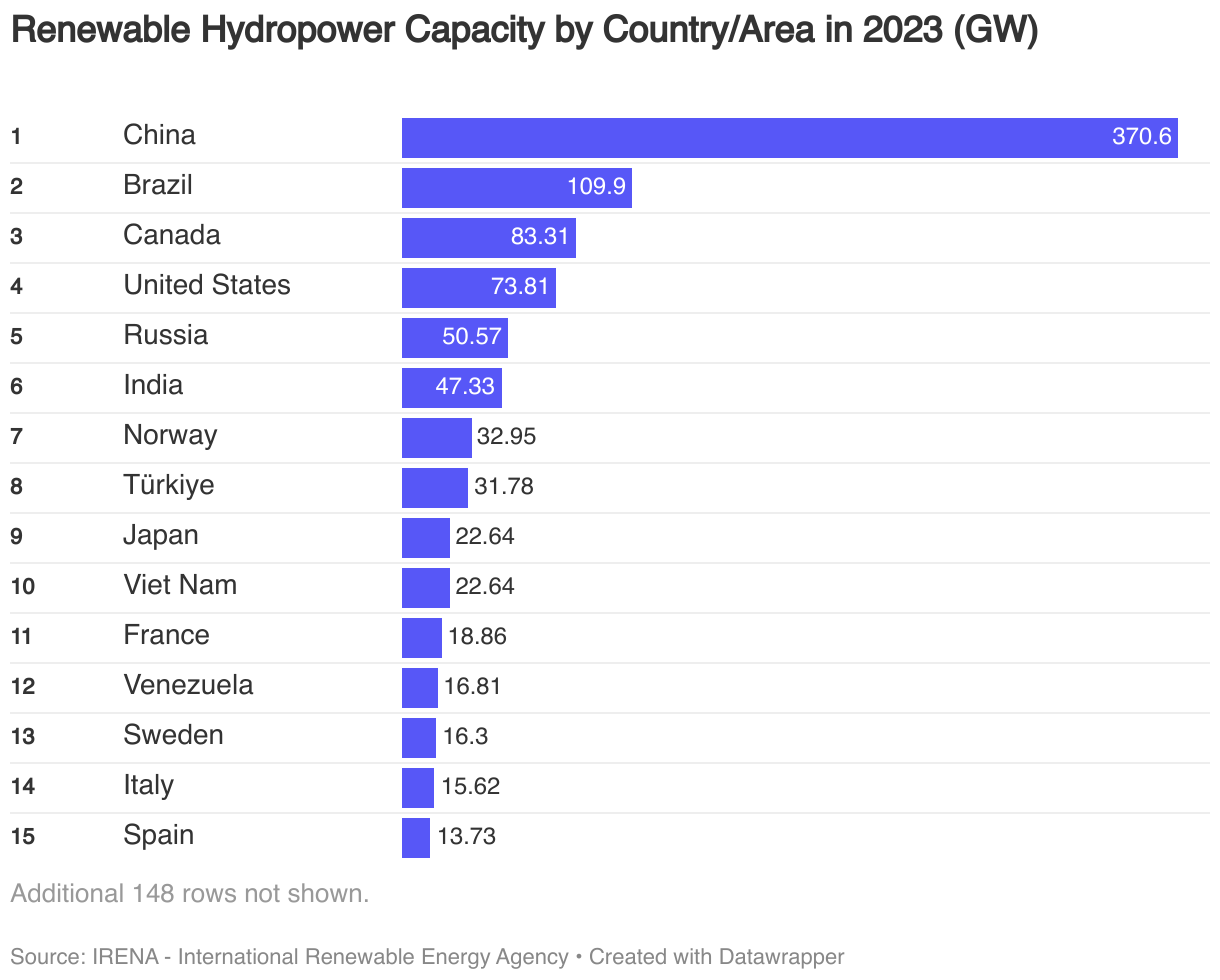
Given China’s dominance, Asia is the region with the largest renewable hydropower capacity, contributing 544 GW (43%) of global capacity in 2023.
Wind Energy
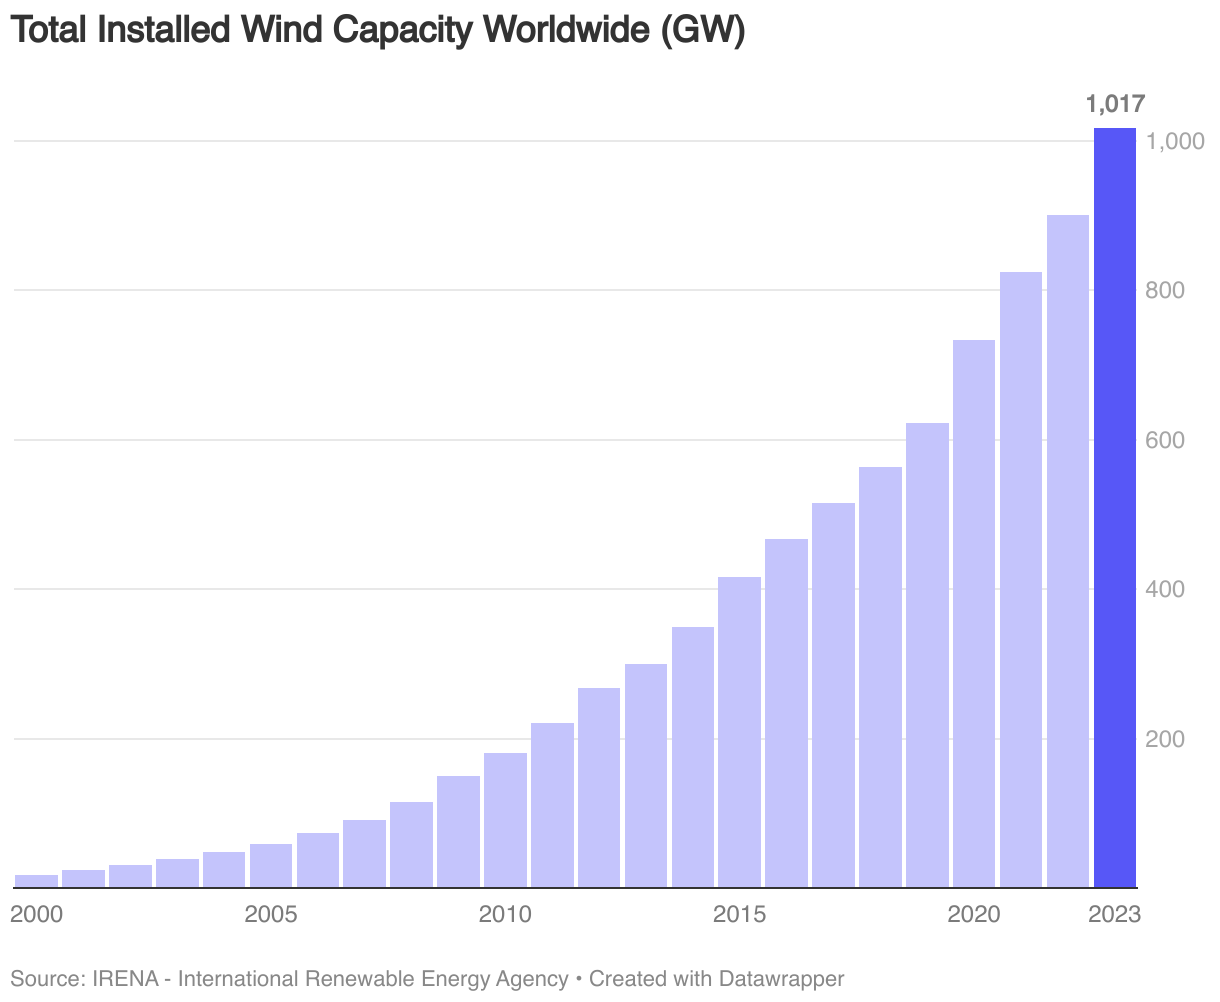
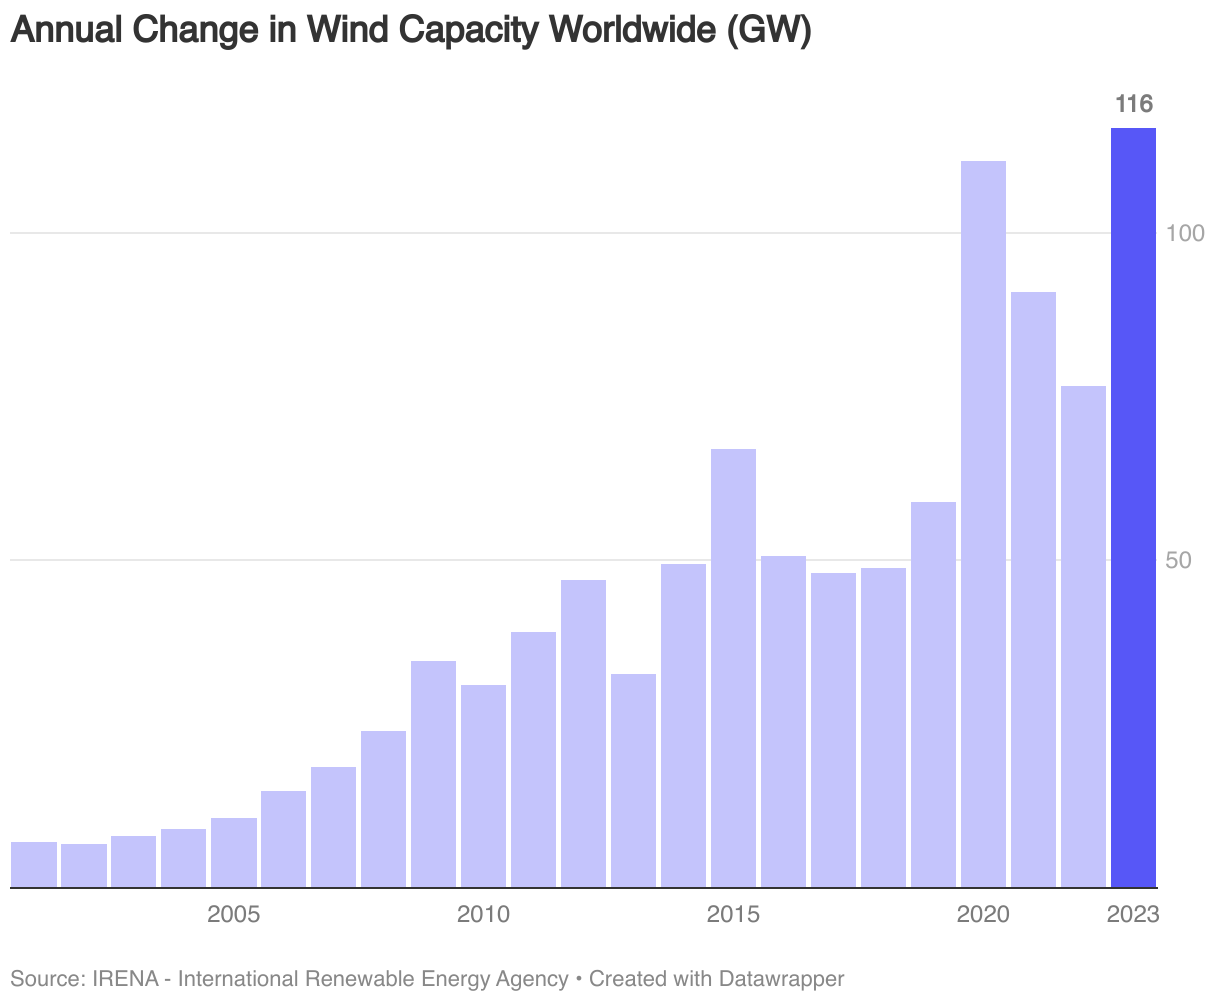
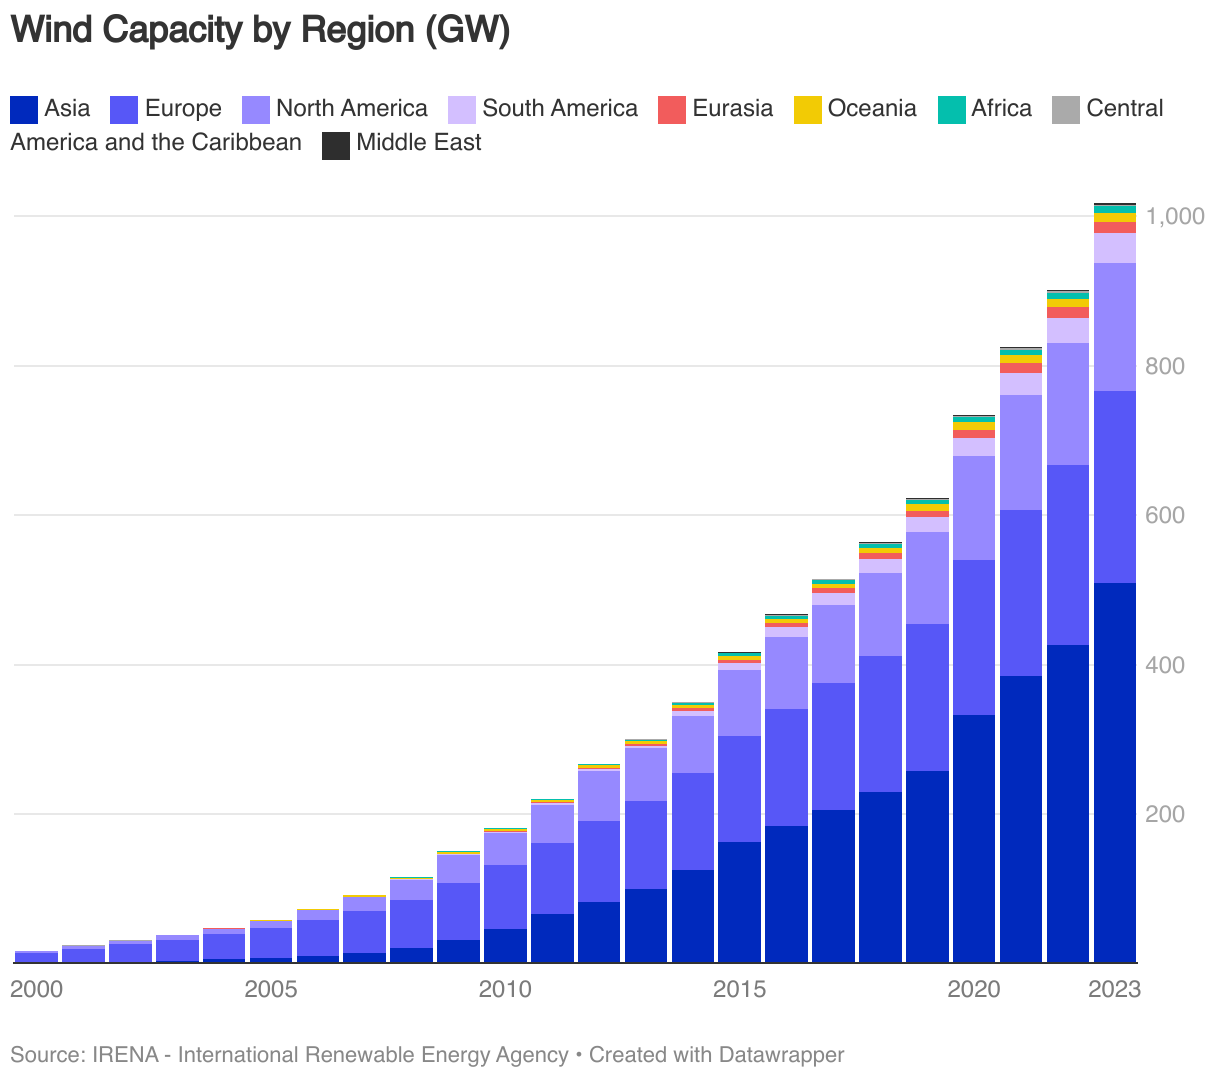
By the end of 2022, global wind energy capacity stood at 1017 GW, making it the third-largest renewable energy source by capacity, behind solar energy and renewable hydropower. In total, wind energy constituted 26% of the world’s renewable energy capacity in 2023. In 2023, the sector saw an addition of 116 GW, the highest addition on record.
Key Nations and Regions
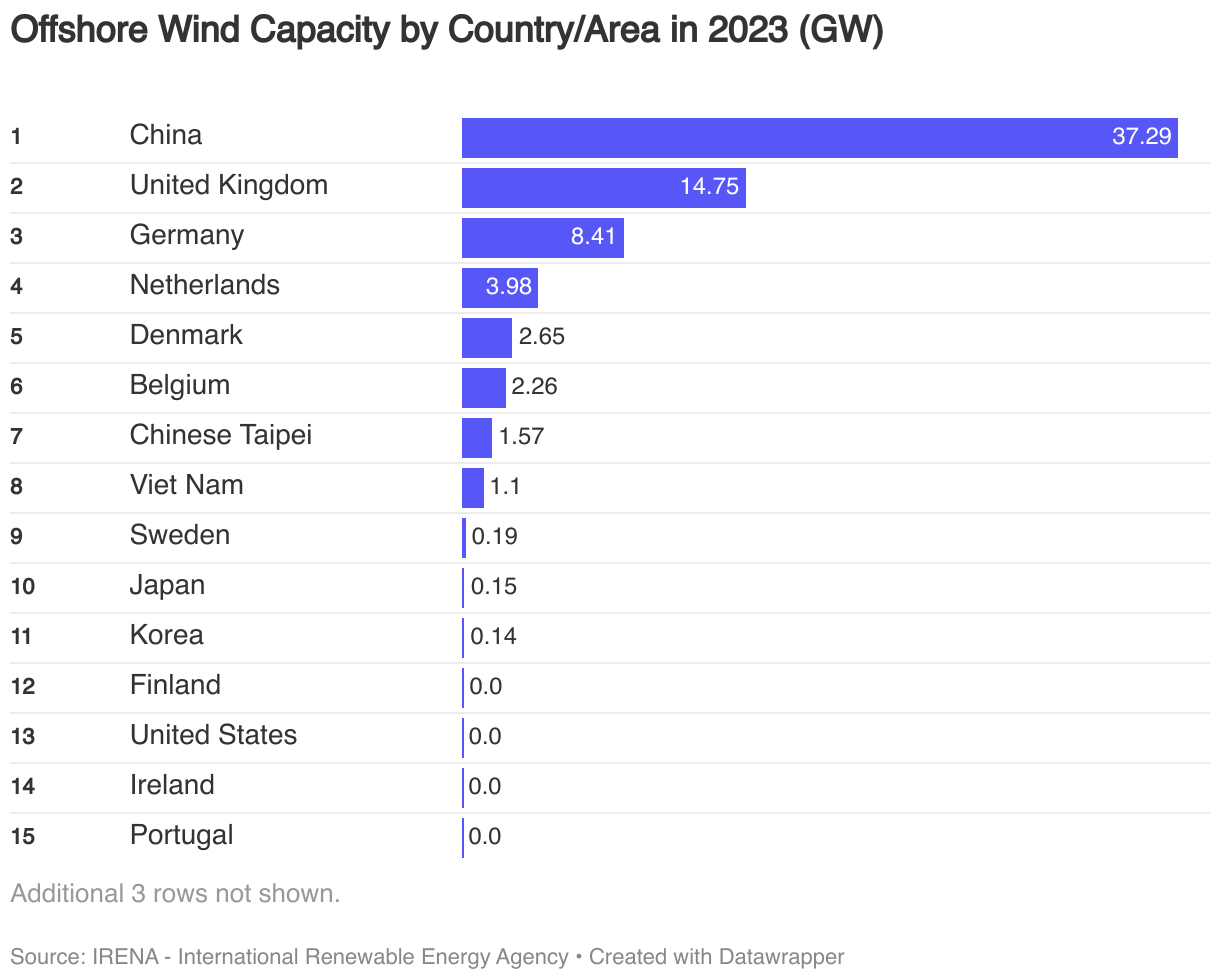
China has the largest wind capacity worldwide at 441 GW in 2023, accounting for 43% of global capacity. After China, the United States, Germany, India, Spain and the UK are the largest contributors to total global wind capacity.
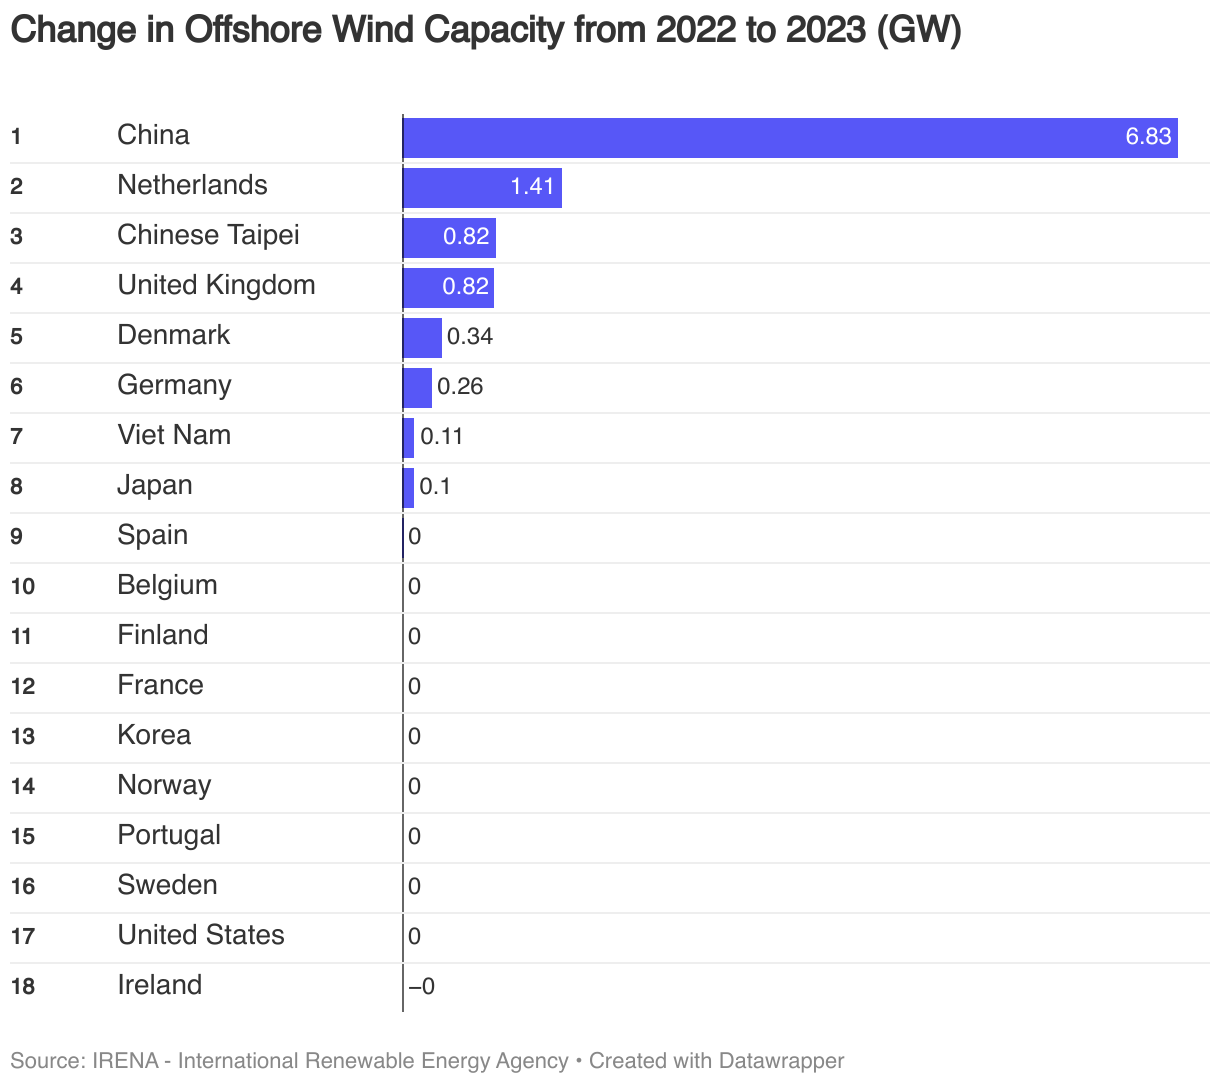
The majority of wind capacity worldwide is onshore. For offshore wind, China still leads, followed by the UK, Germany, Netherlands and Denmark.
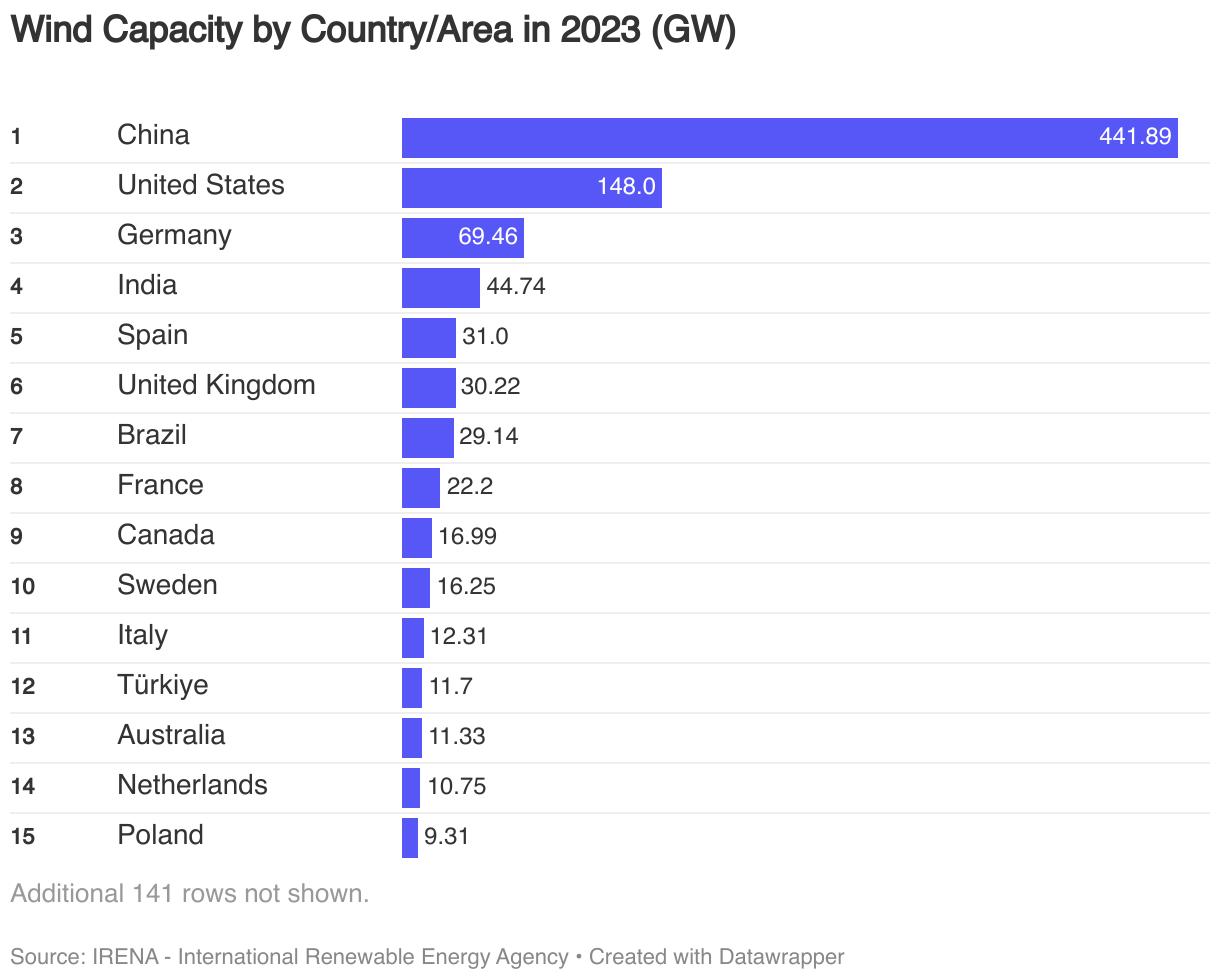
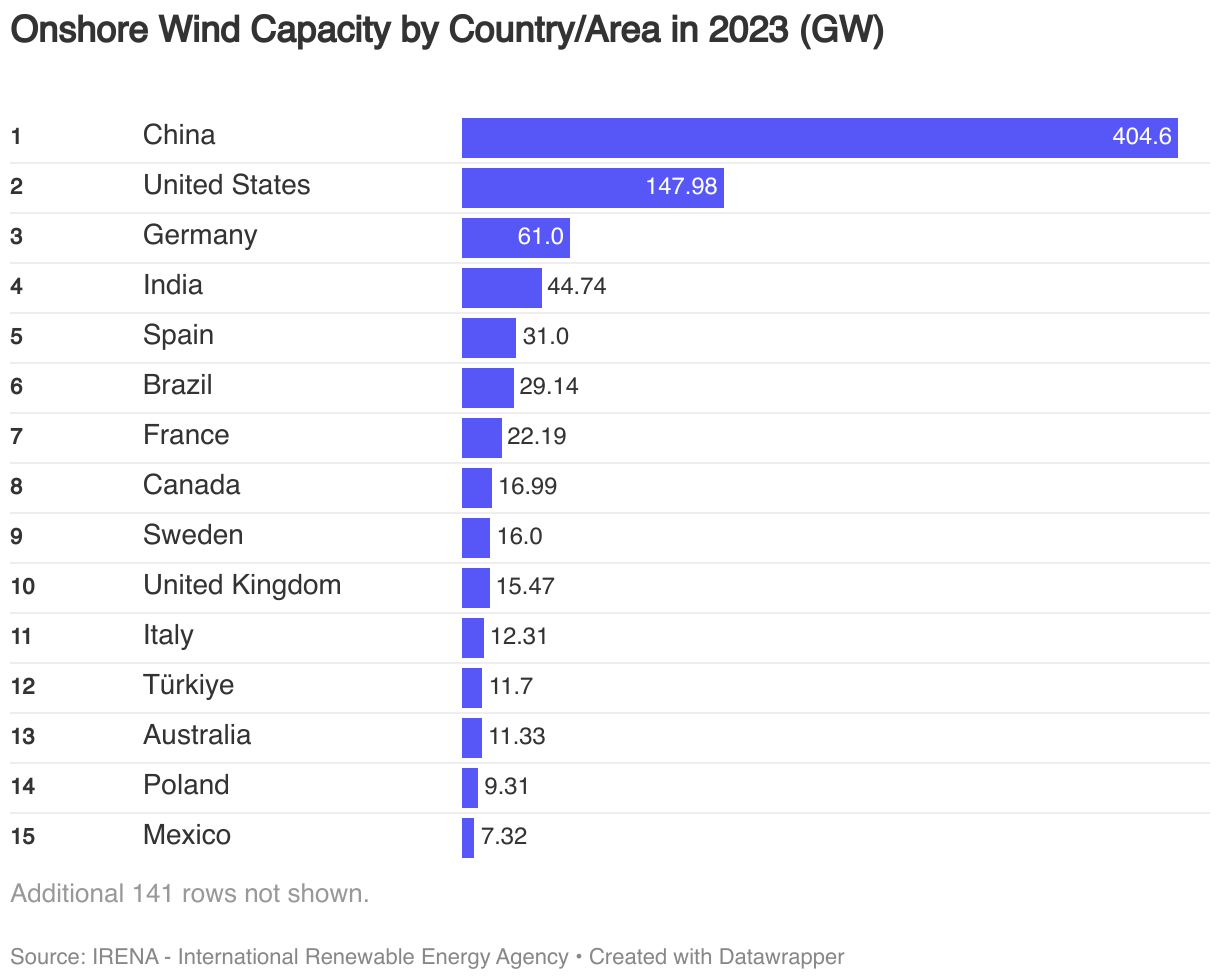
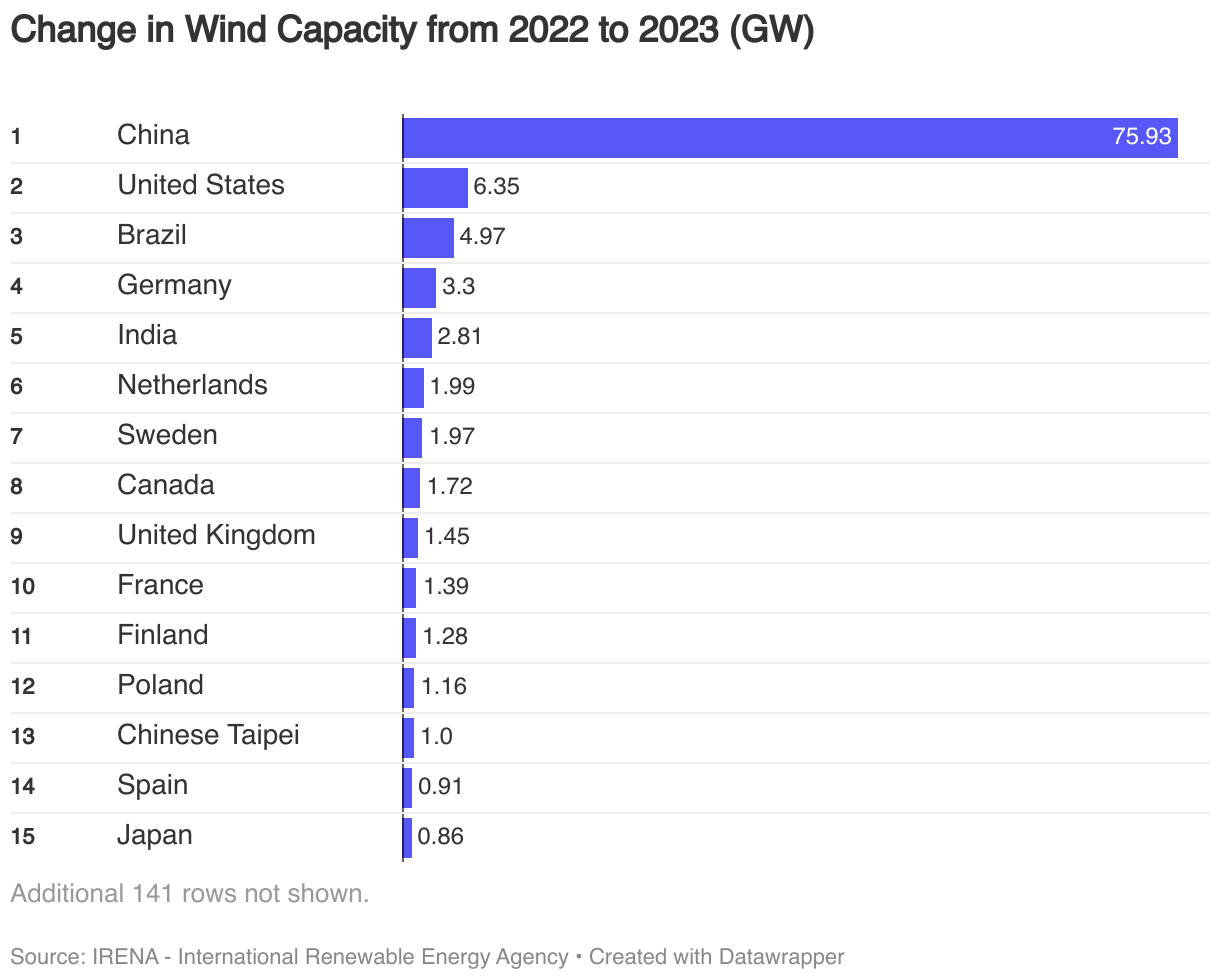
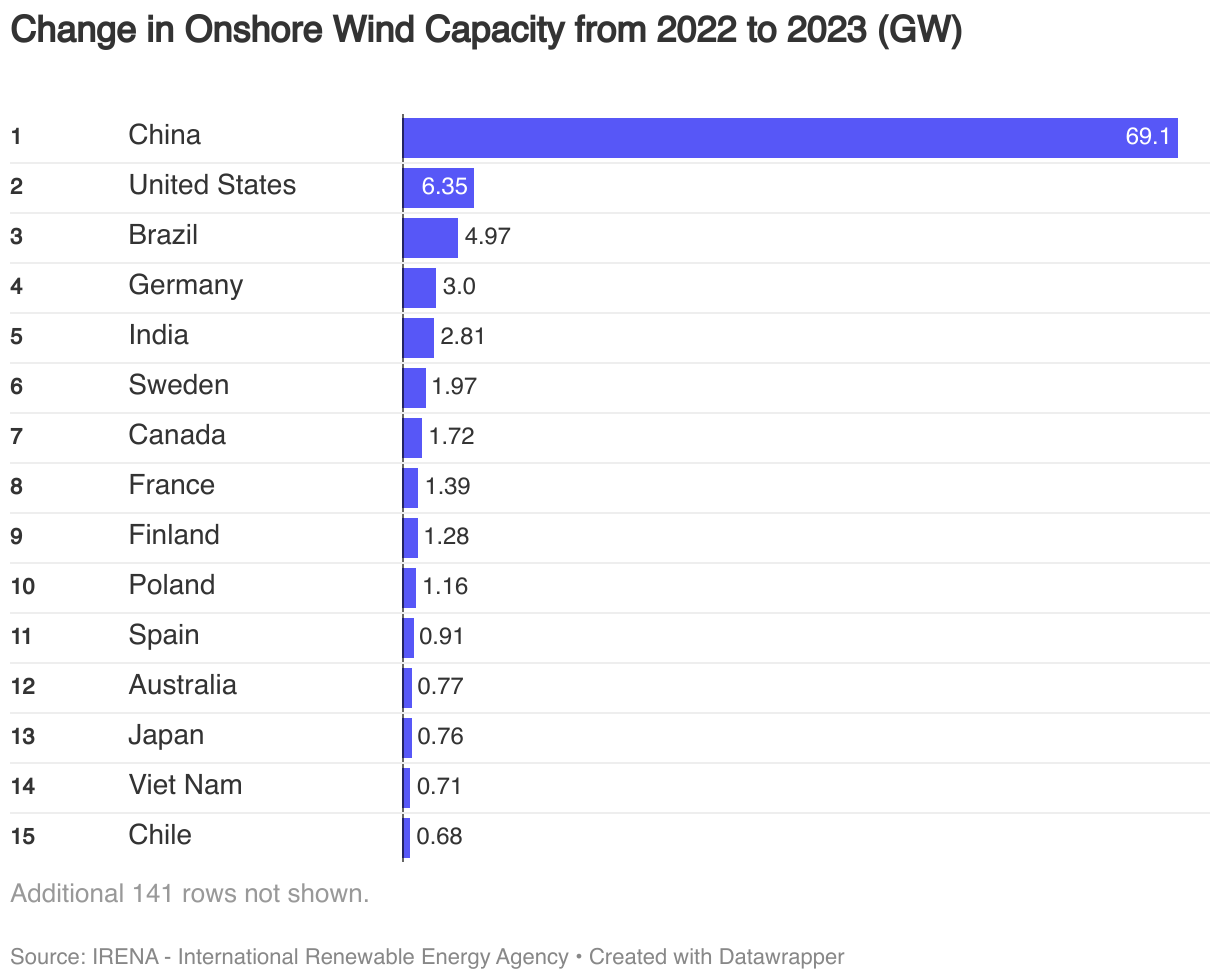
In 2023, China accounted for 65% of the total expansion in wind energy, adding 76 GW to its total capacity, the vast majority of which was onshore.
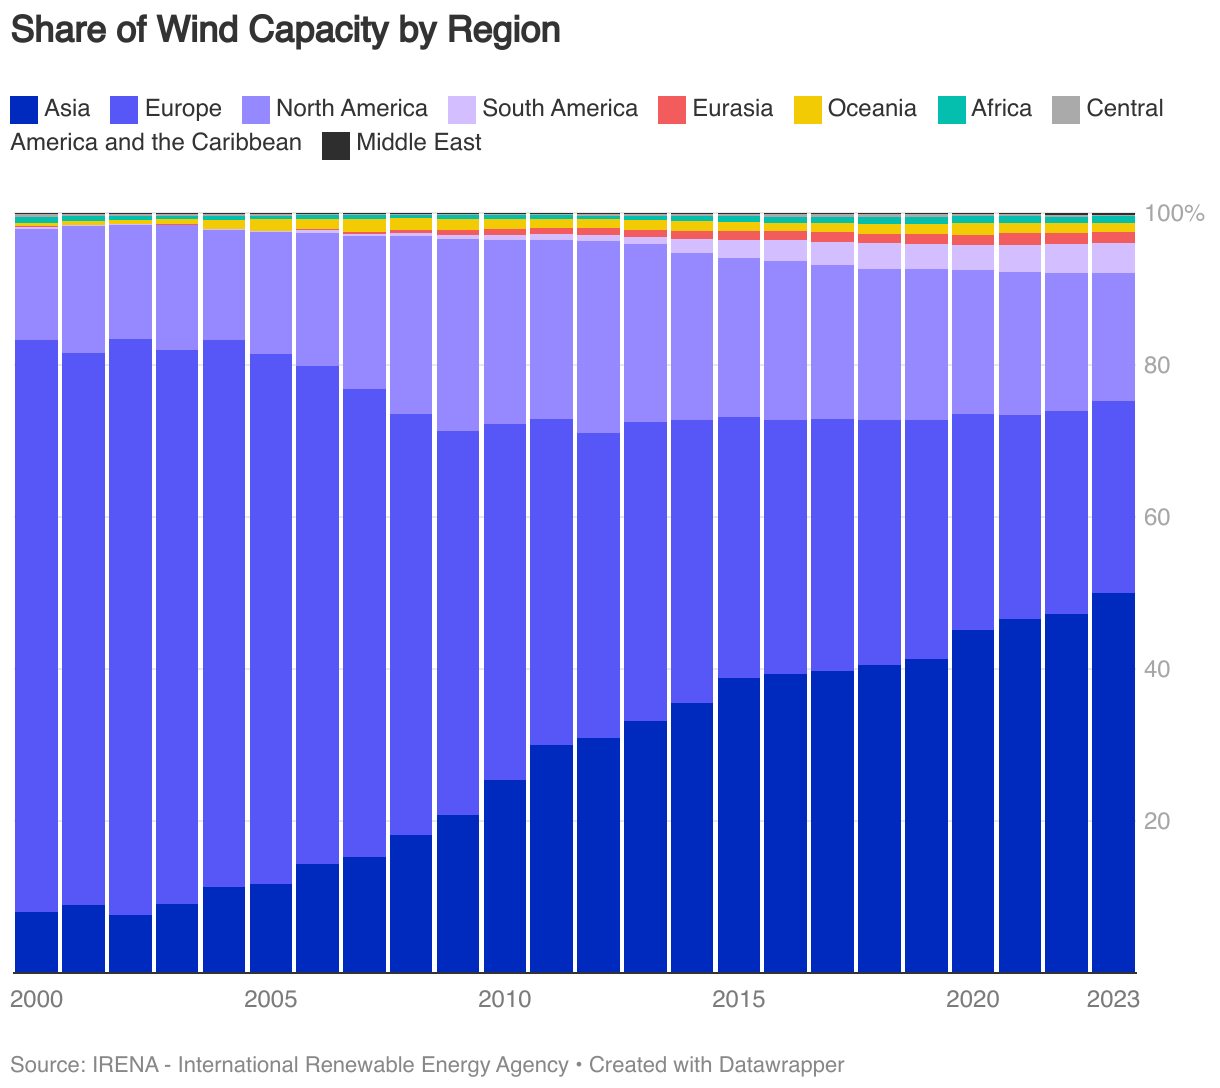
Asia, led by China’s dominance, has emerged as the most significant contributor to global wind capacity over the past decade.
Bioenergy
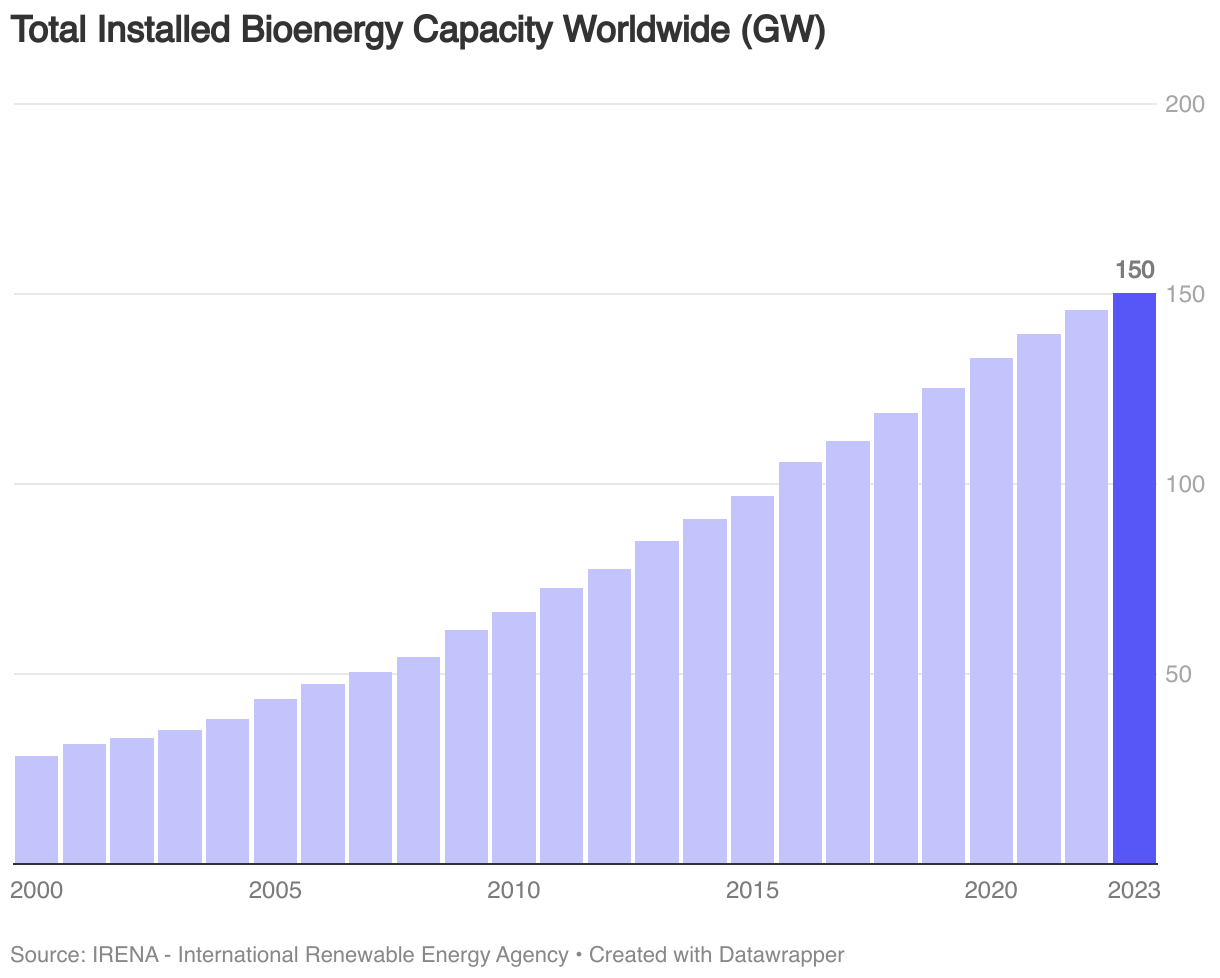
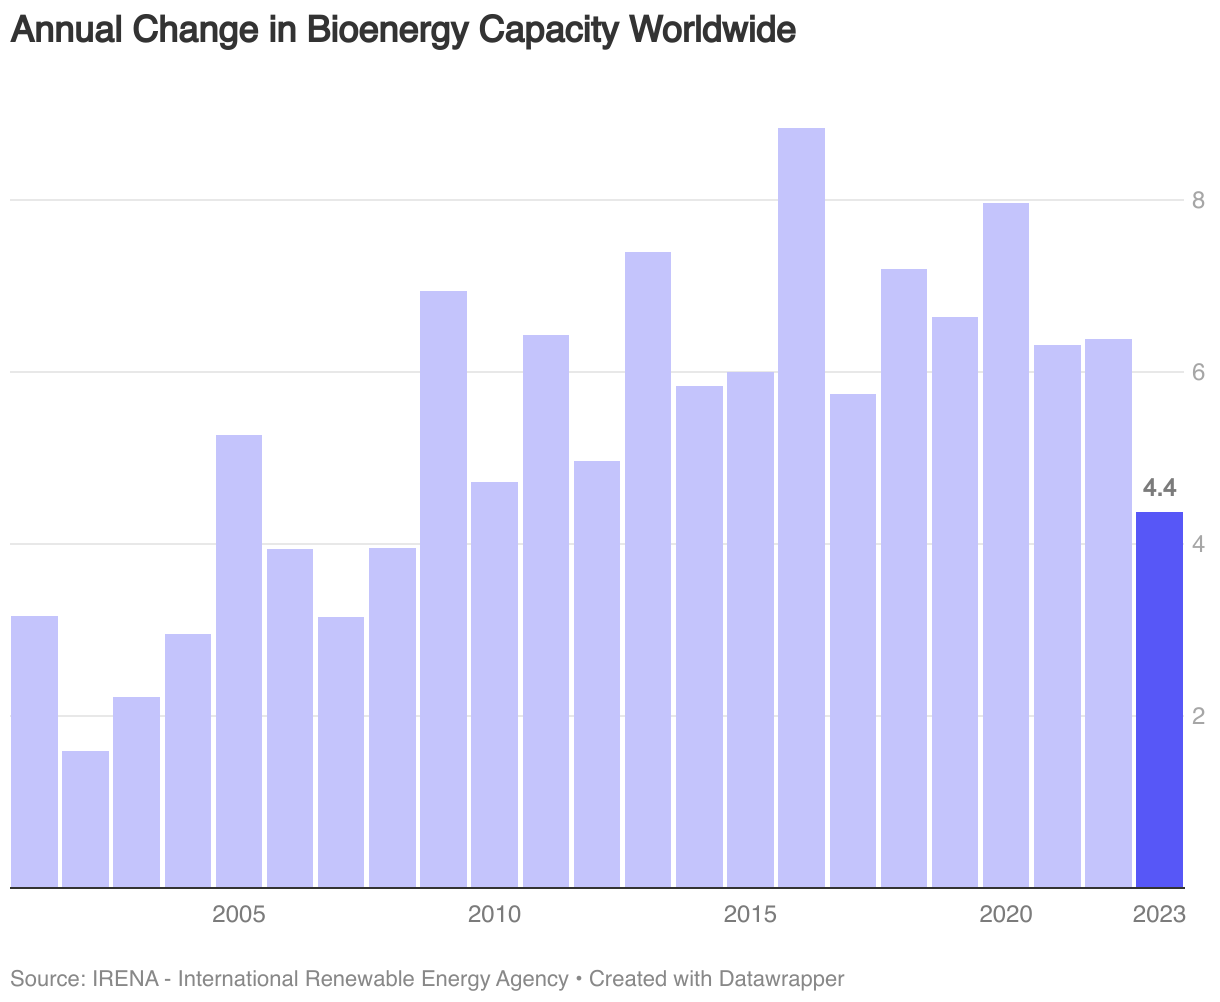
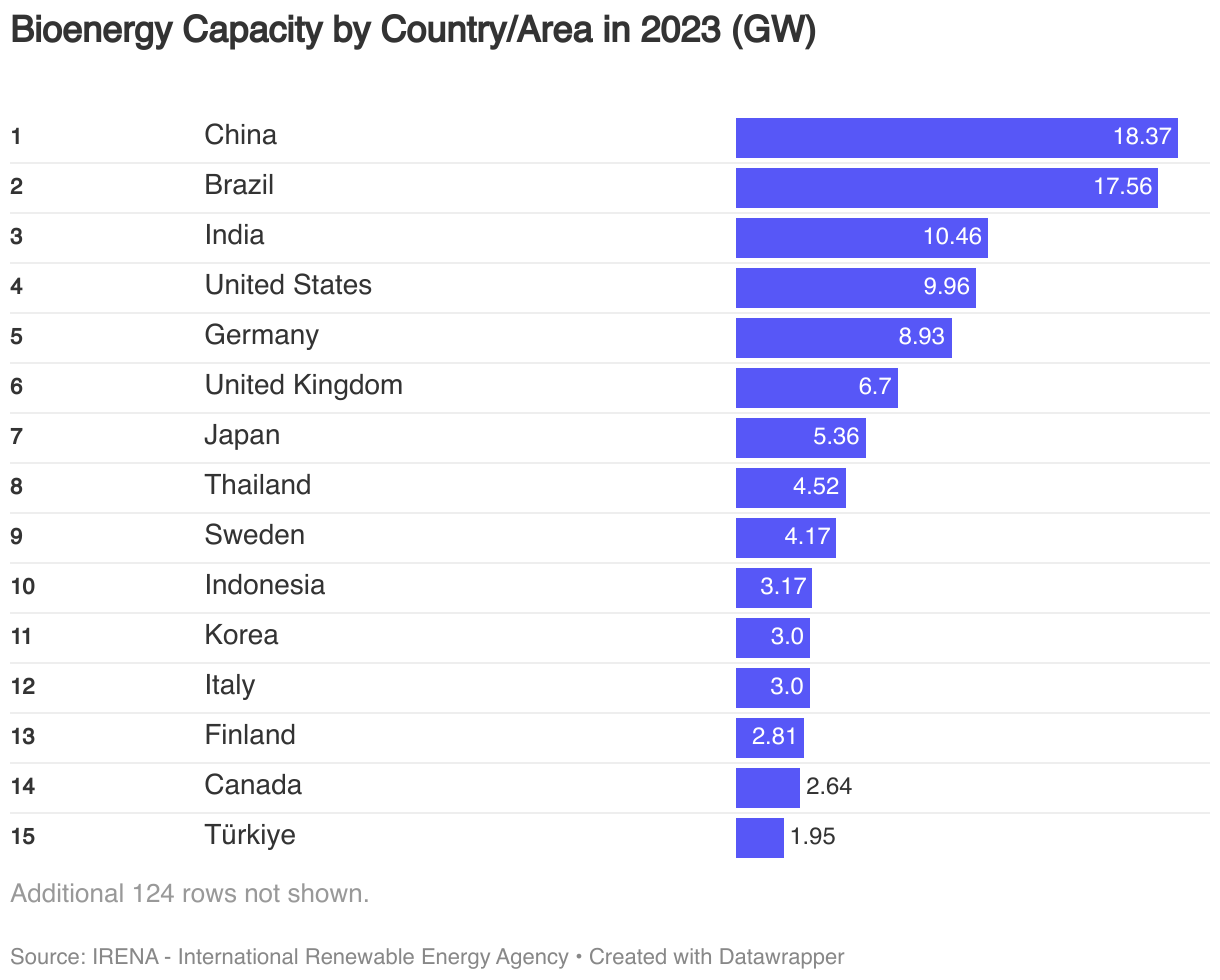
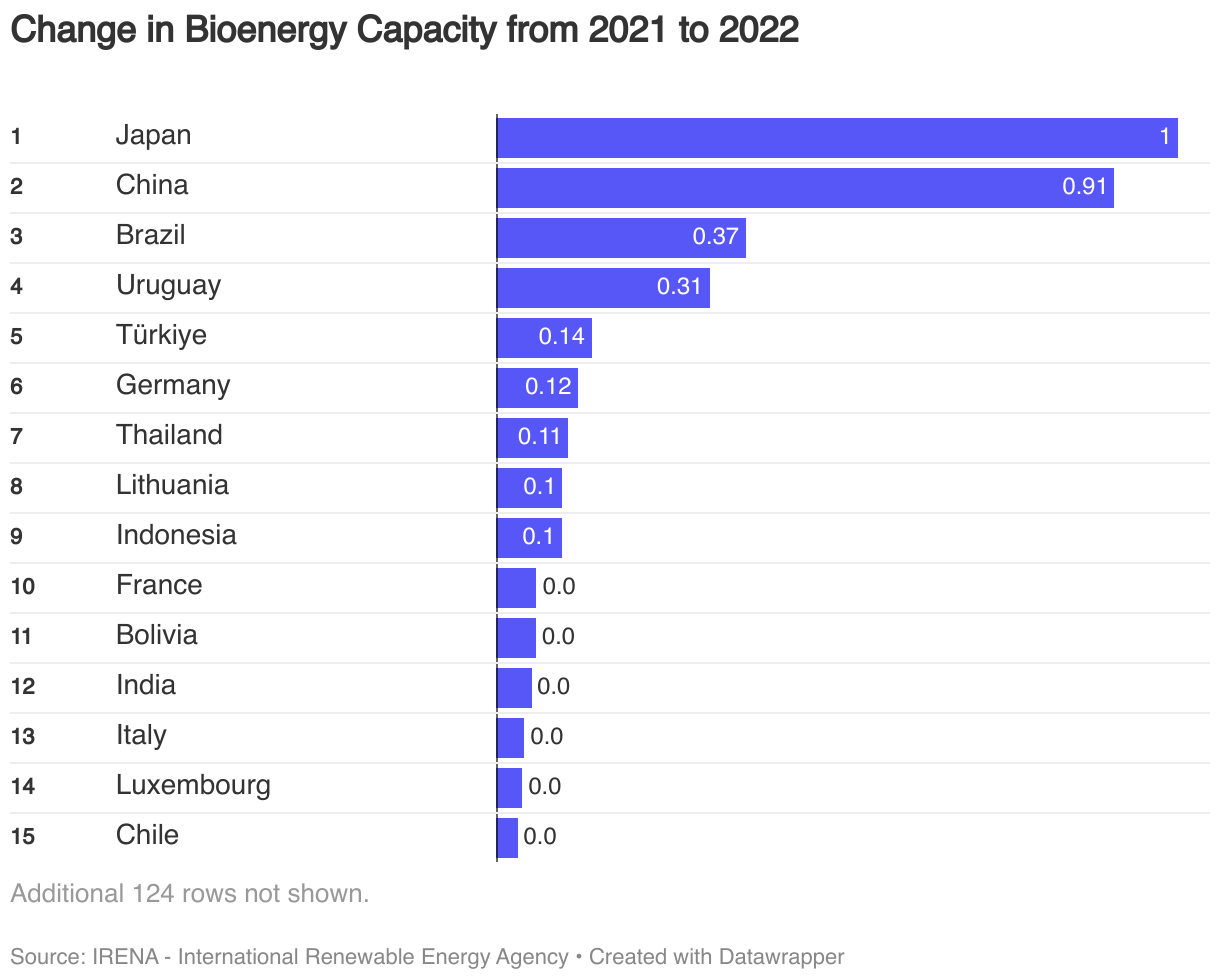
In 2023 global bioenergy capacity stood at 150 GW. Bioenergy has seen steady growth over the years, with an addition of 4 GW in 202. Bioenergy’s share of global renewable capacity has remained at around 4-5% in the past decade.
Key Nations and Regions
In 2023, China was the largest contributor to bioenergy capacity, followed by Brazil, the India, United States and Germany.
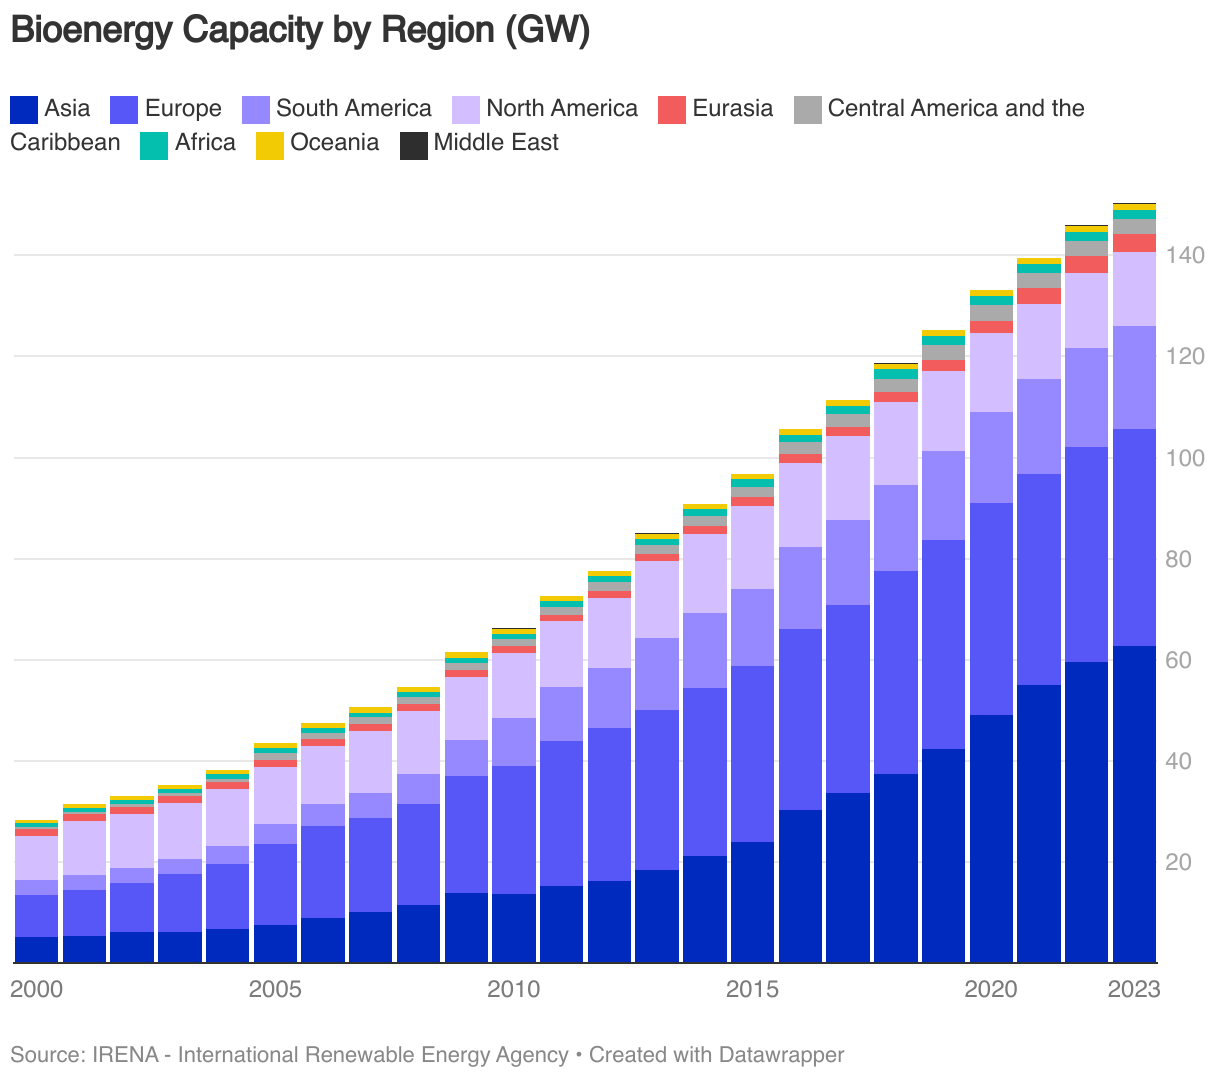
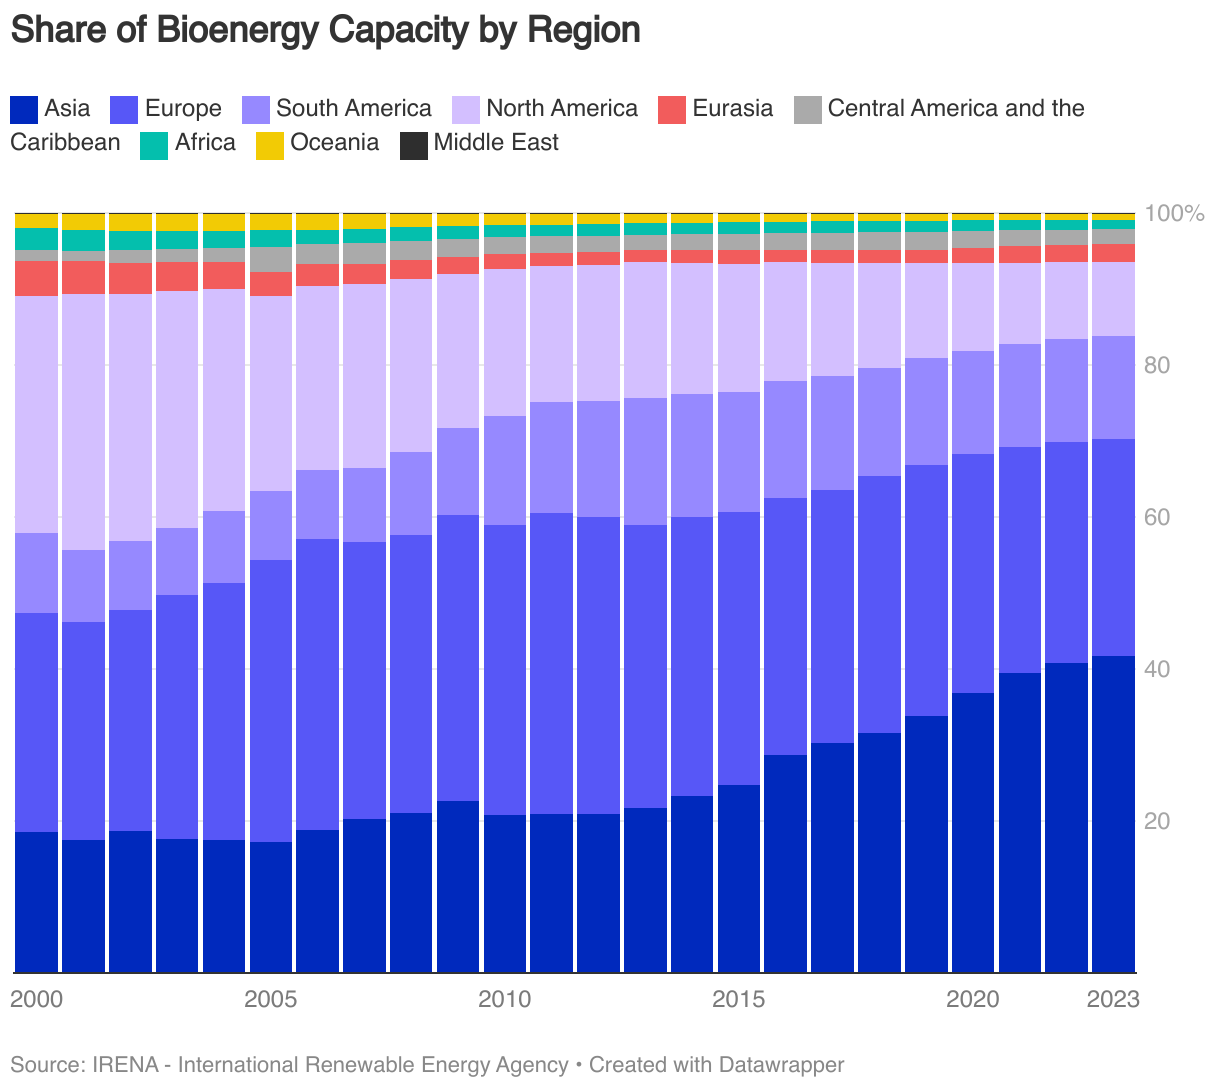
Regionally, Asia accounted for 42% of global capacity, a share that has increased substantially over the past two decades.
Geothermal Energy
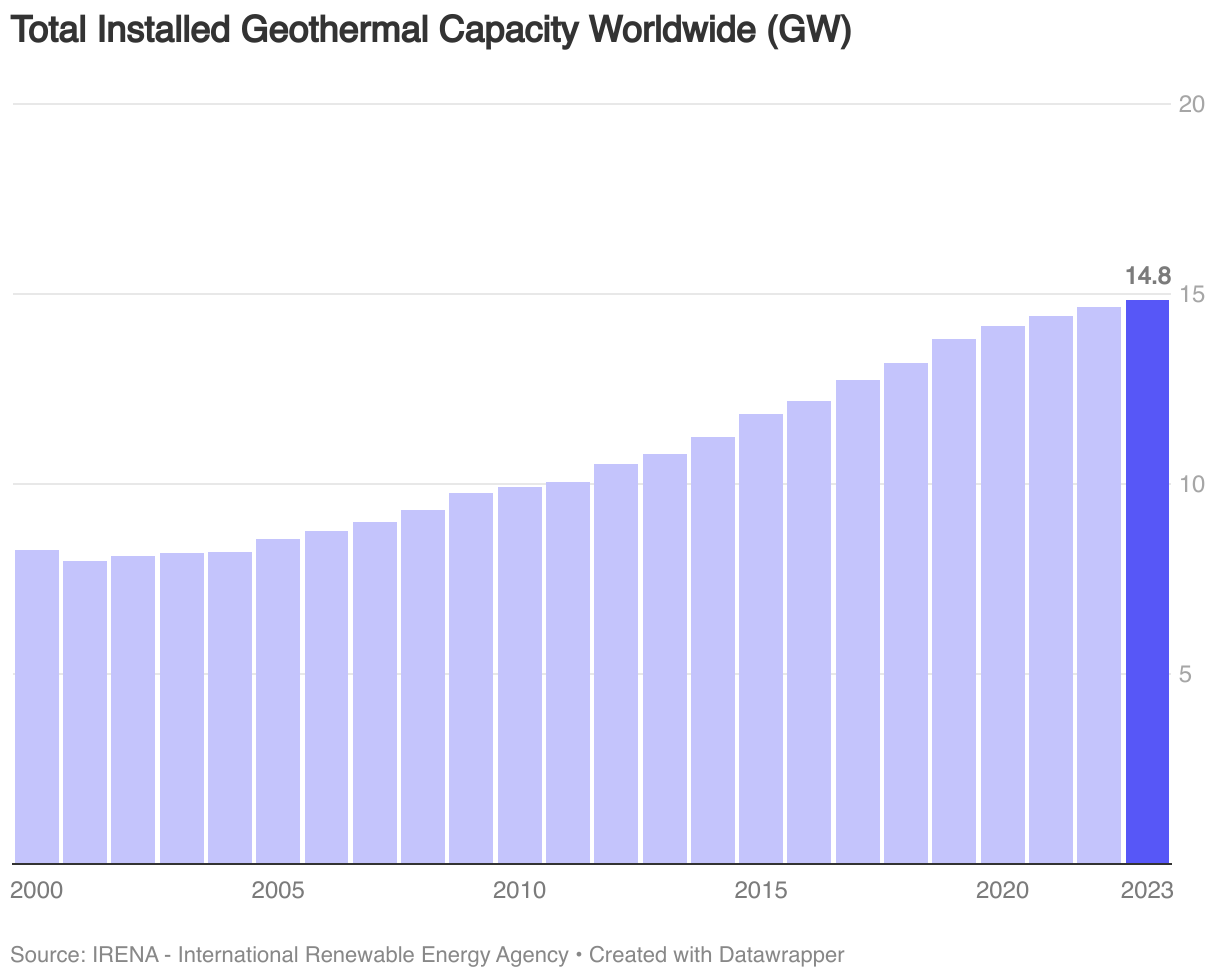
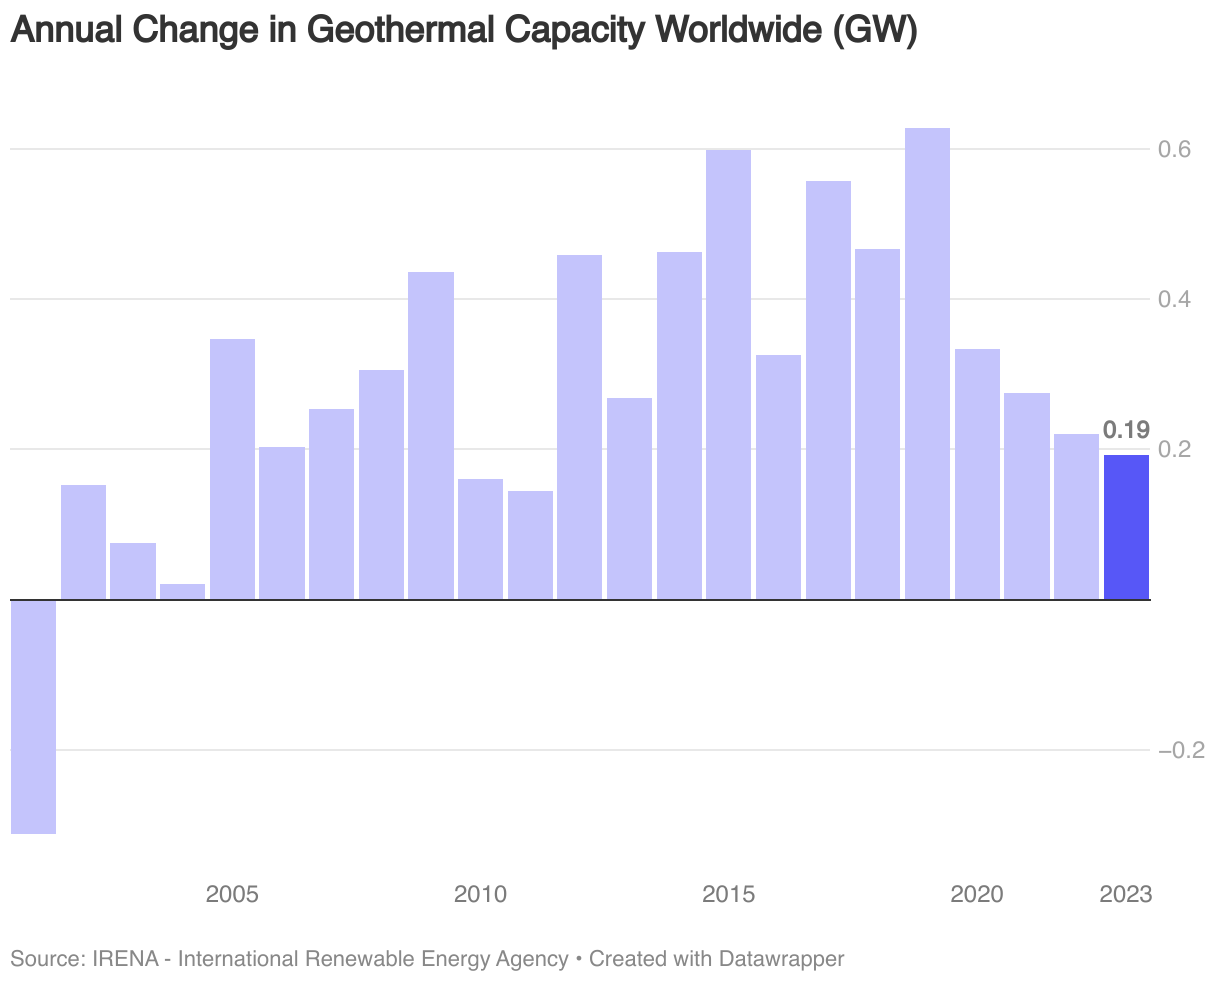
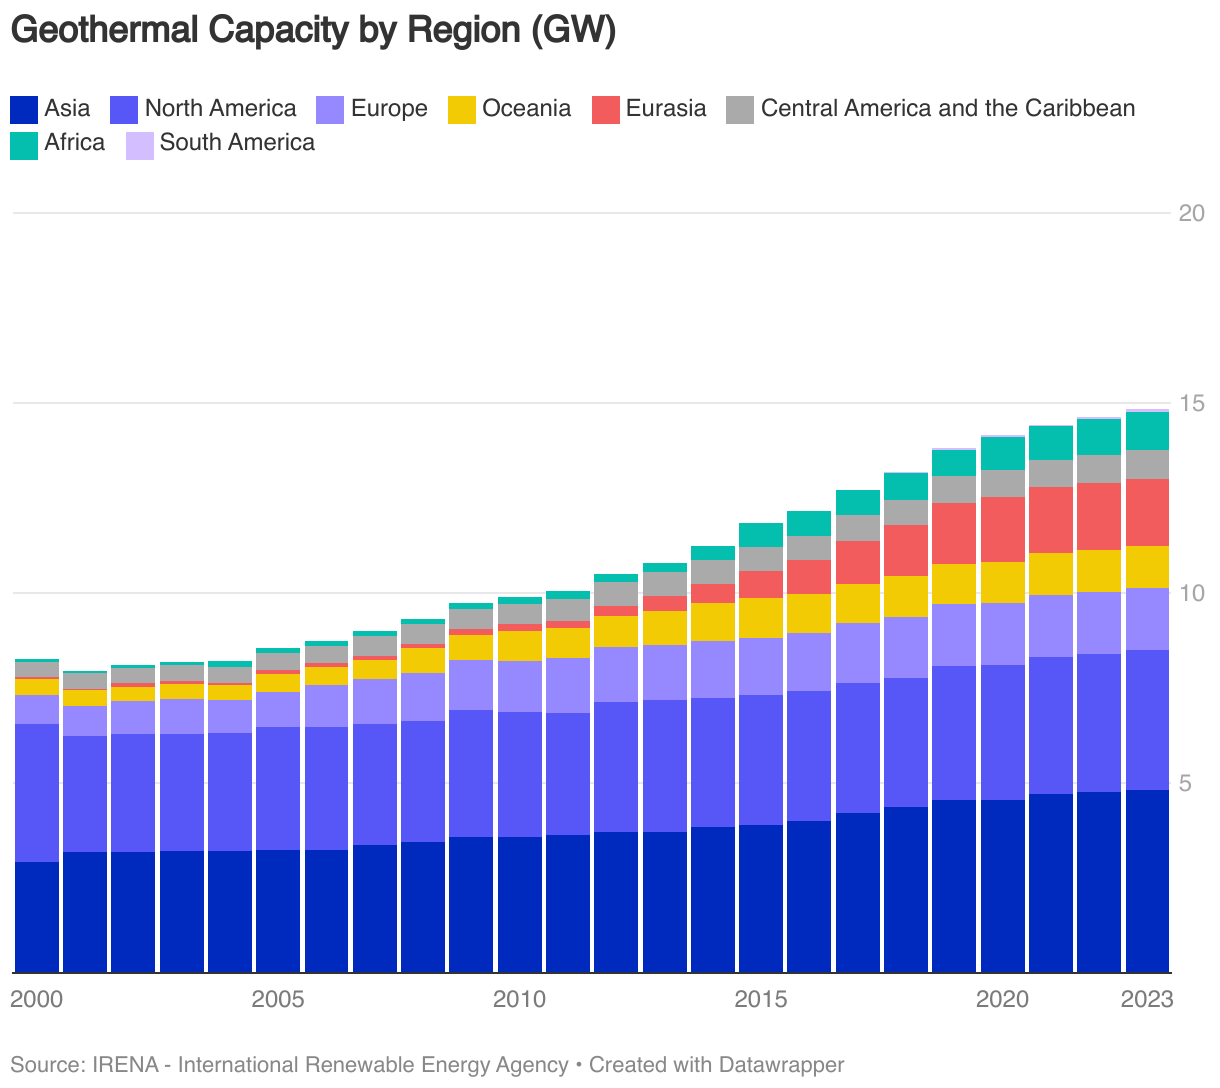
In 2023, global geothermal capacity reached approximately 15 GW, an increase of 0.2 GW from 2022. This accounted for roughly 0.4% of the world’s total renewable energy capacity in 2023. Over the past few years, net added geothermal capacity has slowed.
Key Nations and Regions
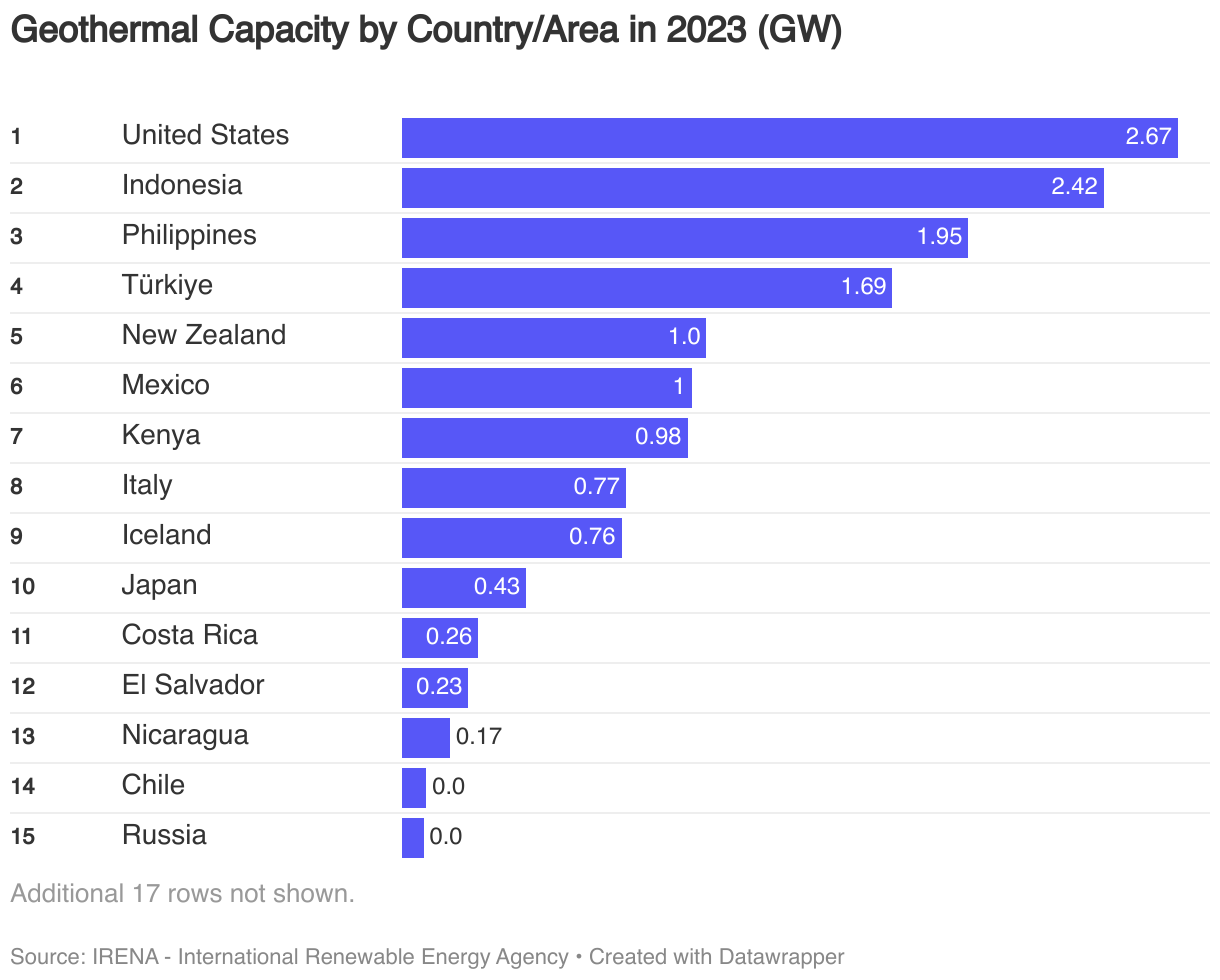
The United States is the world’s leading nation in terms of geothermal energy capacity, followed by Indonesia, the Philippines, Türkiye, New Zealand, and Mexico.
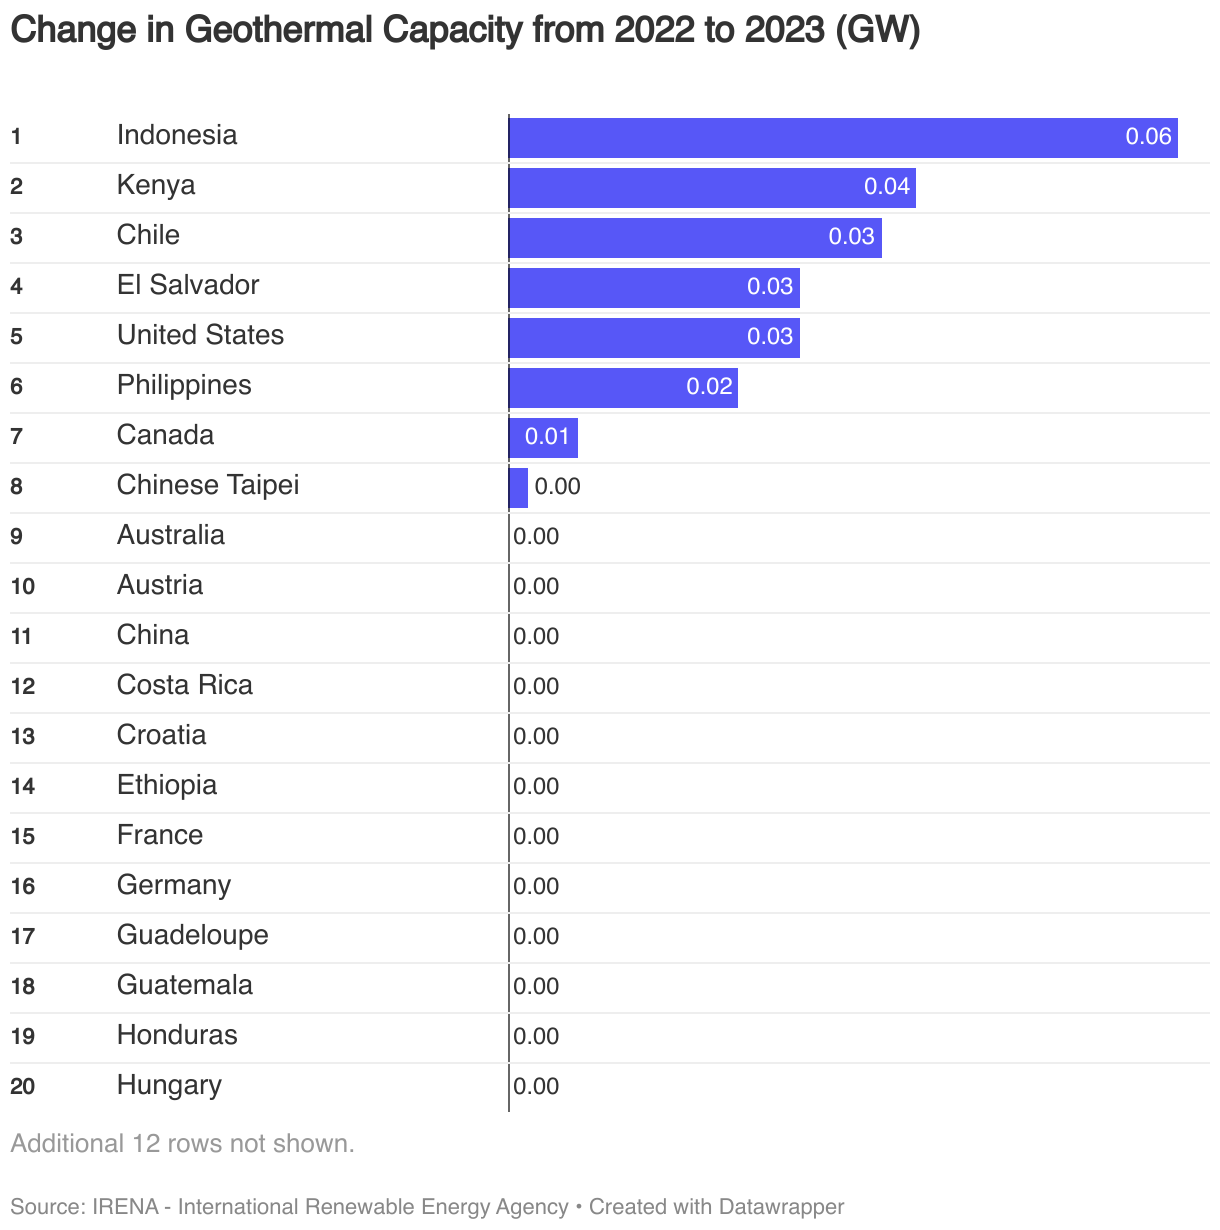
In 2023, the majority of net additional capacity occurred in Indonesia, Kenya and Chile.
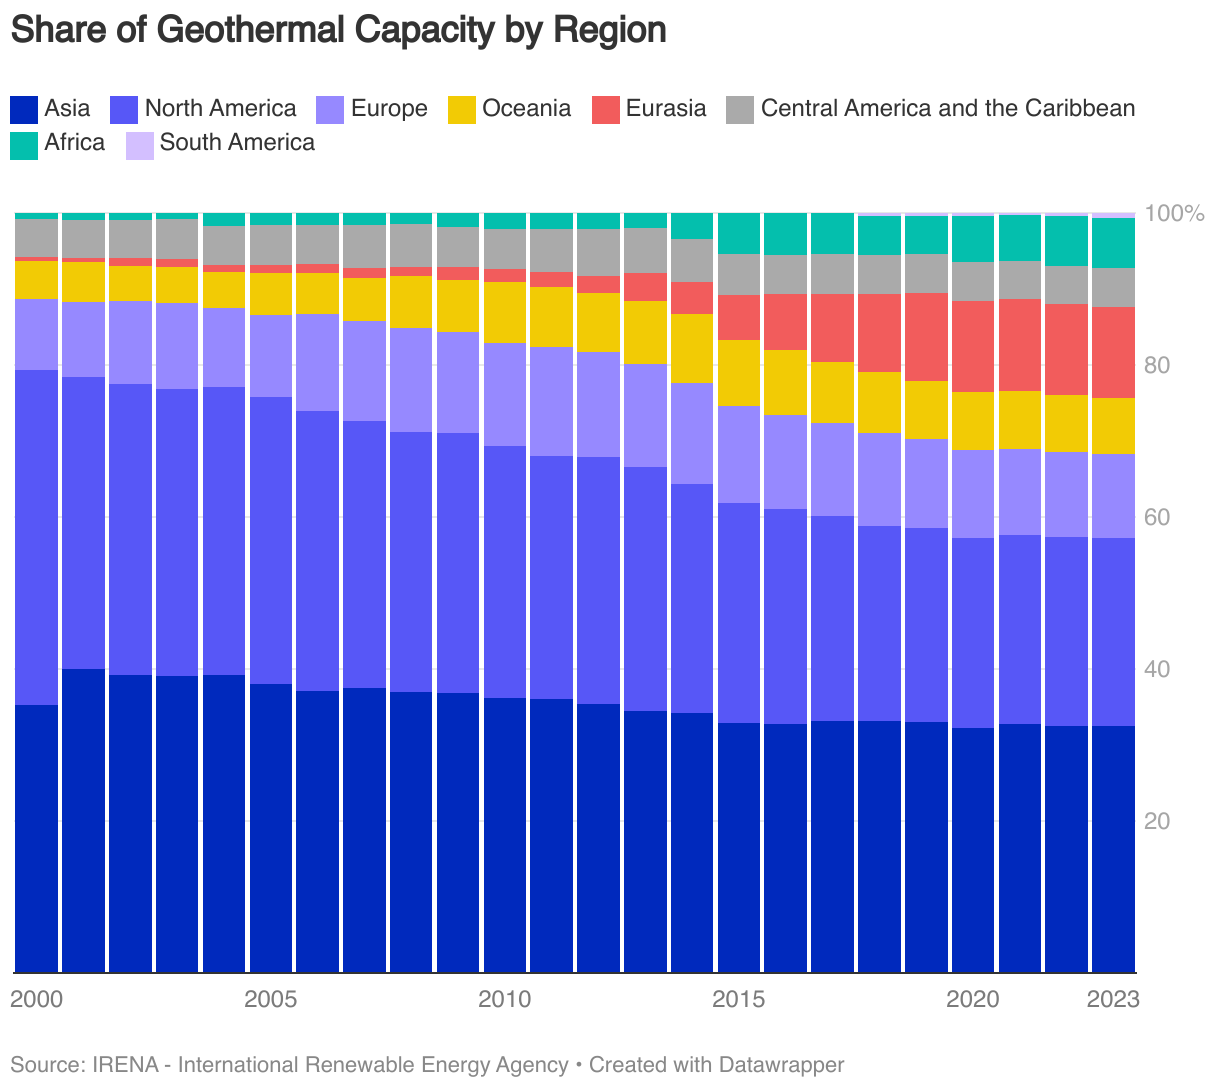
Asia and North America are the two largest regions in terms of geothermal capacity, together accounting for more than half of worldwide capacity in 2023.
About the data
The data presented on this page is sourced from IRENA – International Renewable Energy Agency, IRENA Renewable Energy Statistics database. Data is copyright © IRENA 2024.
Renewable power-generation capacity statistics are released by IRENA annually in March.
Regional Groupings
Data from IRENA on renewable capacity is based on the following regional groupings:
Asia: Afghanistan, Bangladesh, Bhutan, Brunei Darussalam, Cambodia, People’s Republic of China, Democratic People’s Republic of Korea, India, Indonesia, Japan, Kazakhstan, Kyrgyzstan, Lao People’s Democratic Republic, Malaysia, Maldives, Mongolia, Myanmar, Nepal, Pakistan, Philippines, Republic of Korea, Singapore, Sri Lanka, Tajikistan, Thailand, Timor-Leste, Turkmenistan, Uzbekistan, Viet Nam.
Africa: Algeria, Angola, Benin, Botswana, Burkina Faso, Burundi, Cabo Verde, Cameroon, Central African Republic, Chad, Comoros, Congo, Côte d’Ivoire, Democratic Republic of the Congo, Djibouti, Egypt, Equatorial Guinea, Eritrea, Ethiopia, Eswatini, Gabon, Gambia, Ghana, Guinea, Guinea- Bissau, Kenya, Lesotho, Liberia, Libya, Madagascar, Malawi, Mali, Mauritania, Mauritius, Morocco, Mozambique, Namibia, Niger, Nigeria, Rwanda, Sao Tome and Principe, Senegal, Seychelles, Sierra Leone, Somalia, South Africa, South Sudan, Sudan, Togo, Tunisia, Uganda, United Republic of Tanzania, Zambia, Zimbabwe.
Central America and the Caribbean: Antigua and Barbuda, Bahamas, Barbados, Belize, Costa Rica, Cuba, Dominica, Dominican Republic, El Salvador, Grenada, Guatemala, Haiti, Honduras, Jamaica, Nicaragua, Panama, Saint Kitts and Nevis, Saint Lucia, Saint Vincent and the Grenadines, Trinidad and Tobago.
Eurasia: Armenia, Azerbaijan, Georgia, Russian Federation, Türkiye.
Europe: Albania, Andorra, Austria, Belarus, Belgium, Bosnia and Herzegovina, Bulgaria, Croatia, Cyprus, Czech Republic, Denmark, Estonia, Finland, France, Germany, Greece, Hungary, Iceland, Ireland, Italy, Latvia, Liechtenstein, Lithuania, Luxembourg, Malta, Monaco, Montenegro, Kingdom of the Netherlands, Norway, Poland, Portugal, Republic of Moldova, Romania, San Marino, Serbia, Slovakia, Slovenia, Spain, Sweden, Switzerland, Ukraine, United Kingdom.
Middle East: Bahrain, Islamic Republic of Iran, Iraq, Israel, Jordan, Kuwait, Lebanon, Oman, Qatar, Saudi Arabia, Syrian Arab Republic, United Arab Emirates, Yemen.
North America: Canada, Mexico, United States.
Oceania: Australia, Fiji, Kiribati, Marshall Islands, Micronesia (Federated States of), Nauru, New Zealand, Palau, Papua New Guinea, Samoa, Solomon Islands, Tonga, Tuvalu, Vanuatu.
South America: Argentina, Bolivia (Plurinational State of), Brazil, Chile, Colombia, Ecuador, Guyana, Paraguay, Peru, Suriname, Uruguay, Venezuela (Bolivarian Republic of).
Changelog
- Updated in March 2024 with new IRENA data for 2023.
- Updated in August 2023 with revised IRENA data for 2022.
- First version of this page was released in June 2023, with IRENA data covering 2000 up until the end of 2022.