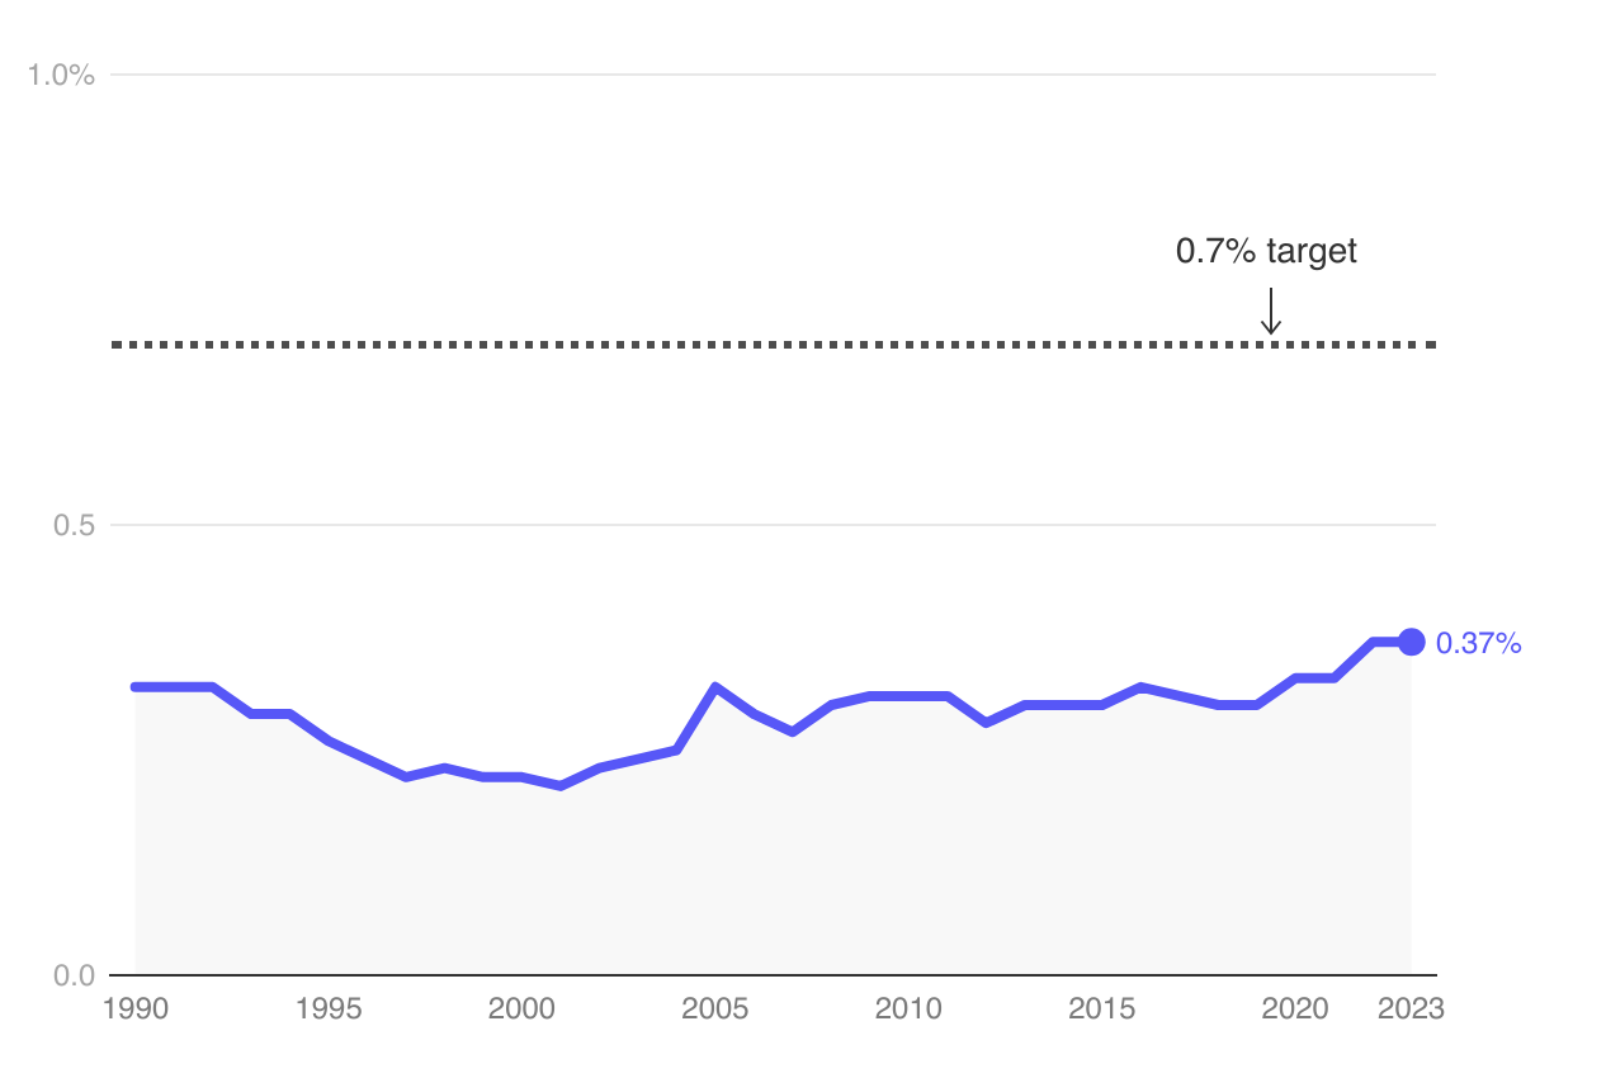
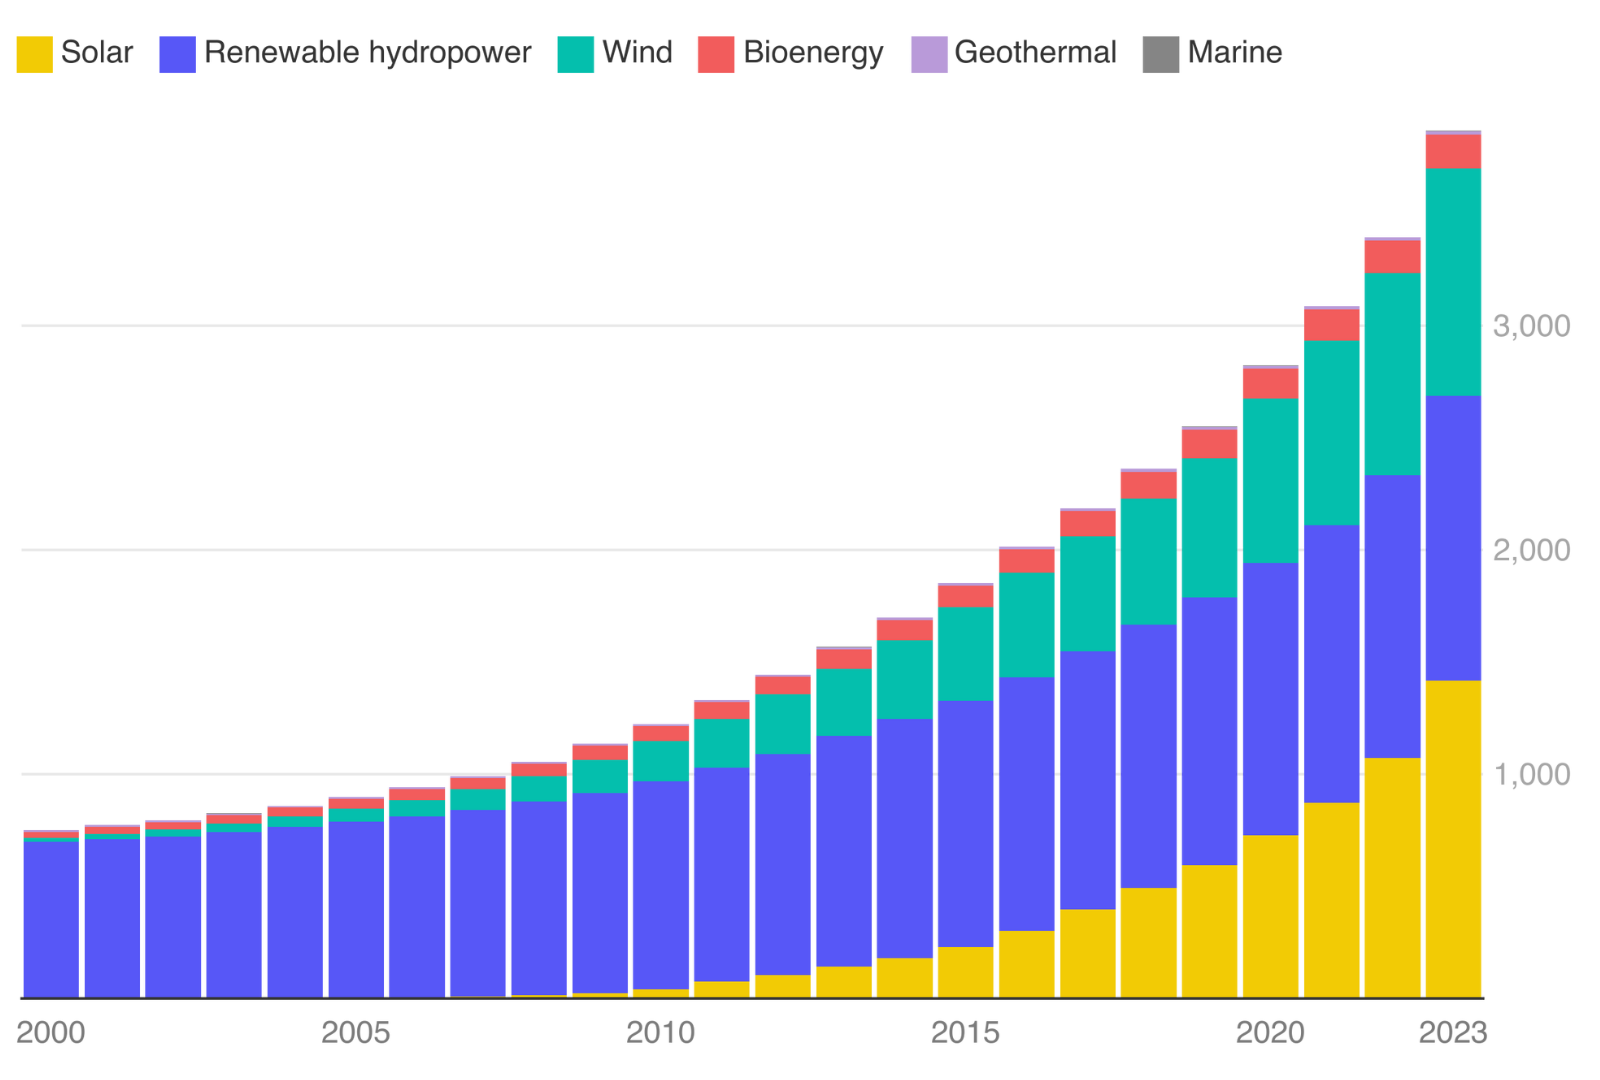
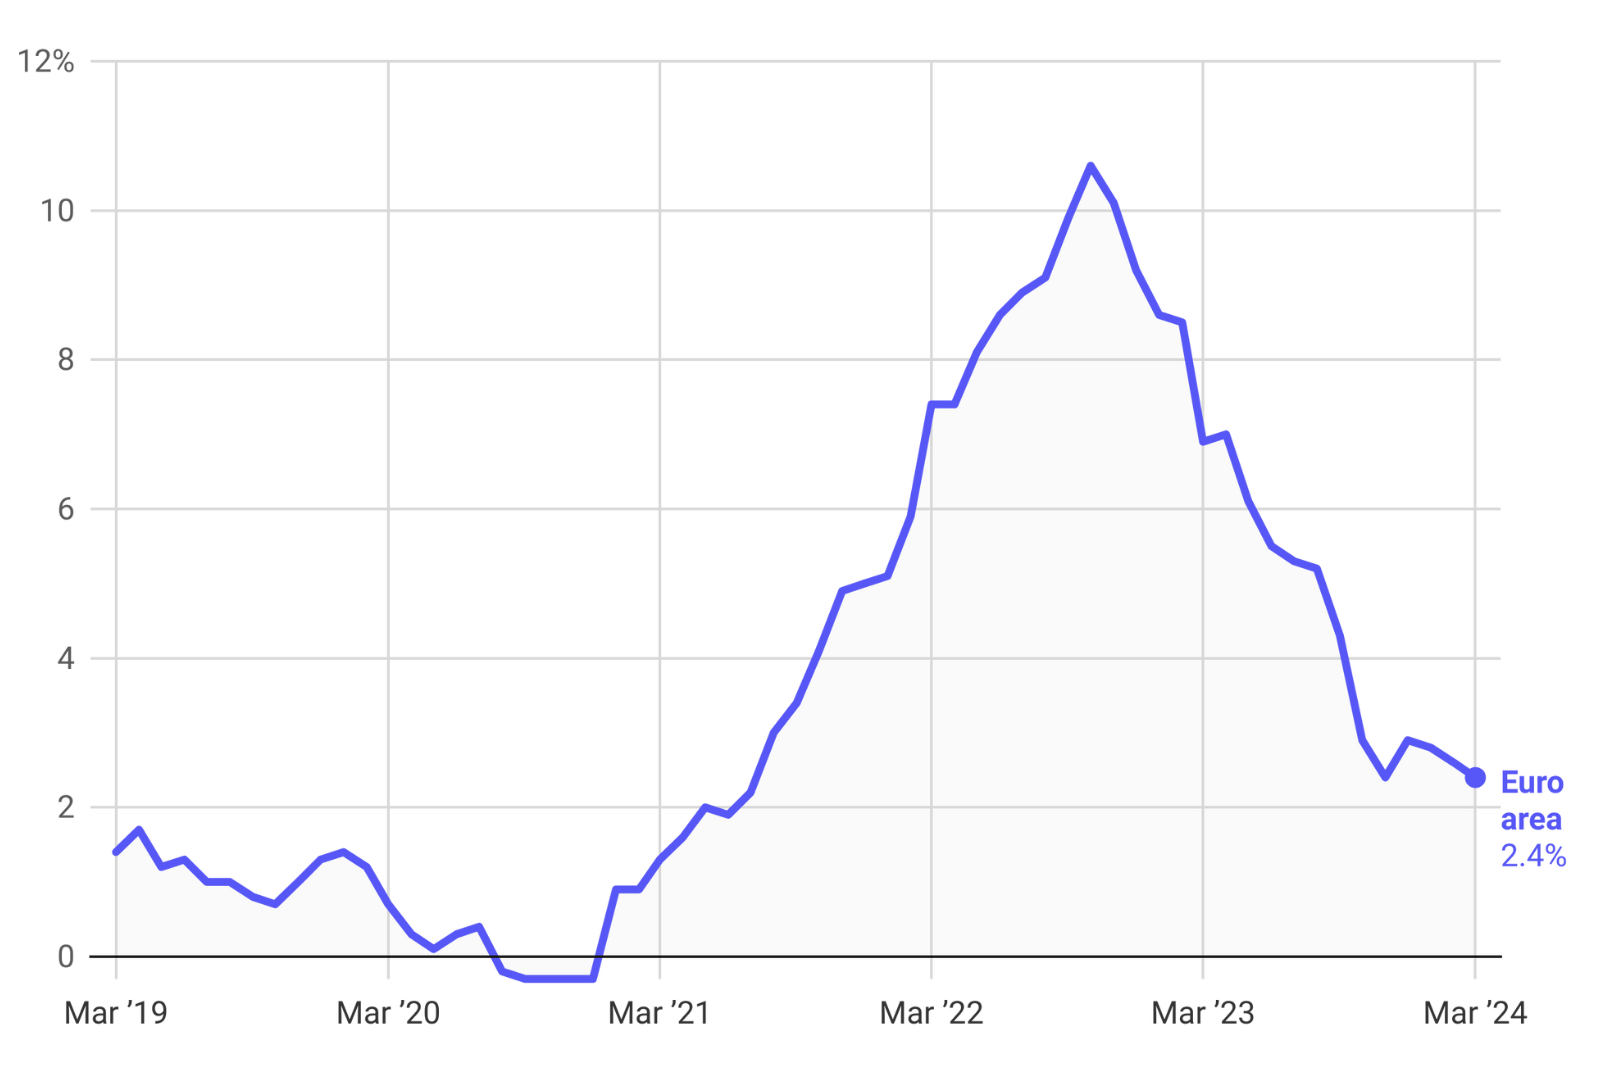
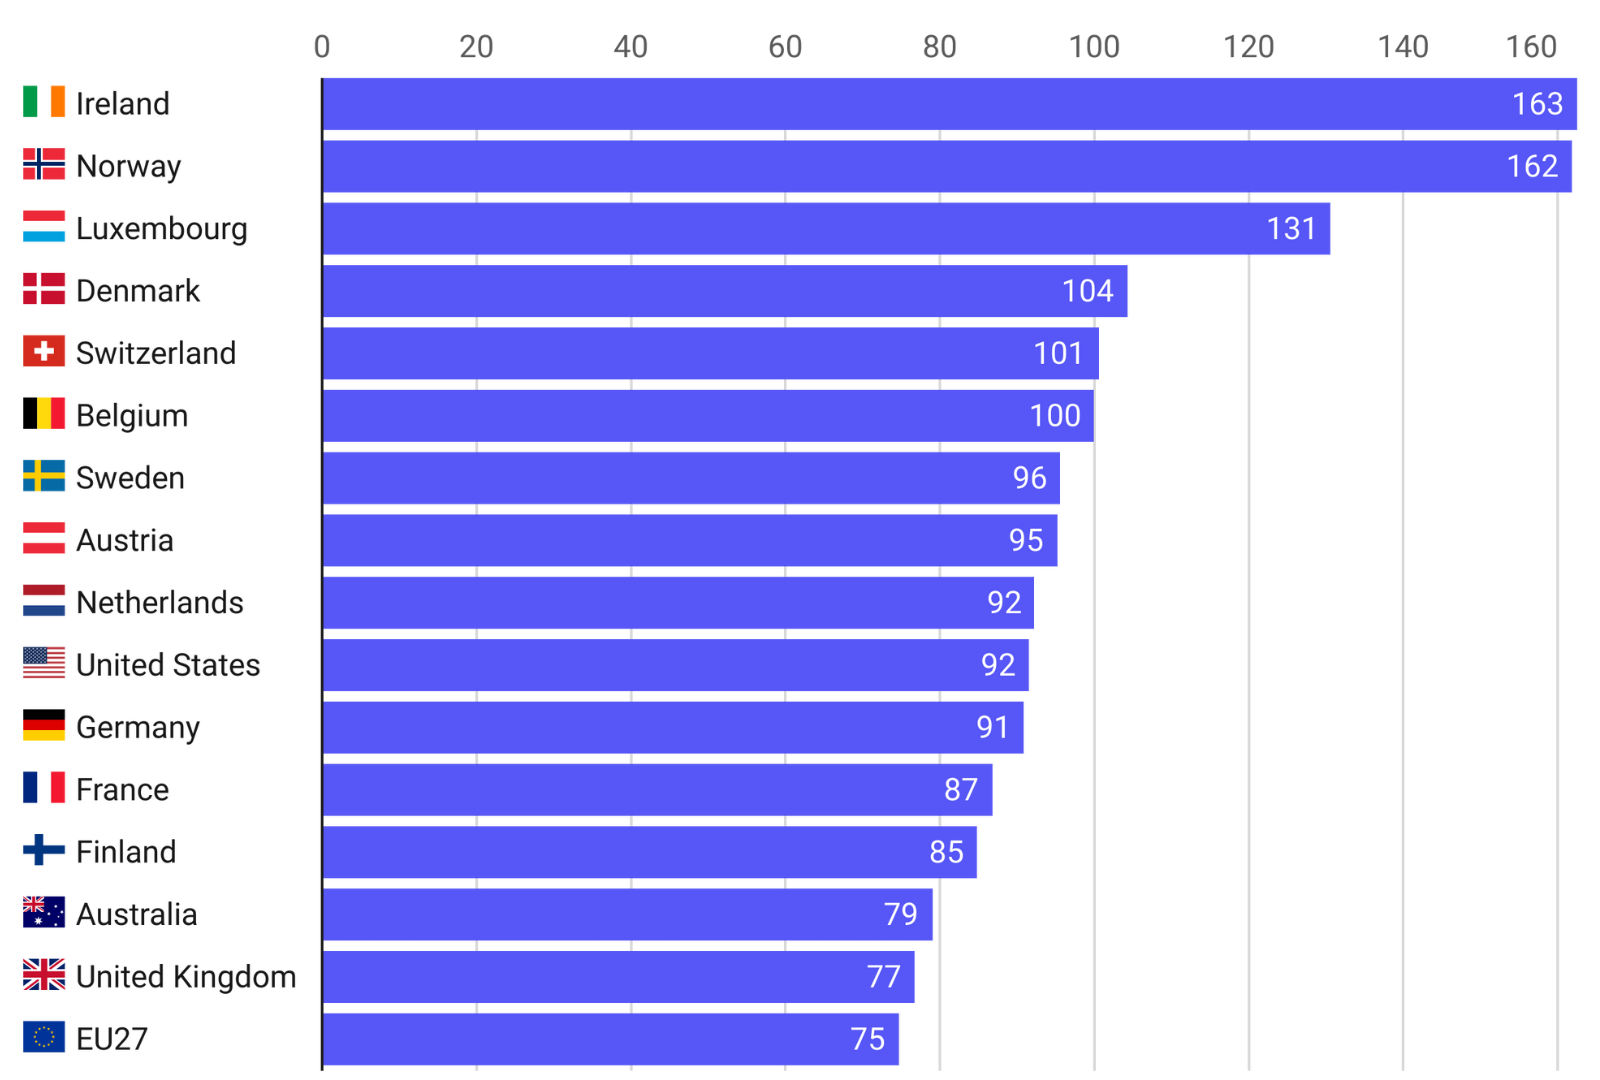
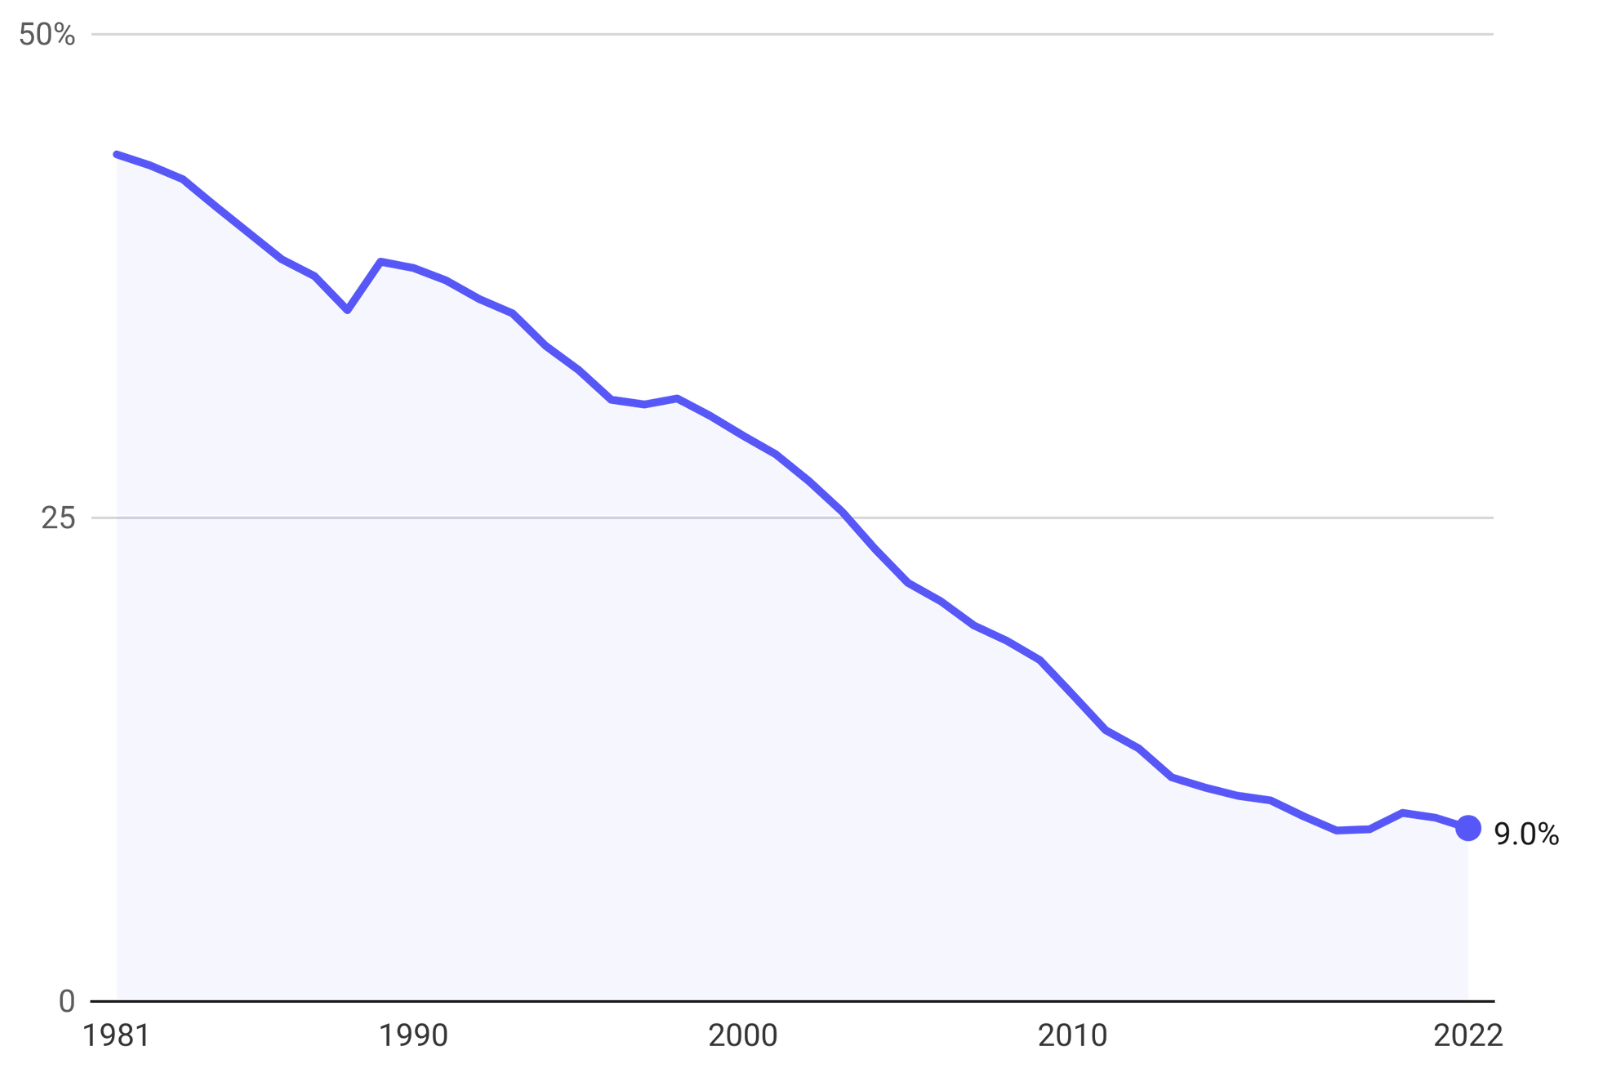
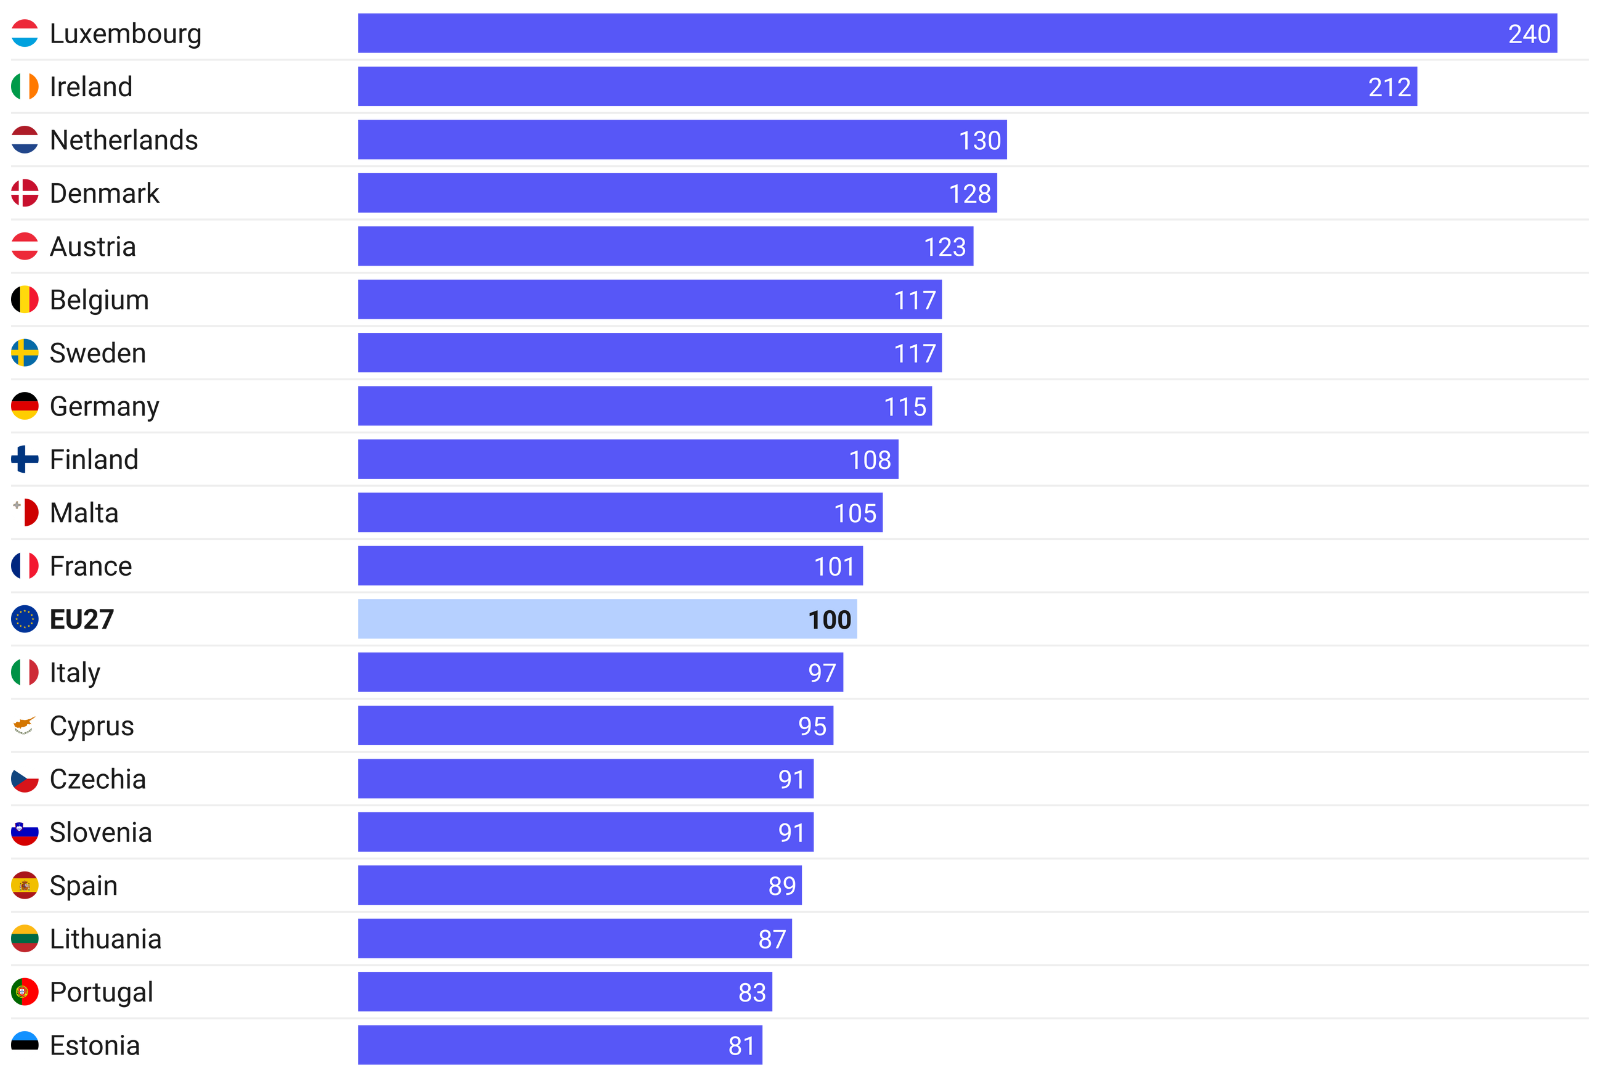
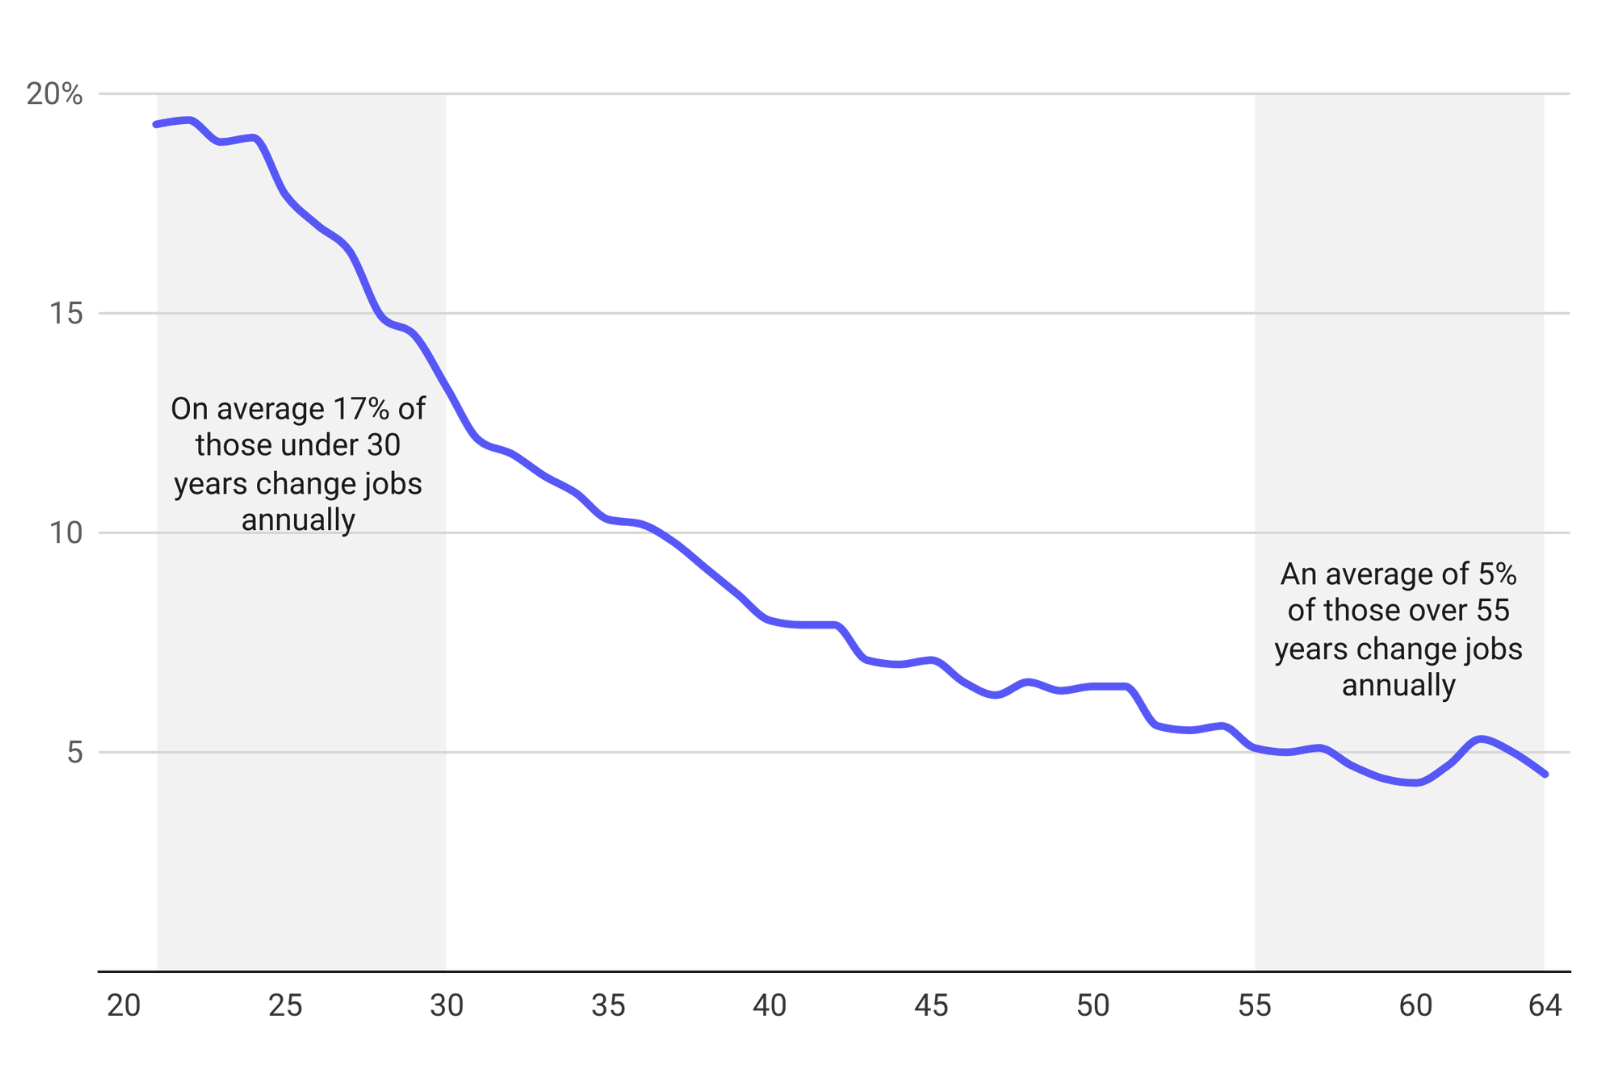
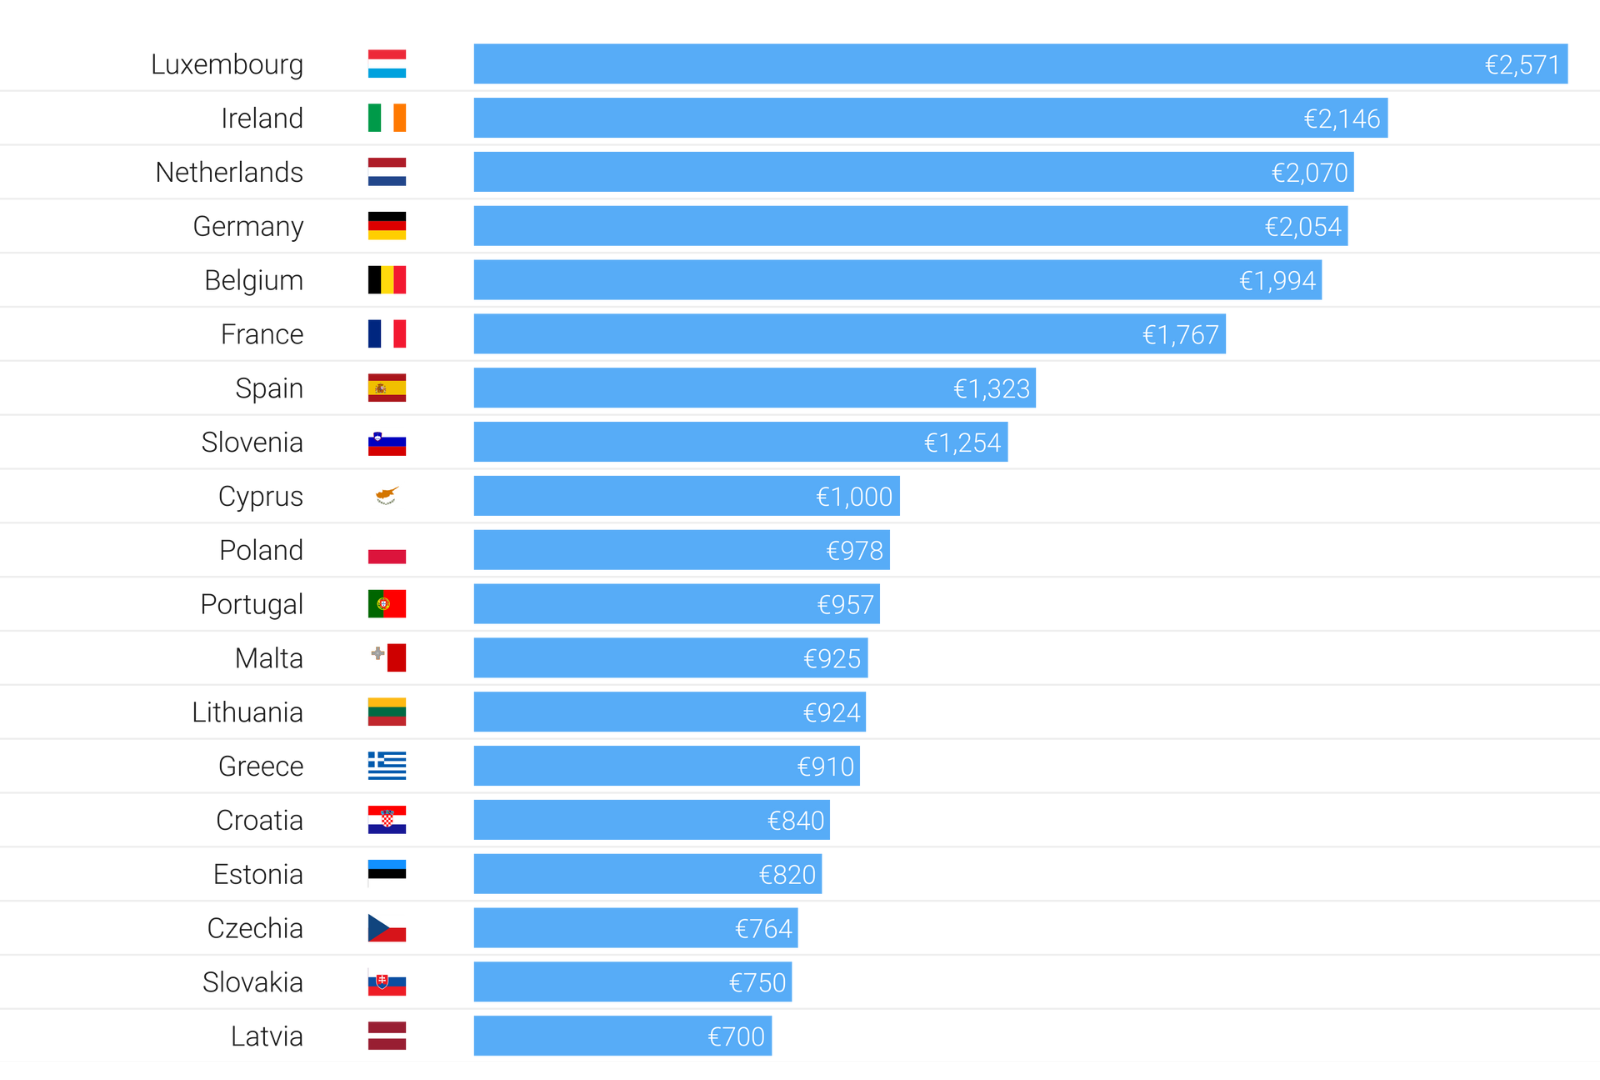
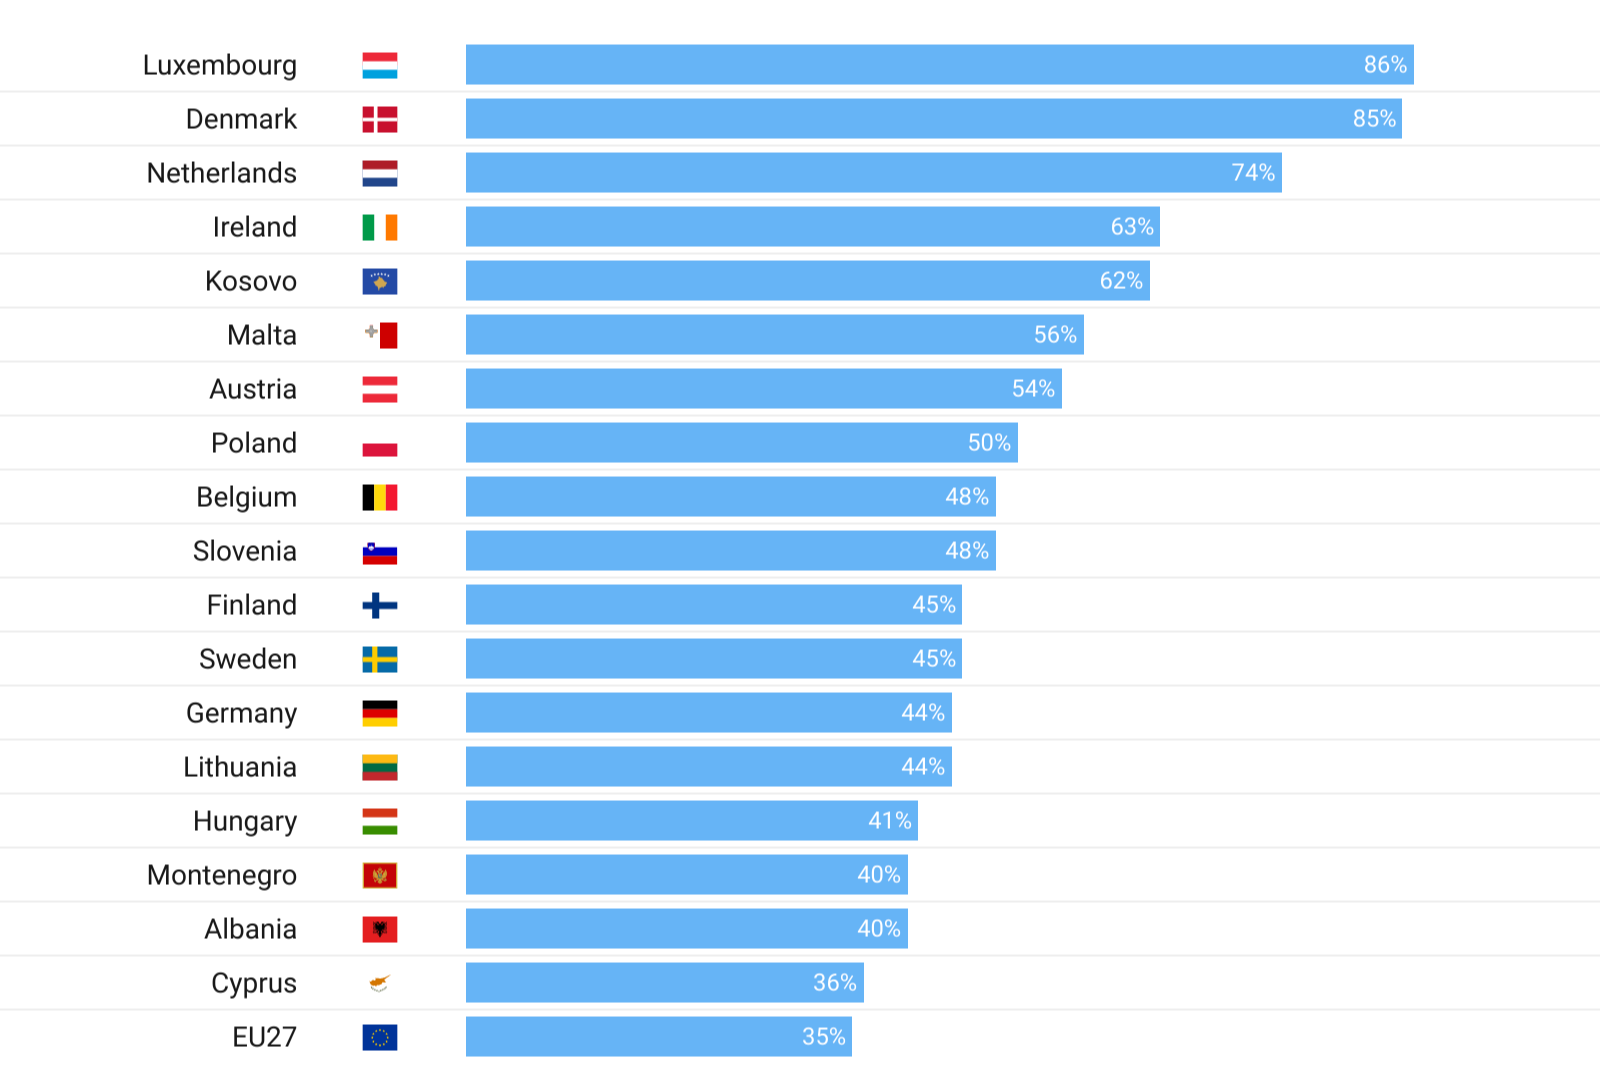
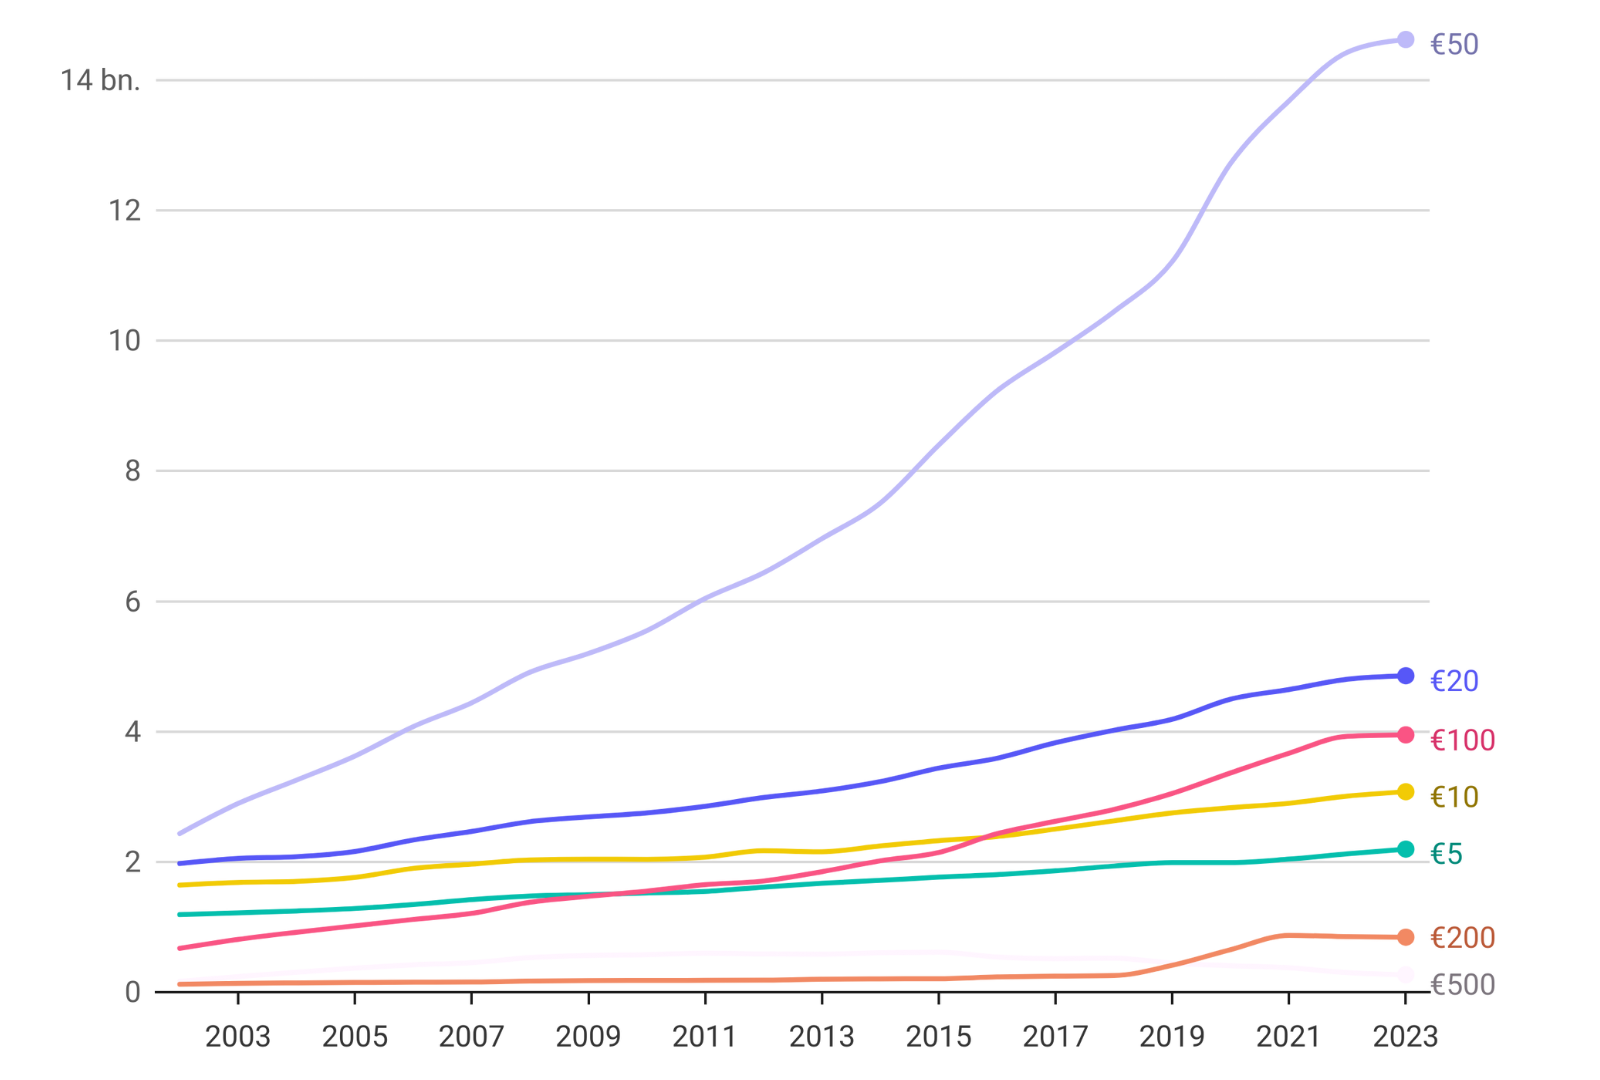
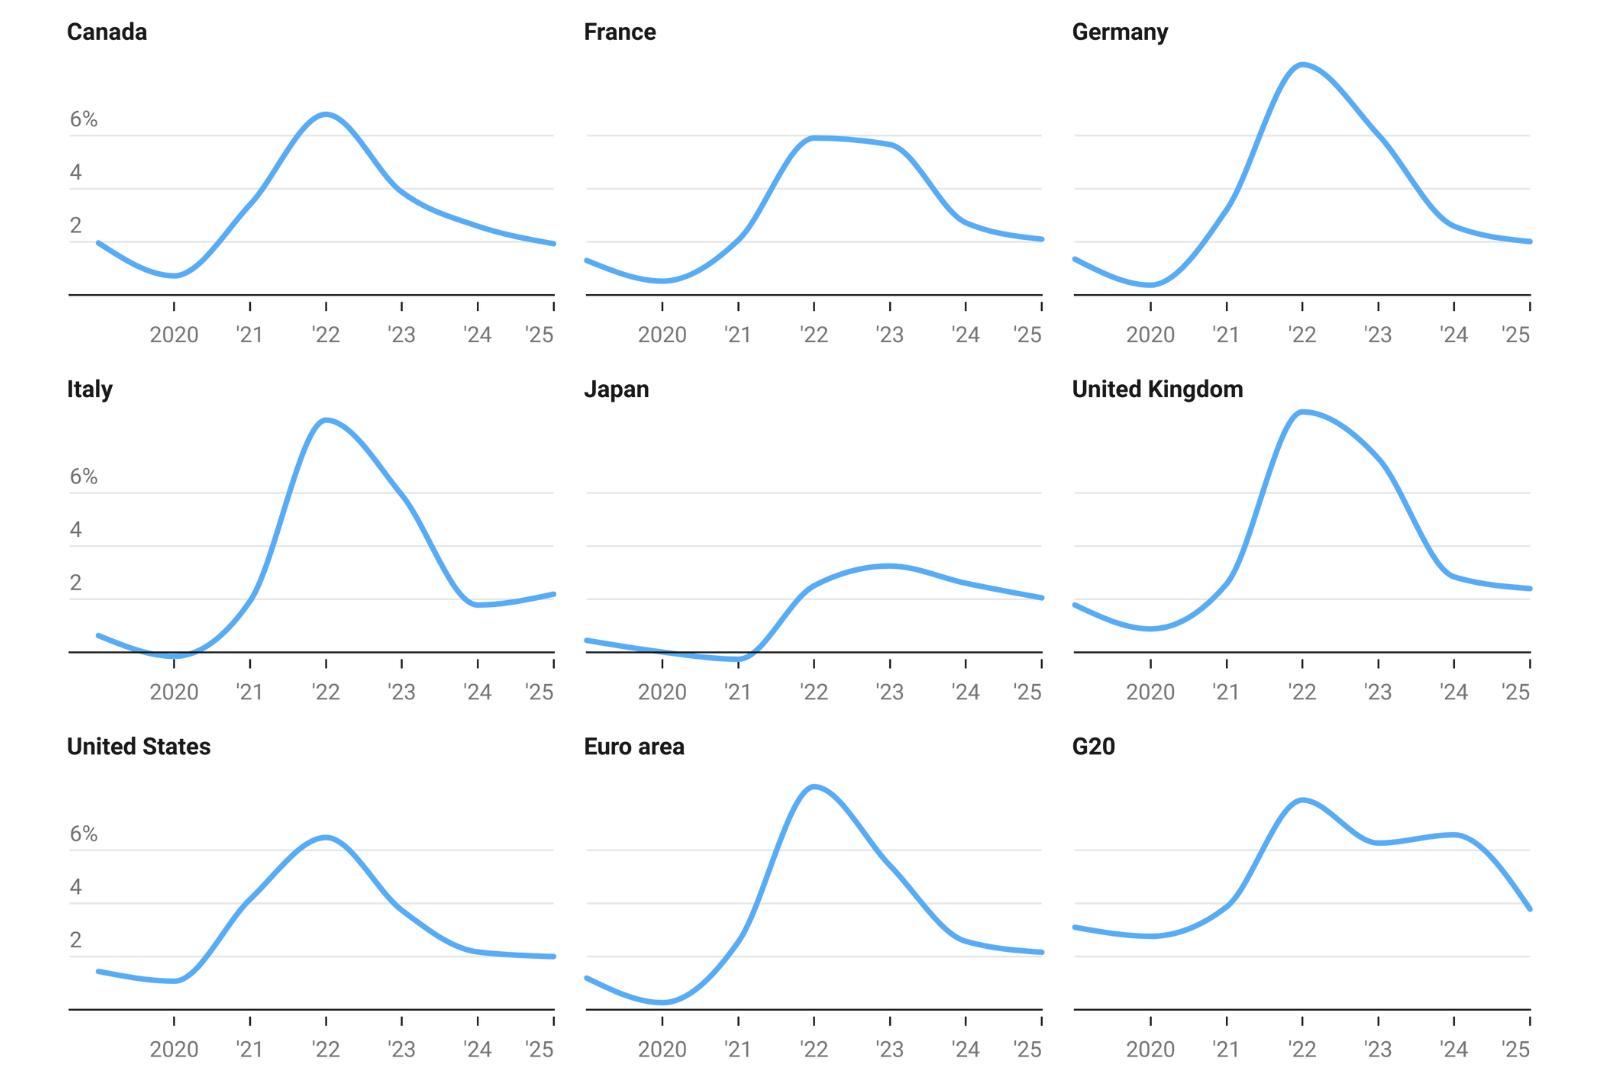
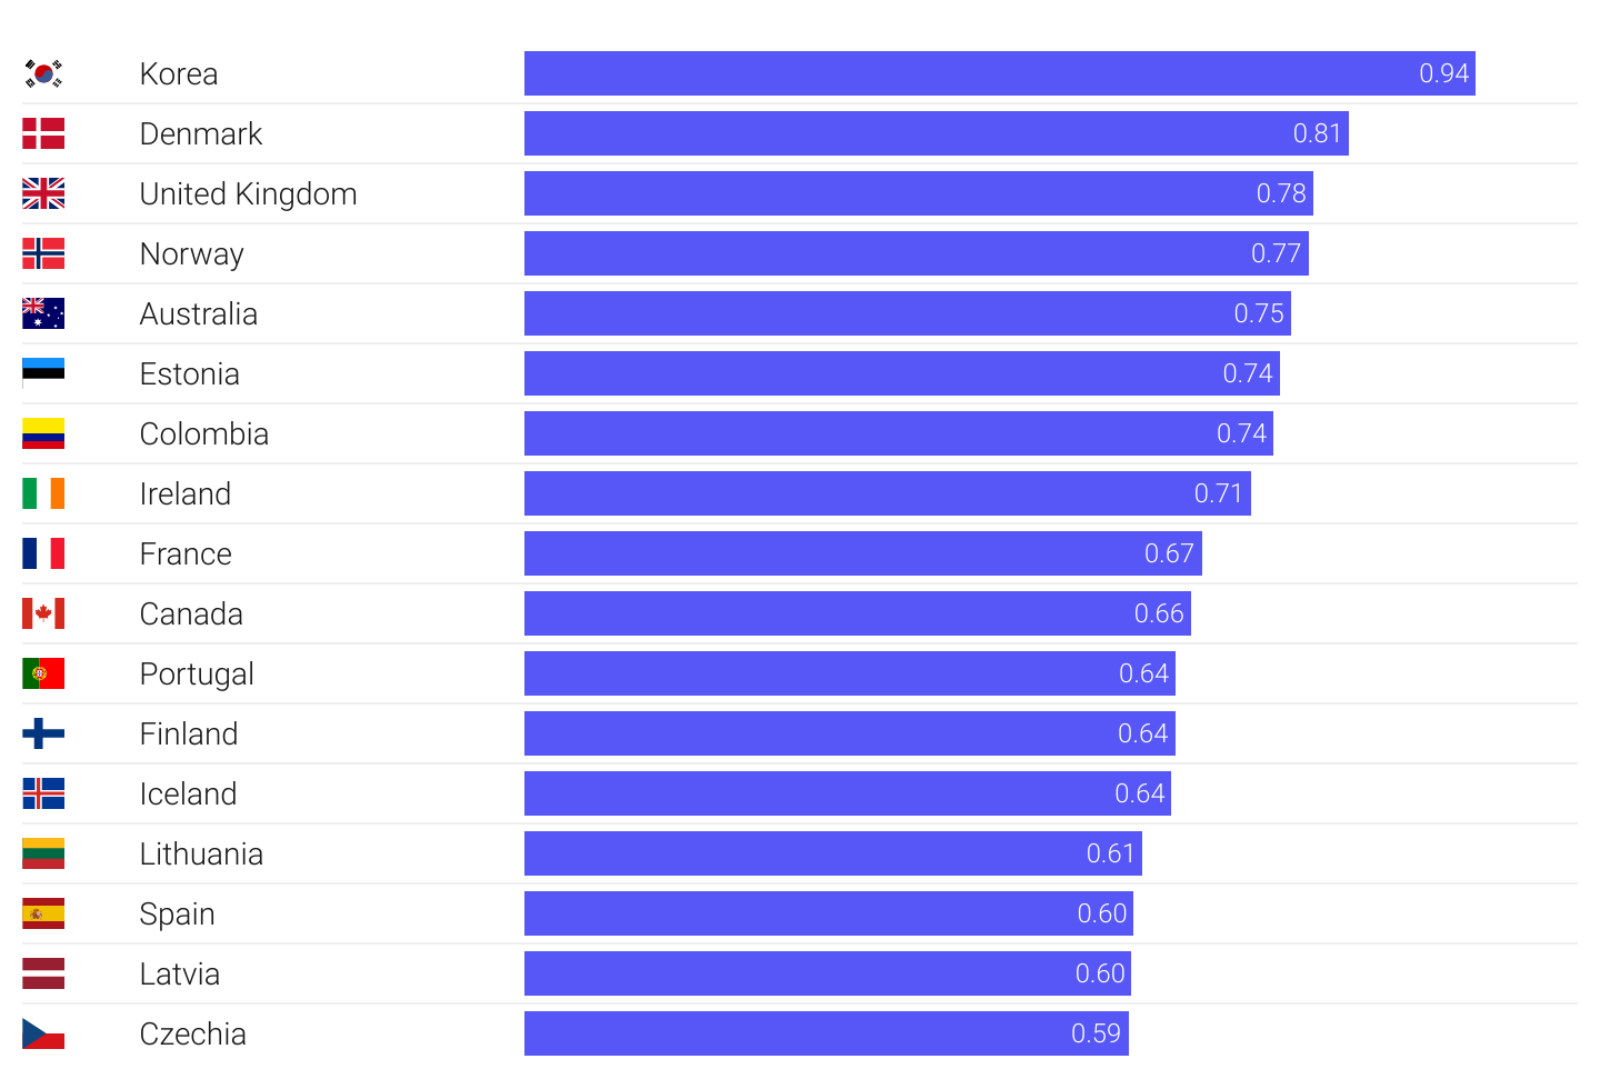
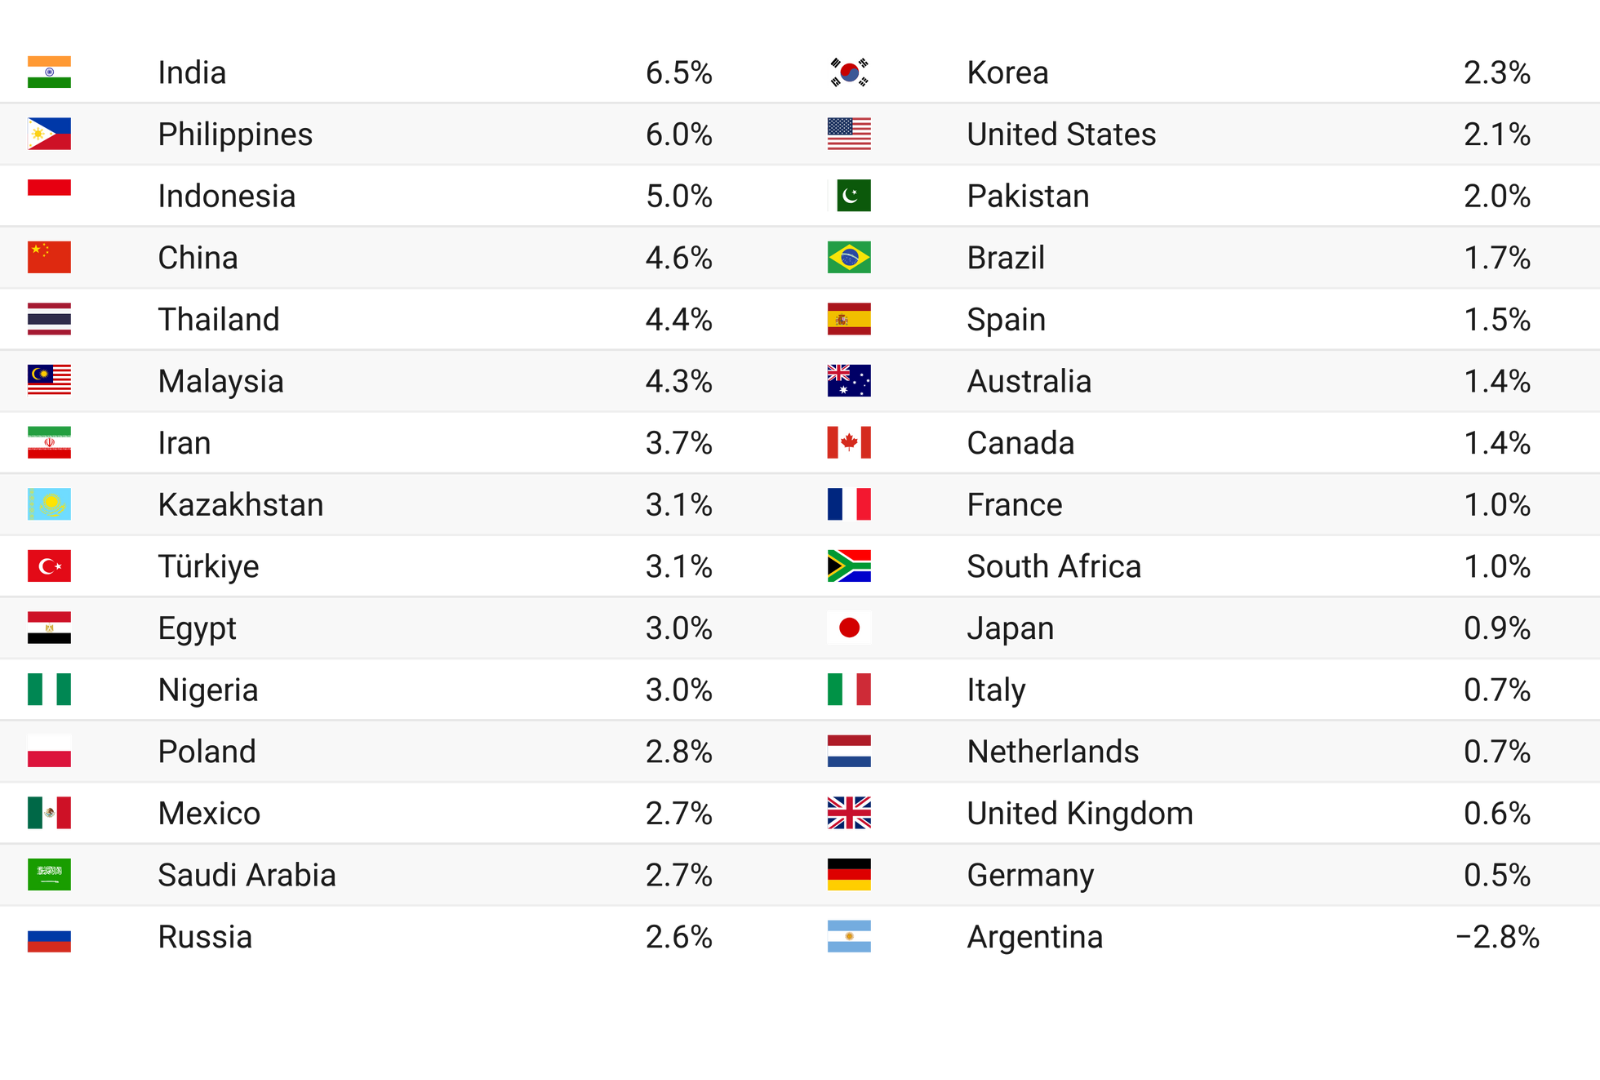
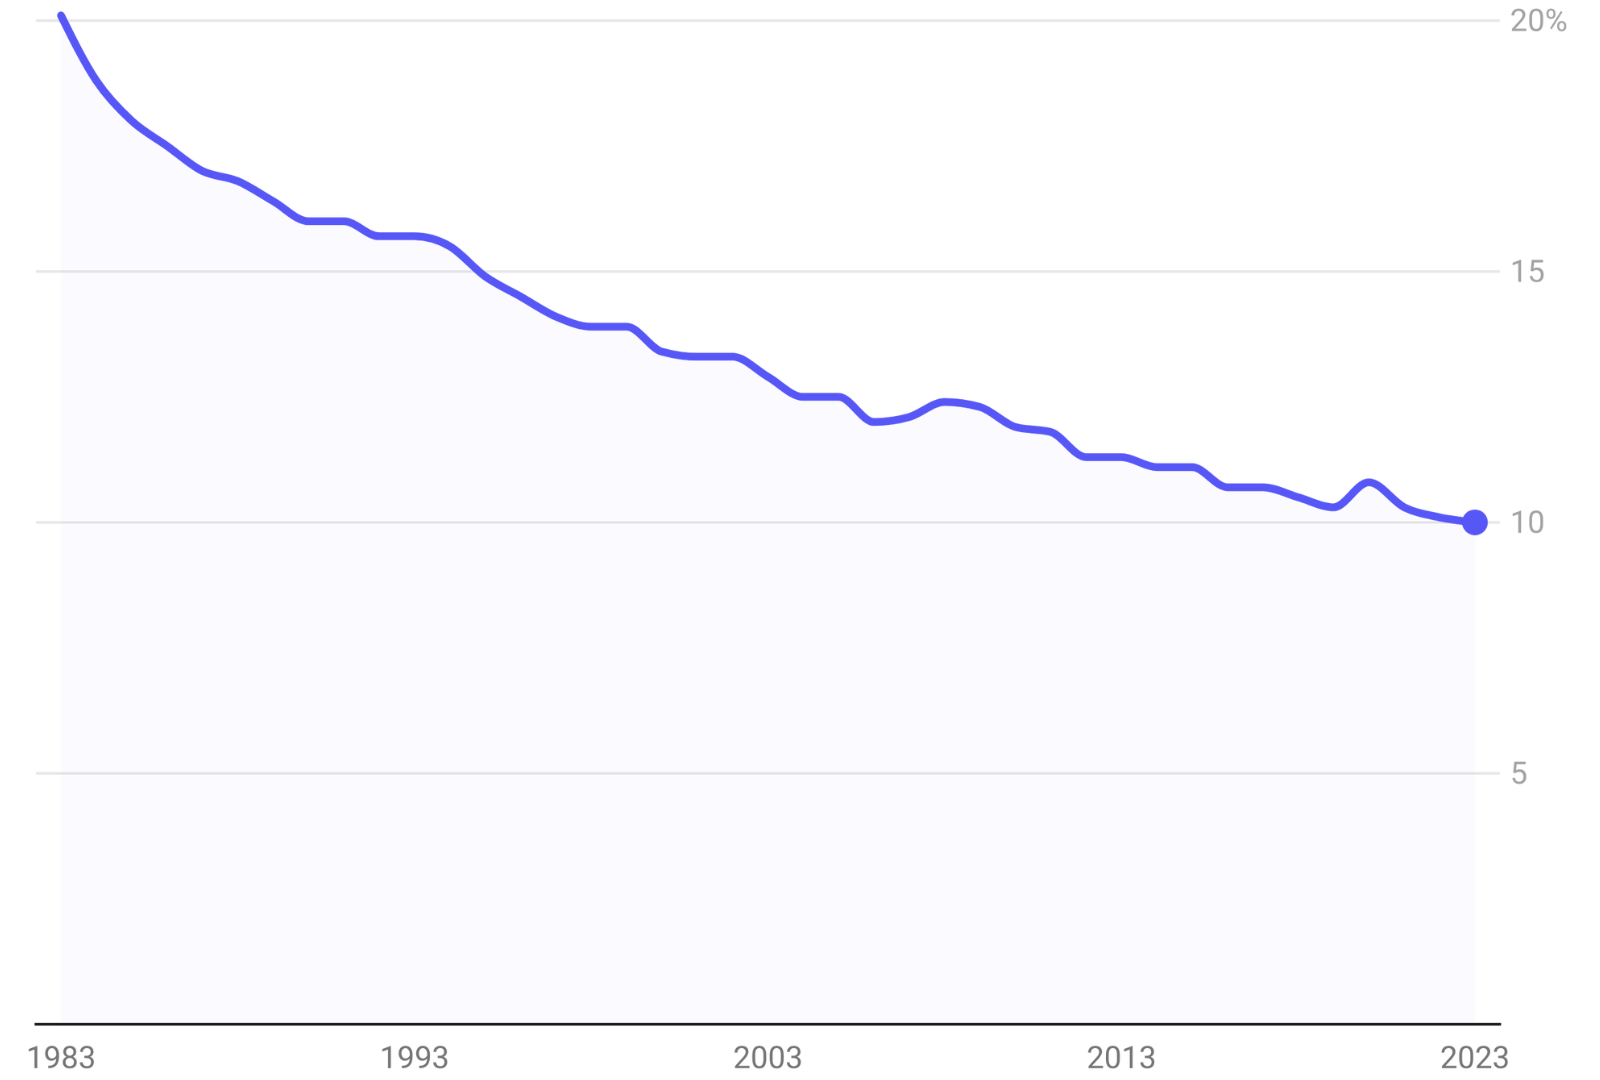
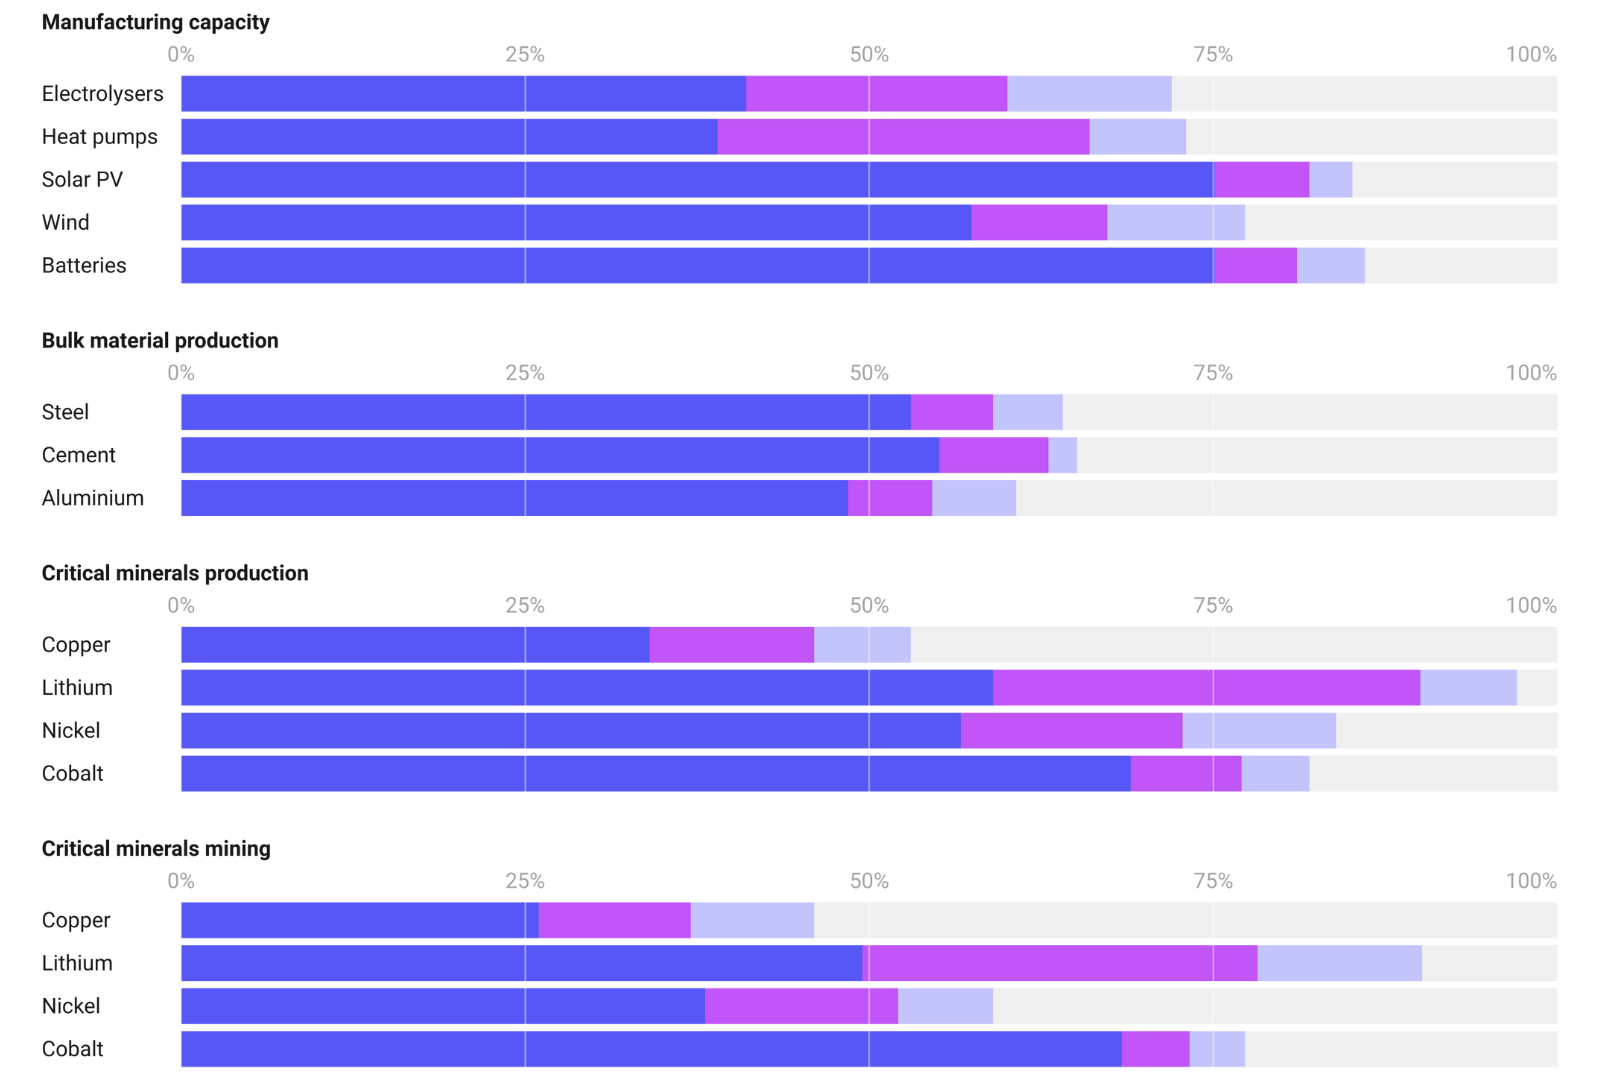
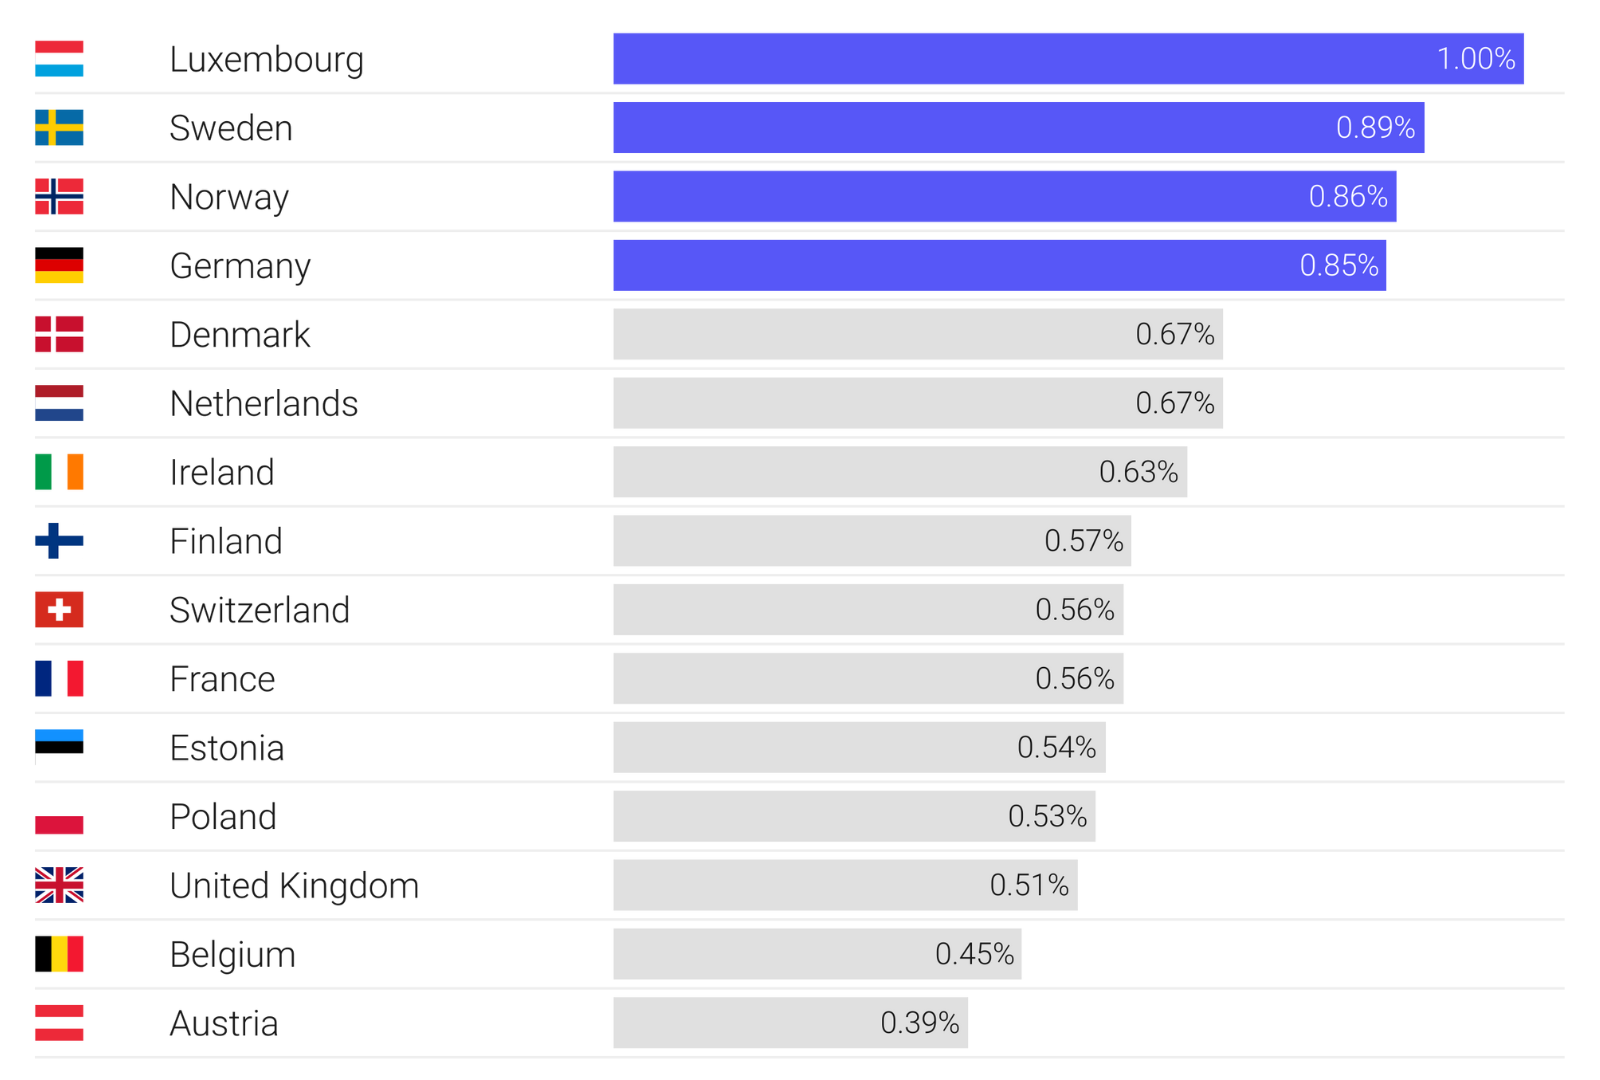
Data Spotlights

Explore a selection of concise briefs on selected social and economic insights.
Labour Markets
May 2023

New businesses opening with fewer employees

Data from the U.S. Bureau of Labor Statistics (BLS) shows that while the number of new establishments created each quarter is increasing, the jobs they generate have been decreasing since the late ’90s. The average new establishment currently employs half as new establishments did 30 years ago, a phenomenon identified as the shrinking ‘birth weight’ of start-ups.

This is significant for job creation in the US economy as new businesses – specifically those less than a year old – are key drivers behind net job gains in the US economy, according to the BLS.

The decline in jobs is visible during the early years of a business’s life. Businesses born in the 2010s employ fewer people at 1-, 3-, and 5-year marks compared to those born in the 1990s. For example, start-ups from 1994 that survived five years grew to an average of 13.2 employees. In contrast, those born in 2017 that survived the same period grew to an average of only 8.2 employees.

Energy Transition
May 2023

Renewable power capacity expansion at record high in 2022

Renewables accounted for 83% (295 GW) of all new power capacity added worldwide in 2022, a significant increase from 78% in 2021, according to the International Renewable Energy Agency (IRENA). The strong surge meant that renewables’ overall share of global power capacity also increased, reaching above 40% (3372 GW) up from 38% in 2021.

Leading the charge was China, followed by the United States, although numerous other countries also stepped up their expansion of renewable capacity. Renewables comprise hydropower, wind energy, solar energy, bioenergy, geothermal energy.

Commenting on the data, IRENA said that: “The strong business case of renewables coupled with enabling policies has sustained an upward trend of their share in the global energy mix year on year. But annual additions of renewable power capacity must grow three times the current level by 2030, if we want to stay on a pathway limiting global warming to 1.5°C.”

Gender Equality
May 2023

Gender Equality Could Boost GDP Over 9% by 2060 Across OECD Countries

Closing gender gaps in labour force participation and working hours can have a significant economic impact. According to OECD projections, achieving gender equality in these areas could boost the average annual GDP per capita growth rate across member countries by 0.23 percentage points each year. So, what does this mean in the long term? By 2060, this could lead to a 9.2% overall increase in GDP across OECD-economies.

The benefits of closing gender gaps can be vast, but they are not uniform across all countries – the potential gains are largely determined by the extent of existing gender inequalities in each nation.

Colombia, Costa Rica, and Türkiye, for instance, could see their annual GDP growth bolstered by more than 0.40 percentage points – equating to a projected economic output 17-20% higher than 2060 OECD baseline estimates. Mexico’s outlook shows a potential additional 0.52 percentage points in annual output growth, yielding a 22% rise in its GDP in 2060.

Countries with smaller gender gaps will also see gains, though their boosts might be more modest. OECD estimates that Latvia, Lithuania, and Slovenia could anticipate an uptick of 0.06 to 0.08 percentage points in annual GDP growth, translating into a 2-3% increase in their 2060 economic output.

Labour Markets
May 2023

The Impact of Collective Bargaining Coverage on Labour Income Shares

Higher collective bargaining coverage tends to yield larger labour income shares, according to the ILO. The chart, reproduced from ILOSTAT’s latest article delving deeper into collective bargaining, illustrates this positive relationship with data for 99 countries, categorized by institutional setting (the level at which collective bargaining occurs). Countries with multi-employer bargaining generally have higher rates.

Key section from the ILOSTAT article on why this matters:

“Economic literature suggests that countries with higher coverage rates of collective bargaining tend to have a larger share of national income going to workers. This association is also supported by various editions of the ILO Global Wage Report, which highlights how wage bargaining can support wage growth that is in line with growth in productivity. Wage growth and reduced income inequalities lead to higher domestic demand due to the higher propensity to consume among low-income earners most likely to benefit from collective agreements. In this respect, collective bargaining can support both economic growth and a fairer distribution of income.”

Global Economic Outlook
May 2023

Asia and Pacific: Key Contributors to Global Economic Growth in 2023

Amidst a challenging global economic landscape in 2023, Asia and the Pacific are anticipated to be the most dynamic economic regions among the world’s major areas in 2023 driven by a strong outlook for China and India.

According to the IMF, these two large emerging market economies are expected to contribute around 50% of global economic growth this year, while the rest of Asia and Pacific will add an additional 20%. The IMF projects the region’s growth to increase to 4.6 percent, up from 3.8 in 2022.

Development Assistance
April 2023

Official Development Assistance Surges in 2022

Official Development Assistance (ODA) is financial aid provided by governments and other official organizations to developing countries, with the primary goal of promoting economic development and reducing poverty. ODA is typically provided in the form of grants or low-interest loans and can be used for a wide range of purposes, including infrastructure development, healthcare and education initiatives, and disaster relief.

In 2022, ODA reached a total of $204 billion, marking a 13.6% increase from the previous year. The primary driver for this growth was the spending on processing and hosting refugees within donor countries, which rose to $29.3 billion, accounting for 14.4% of ODA. Excluding these “in-donor” refugee costs, 2022 ODA still experienced a 4.6% growth in real terms over 2021.

Another significant contributor to the increase in foreign aid was a substantial rise in aid to Ukraine following Russia’s invasion. In 2022, ODA to Ukraine totaled $16.1 billion, a significant increase from $918 million in 2021, which included $1.8 billion in humanitarian aid.

The United States was the largest donor of official development assistance in 2022, followed by Germany and the EU institutions. While the total ODA provided by DAC (Development Assistance Committee) member countries as a percentage of their GNI was 0.36% in 2022, only five countries hit the UN 0.7% aid spending target: Denmark, Germany, Luxembourg, Norway, and Sweden.

Artificial Intelligence
March 2023

GPT-4: Advancements in factuality, but limitations still exists

The release of GPT-4 brings remarkable advancements in language model capabilities. However, it is essential to recognize that the model still has limitations similar to its predecessors. Despite significant improvements in factuality, OpenAI highlights that users must exercise caution, particularly in high-stakes contexts.

OpenAI’s internal factual assessment across nine categories reveals GPT-4 outperforms the latest GPT-3.5 by 19 percentage points (a 40% improvement). A 100% accuracy in the evaluation indicates the model’s answers align with ideal human responses in each category.

Yet despite these advancements OpenAI said in the release that:

“it is not fully reliable (it “hallucinates” facts and makes reasoning errors). Great care should be taken when using language model outputs, particularly in high-stakes contexts, with the exact protocol (such as human review, grounding with additional context, or avoiding high-stakes uses altogether) matching the needs of specific applications.”

Gender Equality
March 2023

The legal gender gap is closing, yet full equality decades away at current pace

The World Bank’s Women, Business and the Law 2023 report is a comprehensive assessment of laws and regulations governing women’s economic participation in 190 economies around the world. The report tracks progress towards legal gender parity in eight key areas: Mobility, Workplace, Pay, Marriage, Parenthood, Entrepreneurship, Assets, and Pension. 

Over the past five decades, the report shows that there has been progress in all eight areas, with the average Women, Business and the Law score improving by about two-thirds during this time. However, globally, women still only enjoy 77 percent of the legal rights that men do. The areas of mobility and entrepreneurship are leading the way in terms of gender equality scores, while the most significant improvements have been made in previously lagging areas such as workplace and assets.

Only 14 economies have achieved legal gender parity. World Bank estimates show that at the current pace of reform, it will take at least 50 more years to approach gender equality globally, highlighting the urgent need for continued and more rapid progress. The World Bank said that ‘This means that millions of young women entering the workforce today will have to wait until retirement—many even longer—before they get equal rights’.

Details on the different categories tracked by the report: 

  • Mobility – Examines constraints on freedom of movement 
  • Workplace – Analyzes laws affecting women’s decisions to work 
  • Pay – Measures laws and regulations affecting women’s pay 
  • Marriage – Assesses legal constraints related to marriage 
  • Parenthood – Examines laws affecting women’s work after having children 
  • Assets – Considers gender differences in property and inheritance 
  • Pension – Assesses laws affecting the size of a woman’s pension 
  • Entrepreneurship – Analyzes constraints on women’s starting and running businesses

Inflation
February 2023

Reduced global supply chain pressures a sign of lower inflation on the horizon

The Federal Reserve Bank of New York Global Supply Chain Pressure Index (GSCPI) tracks the state of global supply chains using data from the transportation and manufacturing sectors. Recent data from the index shows that global supply chain pressures have significantly eased since the beginning of 2022.

In a new analysis, researchers at the NY Fed find that global supply factors, as captured by the GSCPI, have a strong association with US inflation levels as measured by both the producer price index (PPI) and the consumer price index (CPI).

The authors consider a scenario where the GSCPI returns to its historical average over the course of twelve months. Their model projects that this would result in a significant easing of consumer price inflation in 2023, bringing it to below 4.0 percent in the US. The normalization of the GSCPI would be consistent with a soft-landing scenario, where inflation levels return to a more sustainable level.

Productivity
February 2023

Productivity levels in the business services sector

The OECD Compendium of Productivity Indicators 2023 shows that smaller firms in many countries outperform larger ones in productivity levels in the business services sector. 

The data in the report shows that, on average across the business economy, larger firms are more productive than smaller ones, particularly in the manufacturing sector where economies of scale play a significant role. 

However, in the business services sector, smaller firms are found to have a productivity advantage over their larger counterparts in many OECD countries. According to the OECD this reflects smaller firms “competitive advantages in niche, high brand or high intellectual property content activities as well as the intensive use of information and communications technologies (ICT).” 

Note that the chart does not compare productivity levels between countries, only productivity differences within each country by firm size.

The OECD defines business services to include the following industries: wholesale and retail trade, repair of motor vehicles and motorcycles; transportation and storage; accommodation and food services; information and communication services; real estate activities; and professional, scientific, administrative and support activities.

Energy Transition
February 2023

Fossil fuel consumption subsidies surpassed $1 trillion globally in 2022

The global energy crisis has led to a surge in fossil fuel consumption subsidies, which reached a new all-time high in 2022. According to new estimates from the International Energy Agency (IEA), these subsidies exceeded USD 1 trillion for the first time, as global turmoil in energy markets pushed fuel prices well above what many consumers actually paid.

This record level of subsidies is more than double the 2021 levels, which were already nearly five times higher than in 2020, according to the IEA.

The IEA said that their analysis of the subsidies showed that “many of these government measures were not well targeted, and while they may have partially protected customers from skyrocketing costs, they artificially maintained fossil fuels’ competitiveness versus low-emissions alternatives.”

World Trade
February 2023

Trade barriers in the global service economy

Services play a crucial role in the global economy, contributing over two-thirds of the world’s gross domestic product (GDP) and accounting for a significant portion of foreign direct investment in advanced economies. The vast majority of workers worldwide are employed in this sector and most new jobs are created here.

The OECD Services Trade Restrictiveness Index (STRI) provides insights into the various regulations affecting trade in services across 22 service sectors. The STRI covers all member countries of the OECD as well as several non-OECD countries, including Brazil, China, India, Indonesia, Kazakhstan, Malaysia, Peru, Singapore, South Africa, Thailand, and Vietnam. These countries covered represent more than 80% of global services trade. 

The recently launched report covering 2022 shows that Japan, the United Kingdom, the Netherlands and the Czech Repulic displayed the lowest regulatory barriers to services trade in 2022. Indonesia, Thailand and Russia displayed the highest levels of restrictions in 2022. 

Overall, the report highlights that despite significant progress in services trade liberalization during 2022, several key sectors continue to face new barriers that limit market access and hinder competitiveness. In 2022, distribution services, sound recording, and architecture services emerged as the most liberal service sectors, while air transport services, legal services, and accounting and auditing services were identified as the most restrictive sectors, based on the average analysis across the countries studied.

Employment
February 2023

Global talent shortages: 3 in 4 companies reporting difficulty in finding the talent they need

According to a recent survey conducted by ManpowerGroup, global talent shortages reached a new 16-year high in 2022, with 3 in 4 companies reporting difficulty in finding the talent they need. This is compared to 54% in 2019 before the pandemic.

The ManpowerGroup Talent Shortage Survey involved more than 40,000 employers in 40 countries and territories worldwide across all industry sectors. 

The highest share of companies reporting difficulties finding talent were found in Taiwan (88%), Portugal (85%) and Singapore (84%), while the lowest were found in Colombia(61%), Slovakia (56%), Czech Republic (49%).

Energy Transition
February 2023

Global Carbon Inequality: Those who pollute less face more relative losses

The Climate Inequality Report 2023 by the World Inequality Lab, finds that those who pollute less face more relative losses, but also have less resources to adapt. 

To illustrate this “global carbon inequality”, the report shows that while the bottom 50% of the world population is exposed to 75% of relative income losses due to climate change, but only contributes to 12% of global emissions and owns just 2% of total personal wealth worldwide. Meanwhile, the top 10% of the world population faces just 3% of relative income losses, but is responsible for 48% of all emissions and also owns 76% of total personal wealth worldwide. 

See the appendix in the report for the full methodology behind the calculations. Importantly, the authors note that the global groups are the same when looking at losses and emissions (the bottom 50% of the distribution of losses is the same group as the bottom 50% of emitters). This is not the case for the distribution of personal wealth holders (the bottom 50% of this group is not exactly the same as the bottom 50% of emitters and loss bearers), yet the authors state in the report that they have a high degree of confidence that the levels will be similar if the datasets were reconciled.